The general equilibrium effects of fiscal policy
The general equilibrium effects of fiscal policy
The general equilibrium effects of fiscal policy

Create successful ePaper yourself
Turn your PDF publications into a flip-book with our unique Google optimized e-Paper software.
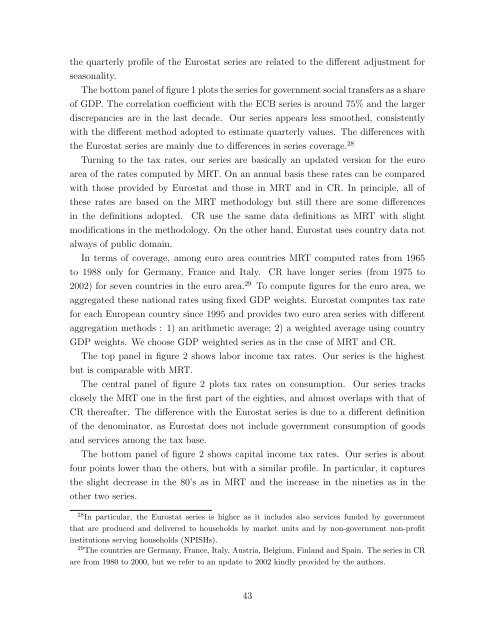
the quarterly pr<strong>of</strong>ile <strong>of</strong> the Eurostat series are related to the different adjustment forseasonality.<strong>The</strong> bottom panel <strong>of</strong> figure 1 plots the series for government social transfers as a share<strong>of</strong> GDP. <strong>The</strong> correlation coefficient with the ECB series is around 75% and the largerdiscrepancies are in the last decade. Our series appears less smoothed, consistentlywith the different method adopted to estimate quarterly values. <strong>The</strong> differences withthe Eurostat series are mainly due to differences in series coverage. 28Turning to the tax rates, our series are basically an updated version for the euroarea <strong>of</strong> the rates computed by MRT. On an annual basis these rates can be comparedwith those provided by Eurostat and those in MRT and in CR. In principle, all <strong>of</strong>these rates are based on the MRT methodology but still there are some differencesin the definitions adopted.CR use the same data definitions as MRT with slightmodifications in the methodology. On the other hand, Eurostat uses country data notalways <strong>of</strong> public domain.In terms <strong>of</strong> coverage, among euro area countries MRT computed rates from 1965to 1988 only for Germany, France and Italy.CR have longer series (from 1975 to2002) for seven countries in the euro area. 29 To compute figures for the euro area, weaggregated these national rates using fixed GDP weights. Eurostat computes tax ratefor each European country since 1995 and provides two euro area series with differentaggregation methods : 1) an arithmetic average; 2) a weighted average using countryGDP weights. We choose GDP weighted series as in the case <strong>of</strong> MRT and CR.<strong>The</strong> top panel in figure 2 shows labor income tax rates. Our series is the highestbut is comparable with MRT.<strong>The</strong> central panel <strong>of</strong> figure 2 plots tax rates on consumption.Our series tracksclosely the MRT one in the first part <strong>of</strong> the eighties, and almost overlaps with that <strong>of</strong>CR thereafter. <strong>The</strong> difference with the Eurostat series is due to a different definition<strong>of</strong> the denominator, as Eurostat does not include government consumption <strong>of</strong> goodsand services among the tax base.<strong>The</strong> bottom panel <strong>of</strong> figure 2 shows capital income tax rates. Our series is aboutfour points lower than the others, but with a similar pr<strong>of</strong>ile. In particular, it capturesthe slight decrease in the 80’s as in MRT and the increase in the nineties as in theother two series.28 In particular, the Eurostat series is higher as it includes also services funded by governmentthat are produced and delivered to households by market units and by non-government non-pr<strong>of</strong>itinstitutions serving households (NPISHs).29 <strong>The</strong> countries are Germany, France, Italy, Austria, Belgium, Finland and Spain. <strong>The</strong> series in CRare from 1980 to 2000, but we refer to an update to 2002 kindly provided by the authors.43