The general equilibrium effects of fiscal policy
The general equilibrium effects of fiscal policy
The general equilibrium effects of fiscal policy

You also want an ePaper? Increase the reach of your titles
YUMPU automatically turns print PDFs into web optimized ePapers that Google loves.
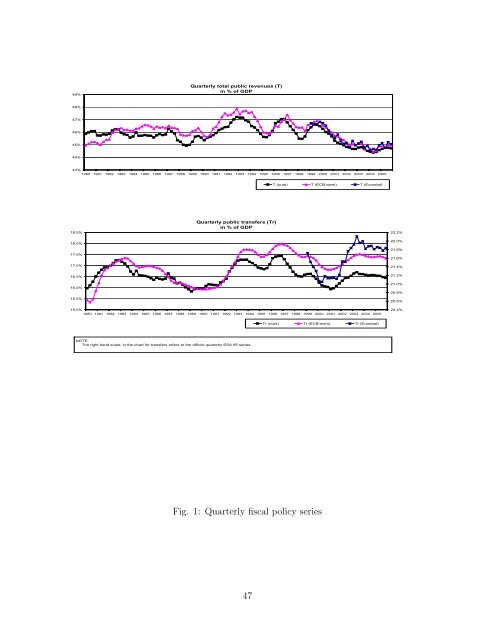
49%Quarterly total public revenues (T)in % <strong>of</strong> GDP48%47%46%45%44%43%1980 1981 1982 1983 1984 1985 1986 1987 1988 1989 1990 1991 1992 1993 1994 1995 1996 1997 1998 1999 2000 2001 2002 2003 2004 2005T (ours) T (ECB-awm) T (Eurostat)18.5%Quarterly public transfers (Tr)in % <strong>of</strong> GDP22.2%18.0%17.5%17.0%22.0%21.8%21.6%21.4%16.5%16.0%15.5%21.2%21.0%20.8%20.6%15.0%1980 1981 1982 1983 1984 1985 1986 1987 1988 1989 1990 1991 1992 1993 1994 1995 1996 1997 1998 1999 2000 2001 2002 2003 2004 200520.4%Tr (ours) Tr (ECB-awm) Tr (Eurostat)NOTE:<strong>The</strong> right hand scale, in the chart for transfers refers to the <strong>of</strong>ficial quarterly ESA 95 series.Fig. 1: Quarterly <strong>fiscal</strong> <strong>policy</strong> series47