Tools and Techniques for Color Image Retrieval - stuyresearch
Tools and Techniques for Color Image Retrieval - stuyresearch
Tools and Techniques for Color Image Retrieval - stuyresearch
Create successful ePaper yourself
Turn your PDF publications into a flip-book with our unique Google optimized e-Paper software.
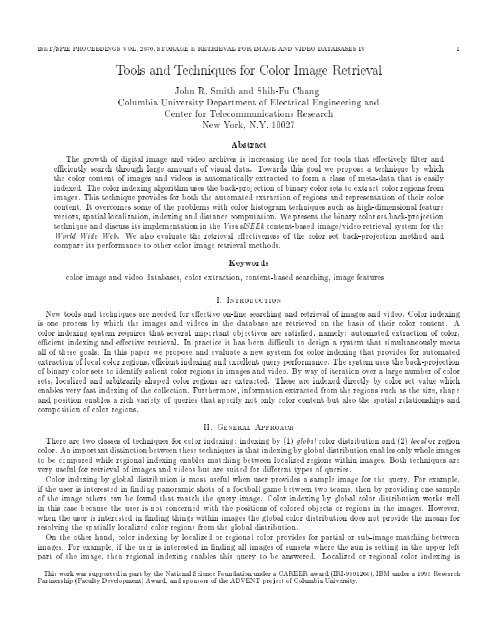
IS&T/SPIE PROCEEDINGS VOL. 2670, STORAGE & RETRIEVAL FOR IMAGE AND VIDEO DATABASES IV 1<strong>Tools</strong> <strong>and</strong> <strong>Techniques</strong> <strong>for</strong> <strong>Color</strong> <strong>Image</strong> <strong>Retrieval</strong>John R. Smith <strong>and</strong> Shih-Fu ChangColumbia University Department of Electrical Engineering <strong>and</strong>Center <strong>for</strong> Telecommunications ResearchNew York, N.Y. 10027AbstractThe growth of digital image <strong>and</strong> video archives is increasing the need <strong>for</strong> tools that eectively lter <strong>and</strong>eciently search through large amounts of visual data. Towards this goal we propose a technique by whichthe color content of images <strong>and</strong> videos is automatically extracted to <strong>for</strong>m a class of meta-data that is easilyindexed. The color indexing algorithm uses the back-projection of binary color sets to extract color regions fromimages. This technique provides <strong>for</strong> both the automated extraction of regions <strong>and</strong> representation of their colorcontent. It overcomes some of the problems with color histogram techniques such as high-dimensional featurevectors, spatial localization, indexing <strong>and</strong> distance computation. We present the binary color set back-projectiontechnique <strong>and</strong> discuss its implementation in the VisualSEEk content-based image/video retrieval system <strong>for</strong> theWorld Wide Web. We also evaluate the retrieval eectiveness of the color set back-projection method <strong>and</strong>compare its per<strong>for</strong>mance to other color image retrieval methods.Keywordscolor image <strong>and</strong> video databases, color extraction, content-based searching, image featuresI. IntroductionNew tools <strong>and</strong> techniques are needed <strong>for</strong> eective on-line searching <strong>and</strong> retrieval of images <strong>and</strong> video. <strong>Color</strong> indexingis one process by which the images <strong>and</strong> videos in the database are retrieved on the basis of their color content. Acolor indexing system requires that several important objectives are satised, namely: automated extraction of color,ecient indexing <strong>and</strong> eective retrieval. In practice it has been dicult to design a system that simultaneously meetsall of these goals. In this paper we propose <strong>and</strong> evaluate a new system <strong>for</strong> color indexing that provides <strong>for</strong> automatedextraction of local color regions, ecient indexing <strong>and</strong> excellent query per<strong>for</strong>mance. The system uses the back-projectionof binary color sets to identify salient color regions in images <strong>and</strong> video. By way of iteration over a large number of colorsets, localized <strong>and</strong> arbitrarily shaped color regions are extracted. These are indexed directly by color set value whichenables very fast indexing of the collection. Furthermore, in<strong>for</strong>mation extracted from the regions such as the size, shape<strong>and</strong> position enables a rich variety of queries that specify not only color content but also the spatial relationships <strong>and</strong>composition of color regions.II. General ApproachThere are two classes of techniques <strong>for</strong> color indexing: indexing by (1) global color distribution <strong>and</strong> (2) local or regioncolor. An important distinction between these techniques is that indexing by global distribution enables only whole imagesto be compared while regional indexing enables matching between localized regions within images. Both techniques arevery useful <strong>for</strong> retrieval of images <strong>and</strong> videos but are suited <strong>for</strong> dierent types of queries.<strong>Color</strong> indexing by global distribution is most useful when user provides a sample image <strong>for</strong> the query. For example,if the user is interested in nding panoramic shots of a football game between two teams, then by providing one sampleof the image others can be found that match the query image. <strong>Color</strong> indexing by global color distribution works wellin this case because the user is not concerned with the positions of colored objects or regions in the images. However,when the user is interested in nding things within images the global color distribution does not provide the means <strong>for</strong>resolving the spatially localized color regions from the global distribution.On the other h<strong>and</strong>, color indexing by localized or regional color provides <strong>for</strong> partial or sub-image matching betweenimages. For example, if the user is interested in nding all images of sunsets where the sun is setting in the upper leftpart of the image, then regional indexing enables this query to be answered. Localized or regional color indexing isThis work was supported in part by the National Science Foundation under a CAREER award (IRI-9501266), IBM under a 1995 ResearchPartnership (Faculty Development) Award, <strong>and</strong> sponsors of the ADVENT project of Columbia University.
2 IS&T/SPIE PROCEEDINGS VOL. 2670, STORAGE & RETRIEVAL FOR IMAGE AND VIDEO DATABASES IVgenerally more dicult because it requires the eective extraction <strong>and</strong> representation of local regions. In both cases asystem is needed <strong>for</strong> the automated extraction <strong>and</strong> ecient representation of color so that the query system provides <strong>for</strong>eective image <strong>and</strong> video retrieval. In this paper we present a technique that applies to both global <strong>and</strong> localized colorregion extraction <strong>and</strong> indexing.The feature extraction system consists of two stages: (1) extraction of regions <strong>and</strong> (2) extraction of region propertiesas shown in Figure 1. An automated system per<strong>for</strong>ms both stages without human assistance. It is typically stage 1 thatis either manual or semi-automatic when the system is not fully automated. The representation of region color is oftenmore robust when the region extraction is not automated.<strong>Image</strong>Fig. 1.Region Extraction/Segmentation1. semi-automatic or manual,2. fixed block boundaries,3. color segmentation,4. color set back-projectionRegion PropertyExtraction1. mean color,2. dominant color,3. color histogram,4. binary color setGeneral approach <strong>for</strong> color image feature extraction.FeatureListA. Region Extraction/SegmentationThe goal of the region extraction system is to obtain the spatial boundaries of the regions that will be of most interestto the user. The process of region extraction diers from image segmentation. Segmentation corresponds to a completepartitioning of the image such that each image point is assigned to one segment. With region extraction an image pointmay be assigned to many regions or to none. Conceptually, this is more desirable than segmentation because it supportsan object-oriented representation of image content. For example, an image point corresponding to the wheel of a car cansimultaneously belong to the two dierent regions that encapsulate respectively the wheel <strong>and</strong> the car as a whole.There are several techniques <strong>for</strong> region extraction. The least complex method involves (1) manual or semi-automatedextraction. In this process the images are evaluated by people <strong>and</strong> the pertinent in<strong>for</strong>mation is conrmed or identiedvisually. This is extremely tedious <strong>and</strong> time-consuming <strong>for</strong> large image <strong>and</strong> video databases. Another procedure <strong>for</strong>region extraction utilizes a (2) xed block segmentation of the images. By representing color content of small blocksindependently there is greater likelihood that matches between regions can be obtained. However, it is dicult topick the scale at which images should be best blocked. A third technique involves (3) color segmentation. There havebeen several techniques recently proposed <strong>for</strong> this such as color pairs [CLP94] <strong>and</strong> <strong>for</strong>eground object color extractiontools [HCP95].We propose a new technique which partly employs the color histogram (4) back-projection developed by Swain <strong>and</strong>Ballard <strong>for</strong> matching images [SB91][SC95]. The basic idea behind the back-projection algorithm is that the most likelylocation of a spatially localized color histogram within an image is found by the back-projection onto the image of thequotient of the query histogram <strong>and</strong> the image histogram. More specically, given query histogram g[m] <strong>and</strong> imagehistogram h[m], let s[m] = min(g[m]=h[m]; 1). Then replace each point in the image by the corresponding condencescore B[m; n] =s[I[m; n]]. After convolving B[m; n] with a blurring mask, the location of the peak value corresponds tothe most likely location of the model histogram within the image. In small image retrieval applications this computationis per<strong>for</strong>med at the time of query to nd objects within images [SB91][EM95]. However, <strong>for</strong> a large collection it is notfeasible to compute the back-projection on the y. A faster color indexing method is needed.We extend the back-projection to the retrieval from large databases by precomputing <strong>for</strong> all images in the databasethe back-projections with predened color sets. By processing these back-projections ahead of time, the system returnsthe best matches directly <strong>and</strong> without new computation at the time of the query. More specically, we modify the backprojectionalgorithm so that it back-projects binary color sets onto the images. Instead of blurring the back-projectedimages we use morphological ltering to identify the color regions. This process is described in greater detail in latersections.B. Region Feature ExtractionOnce the image regions are identied, each region is characterized <strong>and</strong> represented using a feature set. The goal ofcolor representation is to accurately capture the salient color characteristics of the region in a low-dimensional vector.Two choices <strong>for</strong> simple color features are (1) mean color <strong>and</strong> (2) dominant color of the region. They both use only a 3-D
4 IS&T/SPIE PROCEEDINGS VOL. 2670, STORAGE & RETRIEVAL FOR IMAGE AND VIDEO DATABASES IVFig. 3.(a) VisualSEEk Java user interface <strong>and</strong> (b) query returns with give me more feature of VisualSEEk.A. <strong>Color</strong> HistogramA color histogram denotes the joint probabilities of the intensities of the three color channels. The color histogram isdened ash R;G;B [r;b;g]=N ProbfR = r;G= g; B = bg (1)where R, G <strong>and</strong> B are the three color channels <strong>and</strong> N is the number of pixels in the image. The color histogram iscomputed by discretizing the colors within the image <strong>and</strong> counting the number of pixels of each color. Since the numberof colors is nite, it is usually more convenient to trans<strong>for</strong>m the three channel histogram into a single variable histogram.Given an RGB image, one trans<strong>for</strong>m is given by m = r + N r g + N r N g b, where N r ;N g <strong>and</strong> N b are the number of bins<strong>for</strong> colors red, blue <strong>and</strong> green, respectively. This gives the single variable histogramB. <strong>Color</strong> Set NotationB.1 Trans<strong>for</strong>mationh[m] =N ProbfM = mg: (2)The color set representation is dened as follows: given the color triple (r;g;b) in the 3-D RGB color space <strong>and</strong> thetrans<strong>for</strong>m T between RGB <strong>and</strong> a generic color space denoted XY Z, <strong>for</strong> each (r;g;b) let the triple (x; y; z) represent thetrans<strong>for</strong>med color such that(x; y; z) =T (r;g;b): (3)B.2 QuantizationLet Q M be a vector quantizer function that maps a triple (x; y; z) to one of M bins. Then m, where m 2f0 :::M,1g,is the index of color (x; y; z) assigned by the quantizer function <strong>and</strong> is given byB.3 Binary <strong>Color</strong> Spacem = Q M (x; y; z): (4)Let B M be an M dimensional binary space that corresponds to the index produced by Q M such that each index valuem corresponds to one axis in B M .Denition 1: <strong>Color</strong> Set, ^c. A color set is a binary vector in B M . A color set corresponds to a selection of colors fromthe quantized color space.For example, let T trans<strong>for</strong>m RGB to HSV <strong>and</strong> let Q M where M =8vector quantize the HSV color space to 2 hues,2 saturations <strong>and</strong> 2 values. Q M assigns a unique index m to each quantized HSV color. Then B 8 is the 8-dimensional
FEBRUARY 1, 1996 5binary space whereby each axis in B 8 corresponds one of the quantized HSV colors. Then a color set ^c contains aselection from the 8 colors. If the color set corresponds to a unit length binary vector then one color is selected. If acolor set has more than one non-zero value then several colors are selected. For example, the color set ^c = (10010100)corresponds to the selection of three colors, m =7;m= 4 <strong>and</strong> m = 2, from the quantized HSV color space.TQ , M1B M1T – 1 Q –,1M13-D <strong>Color</strong> Histogram Binary <strong>Color</strong> SetFig. 4.Trans<strong>for</strong>mation between 3-D color histogram <strong>and</strong> binary color set.C. <strong>Color</strong> RepresentationIn order <strong>for</strong> color sets to provide a useful characterization of region color, several objectives must be met. Firstly, eachcolor in the binary color space B M must be visually distinguishable from the others. Secondly, the binary color space B Mmust satisfactorily include all distinguishable colors. The condition is usually application specic. For example, medical<strong>and</strong> satellite images have quite dierent sets of distinguishable colors. The trans<strong>for</strong>mation T <strong>and</strong> quantization Q M aredesigned to produce a representation that meets these objectives.C.1 <strong>Color</strong> SpaceThe rst design parameter is the trans<strong>for</strong>mation T by which the new color space is reached from the RGB space.The RGB space has the major deciency of not being perceptually uni<strong>for</strong>m. Other color spaces such asCIE , LAB,CIE , LUV <strong>and</strong> Munsell oer improved perceptual uni<strong>for</strong>mity [WS82]. In general they represent with equal emphasisthe three color variants that characterize color: hue, lightness <strong>and</strong> saturation. This separation is attractive becausecolor image processing per<strong>for</strong>med independently on the color channels does not introduce false colors (hues) [Rus95].Furthermore, it is easier to compensate <strong>for</strong> artifacts <strong>and</strong> color distortions. For example, lighting <strong>and</strong> shading artifactsare typically isolated to the lightness channel. However, these color spaces are often inconvenient due to the necessarynon-linearity in <strong>for</strong>ward <strong>and</strong> reverse trans<strong>for</strong>mations with RGB space. We utilize a tractable <strong>for</strong>m of the hue, lightness<strong>and</strong> saturation trans<strong>for</strong>m from RGB to HSV that has the above mentioned characteristics <strong>and</strong> is non-linear but easilyinvertible. The trans<strong>for</strong>mation T from RGB to HSV is accomplished through the following equations [Hun89]: let thecolor triple (r;g;b) dene a color in RGB space <strong>and</strong> let (h; s; v) be the trans<strong>for</strong>med triple in HSV color space. Forr;g;b2 [0 :::1] then T gives h 2 [0 :::6] <strong>and</strong> s; v 2 [0 :::1] bylet r =v , rv = max(r;g;b);s = v , min(r;b;g)vv , min(r;b;g) ; g = v , gv , min(r;b;g) ; v , bb =h =8>:v , min(r;b;g)5+ b if r = max(r;g;b) <strong>and</strong> g = min(r;b;g)1 , g if r = max(r;g;b) <strong>and</strong> g 6= min(r;b;g)1+r if g = max(r;g;b) <strong>and</strong> b = min(r;b;g)3 , b if g = max(r;g;b) <strong>and</strong> b 6= min(r;b;g)3+g if b = max(r;g;b) <strong>and</strong> r = min(r;b;g)5 , r otherwise(5)C.2 QuantizationThe next design parameter is the quantization Q M of the color space. The HSV color space is cylindrical, as illustratedin Figure 5. The long axis represents value: blackness to whiteness. Distance from the axis represents saturation: amountof color present. The angle around the axis is the hue: tint or tone. Since hue represents the most signicantcharacteristicof the color, it requires the most ne quantization. In the hue circle the primaries red, green <strong>and</strong> blue are separated
FEBRUARY 1, 1996 7B. Stage 2 { <strong>Color</strong> Set Back-ProjectionThe next stage involves the extraction of the color regions from the images <strong>and</strong> is illustrated in Figure 8. This is doneby systematically iterating over color sets <strong>for</strong> the image. The back-projection of the binary color set onto the imageproduces a bi-level image B[m; n]. The levels correspond to the selected <strong>and</strong> un-selected pixels <strong>for</strong> the specied color set.After back-projection the bi-level image is ltered morphologically to (1) eliminate spots <strong>and</strong> (2) connect neighboringregions. The binary color set back-projection algorithm is given as follows: given binary color set ^c <strong>and</strong> processed imageR[m; n]:1. Generate the bi-level image B[m; n] from back-projection of color set ^c: let k = R[m; n] then B[m; n] =c[k].2. Filter B[m; n] with the 5 5box median lter U[m; n] to produce B 0 [m; n]. Since B[m; n] is a bi-level image, themedian statistic is equivalent to the majority computation.color set ĉBProjU[ m,n]τm levelsR[ m,n]bi-level imageB[ m,n]bi-level imageB′ [ mn , ]labeled regionsFig. 8. Second <strong>and</strong> third stages of color region extraction: (1) back-projection of color set ^c (in this example ^c has one color selected) ontoprocessed image R[m; n] produces bi-level image B[m; n], (2) ltering with U[m; n] produces B 0 [m; n] <strong>and</strong> (3) thresholding determinessurviving regions.C. Stage 3 { Back-Projection ThresholdingAfter the back-projection with the color set, the ltered image B 0 [m; n] is analyzed. The rst step in this analysis is asequential labeling algorithm applied to B 0 [m; n] that assigns each isolated region a unique non-zero label. Each uniquelylabeled region is analyzed in regard to several thresholds. The motivation <strong>for</strong> these thresholds is to extract regions thatmeet minimum size constraints <strong>and</strong> provide a satisfactory representation of the colors in the color set ^c that producedthe B 0 [m; n]. If a region does not meet all the thresholds then it is assigned the zero label. The thresholds are describednext <strong>and</strong> are summarized in Table I. These threshold values are appropriate <strong>for</strong> the full size color images <strong>and</strong> are rescaledto correspond to the subsampled image size.The threshold a corresponds to region size. The region must contain more than a =32 2 pixels to be signicant. Thisvalue allows <strong>for</strong> suciently small regions to be extracted. The second threshold b corresponds to the region's absoluterepresentation of each color in the color set. If a selected color from the color set does not contribute at least b =32 2pixels to the region then it is not added. The third threshold c corresponds to the region's relative representation ofeach selected color in the color set. It requires that each selected color from the color set contributes at least c = 20%of the region area.H[m] = <strong>Image</strong> histogram, ^c = binary color set, L[m] = local region histogram.threshold value condition description a 1024Pn L[n] a region area b 1024 c[m] =1! L[m] b absolute contribution of color m to region c 0:2 c[m] =1! L[m] cPnL[n] relative contribution of color m to region 0 1024 c[m] =1! H[m] P 0 global histogram 1 1024 c[m] = 1 <strong>and</strong> H[m] 0 ! H[m] , L n n[m] 1 global histogram residueTABLE I<strong>Color</strong> region <strong>and</strong> region extraction thresholds <strong>for</strong> 128 x 128 color image.If an extracted color region does not pass one of the above thresholds then it will not be indexed by that color set. Ifa region is rejected because one of the selected colors from the color set is not suciently represented in the region, thenthe region may still be extracted using a reduced color set that omits the under-represented color. En<strong>for</strong>cing the colorset thresholds prevents the unnecessary <strong>and</strong> redundant extraction of multiple-color regions.
8 IS&T/SPIE PROCEEDINGS VOL. 2670, STORAGE & RETRIEVAL FOR IMAGE AND VIDEO DATABASES IVD. Iteration over <strong>Color</strong> SetsTo help prune the iteration over the great number of possible color sets we utilize two additional thresholds in theiteration system. The algorithm back-projects only those color sets ^c that meet minimum support constraints. The colorset ^c is back-projected onto the image only if thresholds are met that predict whether the back-projection will producenew <strong>and</strong> desirable regions.D.1 Threshold 0The threshold 0 corresponds to the image's support <strong>for</strong> each color in the color set. A color set ^c used <strong>for</strong> the backprojectiononly if <strong>for</strong> m such that c[m] = 1 there are at least 0 pixels in the image of color m. In other words, if colorm is selected in the color set then color m must be present in the global histogram with a support of 0 samples.D.2 Threshold 1The threshold 1 corresponds to the un-allocated colors from the global histogram. After a color set is back-projected<strong>and</strong> regions are extracted, the colors from the extracted regions are subtracted from the global image histogram. A colorset ^c is used <strong>for</strong> the back-projection only if <strong>for</strong> m such that c[m] = 1 there are at least 1 pixels in the global residuehistogram of the color m. In other words, if a color set includes color m then 0 samples of color m must be still beun-allocated to previously extracted regions. This threshold works well when the color sets are explored in order ofincreasing magnitude. For example, single color { color sets are explored rst, followed by two color { color sets, etc.This gives desirable results because color regions are extracted in order of dominance.If 0 is not met then ^c contains colors that are not represented suciently by any region. The back-projection of this^c <strong>and</strong> all its super-sets are non-generative. If 0 is met while 1 is not met then at query time a color region containingall of the colors in ^c can be reconstructed using subsets of ^c <strong>and</strong> spatial composition. There<strong>for</strong>e, exploration of ^c <strong>and</strong> itssuper-sets generates redundant in<strong>for</strong>mation. The color set iteration procedure is summarized as follows:1. Single color { color sets(a) Given the image histogram H[m] nd all m = m where H[m] 0 .(b) For each m construct unit length ^c where c[k] = 1 <strong>for</strong> k = m <strong>and</strong> c[k] = 0 otherwise. Back-project each ^c ontoimage R[m; n] <strong>and</strong> extract regions. For each region n record the local region histogram L n [m].(c) Compute residue histogram H r [m] =H[m] , P n L n[m].2. Two color { color sets(a) Find all l = l <strong>and</strong> m = m where l 6= m, H[l] 0 , H[m] 0 <strong>and</strong> H r [l] 1 , H r [m] 1 .(b) For each pair l <strong>and</strong> m construct ^c where c[k] =1<strong>for</strong>k = l or k =m <strong>and</strong> c[k] = 0 otherwise. Back-project each ^conto image R[m; n] <strong>and</strong> extract regions. For each region n record the local region histogram L n [m].(c) Update residue histogram H r [m] =H r [m] , P n L n[m].3. Three color { color sets, etc., repeat above.E. Stage 4{Region Feature ExtractionAfter the analysis of B 0 [m; n] in regard to the above mentioned thresholds the features are extracted from all remainingnon-zero labeled regions. For each of these regions the generative color set ^c is recorded <strong>and</strong> the region area <strong>and</strong> locationare measured. The region location is represented by the minimum bounding rectangle (MBR) that encloses the region.The features are added to the feature table which compiles the meta-data to be used to answer the color region queries.<strong>Color</strong> indexing using the binary color sets is accomplished by indexing the color region feature table on the color setattribute. Since this eld contains a binary vector, a binary tree is an appropriate index structure. In a straight-<strong>for</strong>wardcolor set query such asnd all images that have a region with precisely this color set, the matches are found by lookingup the color set value in the index <strong>and</strong> reading o the images. However, more interesting queries specify several colorregions <strong>and</strong> their spatial layout.The VisualSEEk system presently supports queries that include up to three color regions <strong>and</strong> their spatial positions.The system allows the user to select priorities <strong>for</strong> matching color <strong>and</strong> spatial positions to the items in the database.VisualSEEk allows the user to specify whether the color matches are to be exact match orbest match. Exact matchmeans the color sets must be exactly equal <strong>for</strong> a match. For best match the system also examines nearby color sets <strong>and</strong>assigns matches a color distance so that the system returns items in order of color set distance. VisualSEEk also allowsthe user to specify whether the spatial locations in the query specify are exact or best locations or none. For best matchthe system assigns a spatial distance depending on the drift from the locations specied in the query. In the case of none
FEBRUARY 1, 1996 9the system ignores the location parameters. The system also allows the user to specify the maximum number of imagesN to be returned by the query.F. <strong>Color</strong> Set DistanceThe distance between color sets utilizes the walk distance in HSV color space to determine the distance betweenindividual colors. For the 166 colors in the binary color space B 166 a table with entries d m0;m 1is constructed that recordsthe distance between all individual colors. That distance is computed as follows: given two colors corresponding to axes m 0<strong>and</strong> m 1 in B 166 retrieve the HSV values through the inverse of vector quantization Q M . This gives ( ~ h i ; ~s i ; ~v i )=Q ,1M (m i)<strong>for</strong> i =0; 1, where ~ h i 2f0 :::18g; ~s i 2f0; 1; 2g <strong>and</strong> ~v i 2f0; 1; 2g. Then the distance between the colors corresponding tom 0 <strong>and</strong> m 1 is given byd m0;m 1= min(j ~ h 0 , ~ h 1 j; 18 ,j ~ h 0 , ~ h 1 j)+j~s 0 , ~s 1 j + j~v 0 , ~v 1 j: (6)The total distance between two unit length (single color) color sets ^c 0 <strong>and</strong> ^c 1 is given byd c (^c 0 ; ^c 1 )=XXM,1 M,1m 0=0 m 1=0c 0 [m 0 ] d m0;m 1 c 1 [m 1 ]: (7)The VisualSEEk system currently supports the assignment of a single color (unit length ^c) toeach region in the query.The assignment in the query of multiple colors to each region <strong>and</strong> the more general <strong>for</strong>mula <strong>for</strong> distance between anytwo non-zero color sets has not yet been implemented in the system.G. Query <strong>Color</strong> Set Distance <strong>and</strong> Back-oTo answer a color set query that does not specify exact match, a color set distance back-o is used. The idea is toreturn rst the zero distance items d c = 0 then the d c = 1 items, etc., until N images are found. For the d c = 0 matchesthe specied color set is used verbatim. For the d c = 1 matches the group of color sets that are within distance one fromthe query color set are found. Then each of these color sets is looked-up in the index <strong>and</strong> the matches are read o. Thisis repeated <strong>for</strong> the d c = 2 matches, etc., until N images are retrieved. By using this method we avoid an exhaustivesearch of all regions in the database <strong>for</strong> each specied region in the query.When several color regions are specied in the query the individual color region P distances are summed. This computesK,1the overall query color distance value D c <strong>for</strong> each image match using D c =k=0 dk cwhere K is the number of regionsin the query. The current implementation requires that matches are found <strong>for</strong> all specied regions in the query in order<strong>for</strong> an image to be considered as a match.H. Spatial Layout Distance <strong>and</strong> Back-oThe matches in spatial layout are found by assigning each matched color region from an image in the database toone of three spatial classes with corresponding spatial distances: (1) encapsulation: d s = 0, query region completelycompletely encloses the image region, (2) intersection: d s = 1, query region intersects with the border of the imageregion, (3) disjoin: d s = 2, query region does not overlap with the image region. The P overall image spatial distance D sK,1is computed by summing the individual region's spatial distance scores using D s = k=0 dk s where K is the number ofregions in the query. The query server assigns a total match score to each image match with K regions. The images arereturned to the user in lowest match score order. The match score D match is given byD match = D c + D s =K,1Xi=0XK,1d i c +j=0d j s =V. Sample <strong>Image</strong> QueriesK,1Xk=0(d k c + d k s): (8)The color set region extraction <strong>and</strong> representation method is evaluated by conducting a variety of image retrievalexperiments. The color set method is compared to other color histogram approaches <strong>for</strong> color indexing. The queryexamples show how both global <strong>and</strong> local color indexing complement each other when integrated into a complete system<strong>for</strong> color image retrieval.
10 IS&T/SPIE PROCEEDINGS VOL. 2670, STORAGE & RETRIEVAL FOR IMAGE AND VIDEO DATABASES IVA. <strong>Retrieval</strong> EectivenessTwo metrics <strong>for</strong> retrieval eectiveness are recall <strong>and</strong> precision. Recall signies the proportion of relevant images in thedatabase that are retrieved in response to a query. Precision is the proportion of the retrieved images that are relevant tothe query [Jon81]. More precisely, let A be the set of relevant items, let B be the set of retrieved items <strong>and</strong> a; b; c <strong>and</strong> dare given in Figure 9 then recall <strong>and</strong> precision are dened as the following conditional probabilities:recall = P (BjA) =P (A [ B)P (A)= aa + c<strong>and</strong> precision = P (AjB) =P(A [ B)P (B)= aa + b : (9)As indicated by the <strong>for</strong>mulas the measures of recall <strong>and</strong> precision require that the relevance to the query of each item inthe database is established ahead of time. For the experiments this was done <strong>for</strong> each query by subjectively assigning oneof three values to each image in the database: relevant = 1, partially or marginally relevant = 0.5 <strong>and</strong> not relevant =0.The relevance value corresponds to the probability that the item is relevant to the query.Fig. 9.dcabRelevantNo YesRetrievedarecall = -----------Yes Noa+ca c Aaprecision = -----------a+bb dbfallout = -----------b+dB<strong>Retrieval</strong> eectiveness: a + b + c + d = full database, a + c = relevant items <strong>and</strong> a + b = retrieved items.B. <strong>Color</strong> <strong>Retrieval</strong> <strong>Techniques</strong>Several color indexing methods that use color histograms were also evaluated to provide comparison <strong>for</strong> the colorsets method. Four image retrieval techniques were used in the queries: (1) euclidean histogram distance, (2) histogramintersection, (3) quadratic histogram distance <strong>and</strong> (4) color sets.B.1 Histogram Euclidean DistanceThe euclidean distance between two color histograms h <strong>and</strong> g is given byd E (h; g) =XM,1m=0(h[m] , g[m]) 2 (10)In this distance <strong>for</strong>mula there is only comparison between the identical bins in the respective histograms. Two dierentbins may represent perceptually similar colors but are not compared cross-wise. All bins contribute equally to thedistance.B.2 Histogram IntersectionThe color histogram intersection was proposed <strong>for</strong> color image retrieval in [SB91]. The intersection of histograms h<strong>and</strong> g is given by:P M,1m=0d I (h; g) =min(h[m];g[m])P M,1min( h[m M,1m 0=0 0]; g[m (11)m 1=0 1])<strong>Color</strong>s not present in the user's query image do not contribute to the intersection. This <strong>for</strong>mulation diers from thatproposed by Swain <strong>and</strong> Ballard [SB91] in order to make it a true distance metric. The intersection <strong>for</strong>mula in [SB91] isnot symmetric in h <strong>and</strong> g <strong>and</strong> there<strong>for</strong>e is not a distance metric.B.3 Histogram Quadratic DistanceThe color histogram quadratic distance is used by the QBIC system [FFN + 93].histograms h <strong>and</strong> g is given by:d Q (h; g) =XXM,1 M,1m 0=0 m 1=0(h[m 0 ],g[m 0 ])a m0;m 1(h[m 1 ],g[m 1 ]) = ,XXM,1 M,1m 0=0 m 1=0The quadratic distance between(h[m 0 ],g[m 0 ])d m0;m 1(h[m 1 ],g[m 1 ]): (12)
FEBRUARY 1, 1996 11The quadratic distance <strong>for</strong>mula uses the cross-correlation a m0;m1between histogram bins based on the perceptual similarityof the colors m 0 <strong>and</strong> m 1 . One appropriate value <strong>for</strong> the cross-correlation is given by a m0;m1 =1, d m0;m1whered m0;m1is the distance between color m 0 <strong>and</strong> m 1 normalized with respect to the maximum distance. In this case thehistogram quadratic distance <strong>for</strong>mula reduces to the <strong>for</strong>m on the right [HSE + 95].C. Sample QueriesWe evaluated the retrieval eectiveness of the color indexing approaches on a test set of 3100 color images. The testset includes color images from a variety of subjects such as cities, nature, animals <strong>and</strong> transportation. For each querythe retrieval eectiveness using recall <strong>and</strong> precision was recorded. The overall query process is illustrated in Figure 10.At each round in the query process the user can (1) initiate a new color set query using the interface tools or (2) use oneof the retrieved images as a seed image. After L rounds the user zeros in on the desired image.or333 ...orglobal444global{ } 5550color setqueryĉ01267.K-1{ ĉ} 1 { ĉ} 2 { ĉ} L – 1001267.K-1orglobalmatchround 0 round 1 round 2 round L-1Fig. 10. Query paths <strong>for</strong> image queries in VisualSEEk, N = 3. Starting from color set query f^cg 0 constructed using interface tools, round 0yields N images. After viewing the matches the user makes decision to either (1) <strong>for</strong>mulate a new color set query f^cg 1 or (2) use areturned image <strong>for</strong> a give me more color query to nd similar images. The process is repeated until desired image is found at round L , 1.1267.K-10234567.K-1C.1 Query 1 - Purple RegionsThe goal of this query is to retrieve all images that contain a signicant purple region somewhere in the image. Priorto the trials each of the 3100 images was inspected <strong>and</strong> assigned a relevance to the purple region query. A three-valuerelevance was used. The query results are shown in Figure 11(a). The color set indexing method out-per<strong>for</strong>med all othersin both retrieval eectiveness <strong>and</strong> query response time. Furthermore, the color set method was able to retrieve all 97purple region images with an overall precision of 0.625. For the color histogram queries a seed image was picked from thecollection by the user that was most \typical" of the desired images. The color set query was <strong>for</strong>mulated in VisualSEEkby simply drawing one purple region <strong>and</strong> by selecting best match in color <strong>and</strong> none <strong>for</strong> match in space.C.2 Query 2 - SunsetsThe goal of this query is to retrieve all images of sunsets which come in various avors. A sunset image was denedto contain a glowing horizon with the sun still partially visible. Prior to the trials each of the 3100 images was inspected<strong>and</strong> assigned a relevance. The query results are shown in Figure 11(b). The results are interesting. Since the sunsetimages in the archive do not have atypical spatial layout of color regions, the color set retrieval precision was initiallylow, also returning many images of yellow <strong>and</strong> orange owers. When a \typical" sunset image was used to seed the colorhistogram queries the retrieval eectiveness was signicantly better. However, if the user desires that all sunset imagesare to be returned with the highest possible precision then the color set method is far superior. In order to return all83 sunsets using color histograms nearly all (3100) images must be returned. However, using color sets all sunset imagesare found with a precision of 0.2 (415 returned images).C.3 Query 3 - Find the <strong>Image</strong>The goal of these two queries is to nd particular images: (1) image with a red sports car <strong>and</strong> (2) image with a Britishdouble decker bus (see Figure 7). The user was shown the color images <strong>and</strong> asked to use the system to compose roundsof either (1) color set or (2) give me more color histogram queries to nd them. The user was not given an appropriateinitial seed image <strong>and</strong> had to pick from 21 r<strong>and</strong>omly supplied images. The same set was supplied <strong>for</strong> all queries. In allquery rounds the return number N =21was used. At each round l, M l out of N images are new matches not returnedin rounds 0 :::l, 1. The trials are summarized below. The color set method does very well in these types of queries.
12 IS&T/SPIE PROCEEDINGS VOL. 2670, STORAGE & RETRIEVAL FOR IMAGE AND VIDEO DATABASES IV1Precision vs. Recall1Precision vs. Recall0.9optimal0.90.80.7color set0.80.7Precision0.60.50.4intersectionPrecision0.60.50.4intersection0.3euclidean0.3quadratic0.2quadratic0.2color set0.100 0.1 0.2 0.3 0.4 0.5 0.6 0.7 0.8 0.9 1Recall0.1euclidean00 0.1 0.2 0.3 0.4 0.5 0.6 0.7 0.8 0.9 1RecallFig. 11. <strong>Retrieval</strong> eectiveness (a) Query 1 { Purple regions, the symbol 'o' marks the recall <strong>and</strong> precision values at point <strong>for</strong> N =21<strong>and</strong>(b) Query 2 { Sunsets.The color histogram retrievals are largely dependent on the seed images. It takes more rounds to nd the desired imagesusing only give me more queries. The best overall per<strong>for</strong>mance combines both type of queries: local color set <strong>and</strong> globalhistogram. In this case the color set query provides the initial seed images to be used <strong>for</strong> subsequent histogram queries.histogram histogram color set +euclidean intersection color set histogramimage bus car bus car bus car bus carrounds = L 8 5 9 5 1 3 1 2unique returns = P L,1l=0 M l 101 72 115 75 21 47 21 35VI. ConclusionWe presented a system <strong>for</strong> automated extraction of local color regions which provides <strong>for</strong> ecient indexing <strong>and</strong> eectivecolor image retrieval. The system uses the back-projection of binary color sets to identify salient color regions in images.Prior to queries a table of meta-data is created by the systematic iteration over color sets to extract localized color regions.The table is indexed directly by color set value which enables very fast indexing of the image collection. The color setapproach also allows queries to include multiple regions <strong>and</strong> their spatial layout. We also described the implementationof the color set techniques in the VisualSEEk content-based image/video retrieval system. Some sample queries <strong>and</strong>initial evaluation results based on recall <strong>and</strong> precision were also presented.References[Cha95] S.-F. Chang. Compressed-domain techniques <strong>for</strong> image/video indexing <strong>and</strong> manipulation. In I.E.E.E. International Conferenceon <strong>Image</strong> Processing, October 1995.[CLP94] T.-S. Chua, S.-K. Lim, <strong>and</strong> H.-K. Pung. Content-based retrieval of segmented images. In ACM Multimedia 1994, October 1994.[CS95] S.-F. Chang <strong>and</strong> J. R. Smith. Extracting multi-dimensional signal features <strong>for</strong> content-based visual query. InSPIE Symposium onVisual Communications <strong>and</strong> <strong>Image</strong> Processing, May 1995. Best paper award.[EM95] F. Ennesser <strong>and</strong> G. Medioni. Finding waldo, or focus of attention using local color in<strong>for</strong>mation. I.E.E.E. Transactions on PatternAnalysis <strong>and</strong> Machine Intelligence, 17(8), August 1995.[FFN + 93] C. Faloutsos, M. Flickner, W. Niblack, D. Petovic, W. Equitz, <strong>and</strong> R. Barber. Ecient <strong>and</strong> eective querying by image content.[HCP95]IBM RJ 9453 (83074), August 1993.W. Hsu, T. S. Chua, <strong>and</strong> H. K. Pung. An integrated color-spatial approach to content-based image retrieval. In ACM Multimedia1995, November 1995.[HSE + 95] J. Hafner, H. S. Sawhney, W. Equitz, M. Flickner, <strong>and</strong> W. Niblack. Ecient color histogram indexing <strong>for</strong> quadratic <strong>for</strong>m distancefunctions. I.E.E.E. Transactions on Pattern Analysis <strong>and</strong> Machine Intelligence (PAMI), July 1995.[Hun89] R. W. G. Hunt. Measuring <strong>Color</strong>. John Wiley <strong>and</strong> Sons, 1989.[Jon81] K. S. Jones. In<strong>for</strong>mation <strong>Retrieval</strong> Experiment. Butterworth <strong>and</strong> Co., 1981.[Rus95] J. C. Russ. The <strong>Image</strong> Processing H<strong>and</strong>book. CRC Press, Boca Raton, 1995.[SB91] M. J. Swain <strong>and</strong> D. H. Ballard. <strong>Color</strong> indexing. International Journal of Computer Vision, 7:1 1991.[SC95] J. R. Smith <strong>and</strong> S.-F. Chang. Single color extraction <strong>and</strong> image query. InI.E.E.E. International Conference on <strong>Image</strong> Processing,October 1995.[WS82] G. Wyszecki <strong>and</strong> W. S. Stiles. <strong>Color</strong> Science: Concepts <strong>and</strong> Methods. John Wiley <strong>and</strong> Sons, 1982.


