Translation Exposure and Firm Value, Evidence From Australian ...
Translation Exposure and Firm Value, Evidence From Australian ...
Translation Exposure and Firm Value, Evidence From Australian ...

Create successful ePaper yourself
Turn your PDF publications into a flip-book with our unique Google optimized e-Paper software.
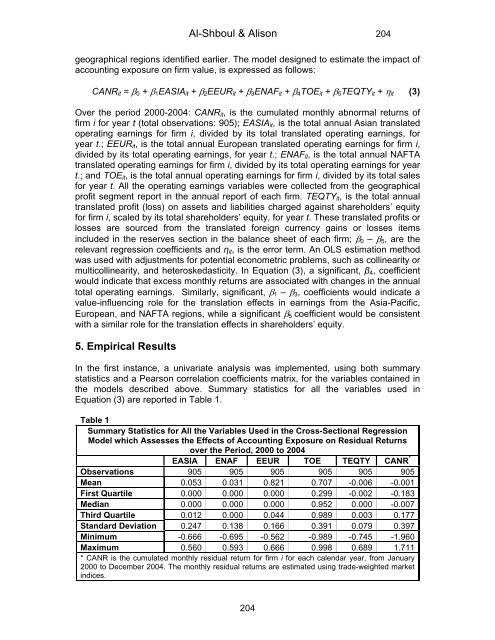
Al-Shboul & Alison 204geographical regions identified earlier. The model designed to estimate the impact ofaccounting exposure on firm value, is expressed as follows:CANR it = β 0 + β 1 EASIA it + β 2 EEUR it + β 3 ENAF it + β 4 TOE it + β 5 TEQTY it + η it (3)Over the period 2000-2004: CANR it , is the cumulated monthly abnormal returns offirm i for year t (total observations: 905); EASIA it , is the total annual Asian translatedoperating earnings for firm i, divided by its total translated operating earnings, foryear t.; EEUR it , is the total annual European translated operating earnings for firm i,divided by its total operating earnings, for year t.; ENAF it , is the total annual NAFTAtranslated operating earnings for firm i, divided by its total operating earnings for yeart.; <strong>and</strong> TOE it , is the total annual operating earnings for firm i, divided by its total salesfor year t. All the operating earnings variables were collected from the geographicalprofit segment report in the annual report of each firm. TEQTY it , is the total annualtranslated profit (loss) on assets <strong>and</strong> liabilities charged against shareholders’ equityfor firm i, scaled by its total shareholders’ equity, for year t. These translated profits orlosses are sourced from the translated foreign currency gains or losses itemsincluded in the reserves section in the balance sheet of each firm; β 0 – β 5 , are therelevant regression coefficients <strong>and</strong> η it , is the error term. An OLS estimation methodwas used with adjustments for potential econometric problems, such as collinearity ormulticollinearity, <strong>and</strong> heteroskedasticity. In Equation (3), a significant, β 4 , coefficientwould indicate that excess monthly returns are associated with changes in the annualtotal operating earnings. Similarly, significant, β 1 – β 3 , coefficients would indicate avalue-influencing role for the translation effects in earnings from the Asia-Pacific,European, <strong>and</strong> NAFTA regions, while a significant β 5 coefficient would be consistentwith a similar role for the translation effects in shareholders’ equity.5. Empirical ResultsIn the first instance, a univariate analysis was implemented, using both summarystatistics <strong>and</strong> a Pearson correlation coefficients matrix, for the variables contained inthe models described above. Summary statistics for all the variables used inEquation (3) are reported in Table 1.Table 1Summary Statistics for All the Variables Used in the Cross-Sectional RegressionModel which Assesses the Effects of Accounting <strong>Exposure</strong> on Residual Returnsover the Period, 2000 to 2004EASIA ENAF EEUR TOE TEQTY CANR *Observations 905 905 905 905 905 905Mean 0.053 0.031 0.821 0.707 -0.006 -0.001First Quartile 0.000 0.000 0.000 0.299 -0.002 -0.183Median 0.000 0.000 0.000 0.952 0.000 -0.007Third Quartile 0.012 0.000 0.044 0.989 0.003 0.177St<strong>and</strong>ard Deviation 0.247 0.138 0.166 0.391 0.079 0.397Minimum -0.666 -0.695 -0.562 -0.989 -0.745 -1.960Maximum 0.560 0.593 0.666 0.998 0.689 1.711* CANR is the cumulated monthly residual return for firm i for each calendar year, from January2000 to December 2004. The monthly residual returns are estimated using trade-weighted marketindices.204