Constructing experimental indicators for Open Access documents
Constructing experimental indicators for Open Access documents
Constructing experimental indicators for Open Access documents

Create successful ePaper yourself
Turn your PDF publications into a flip-book with our unique Google optimized e-Paper software.
Abstract<br />
<strong>Constructing</strong> <strong>experimental</strong> <strong>indicators</strong> <strong>for</strong> <strong>Open</strong> <strong>Access</strong> <strong>documents</strong><br />
Philipp Mayr<br />
Doctoral candidate at the Institute of Library and In<strong>for</strong>mation Science,<br />
Humboldt-University Berlin, Germany.<br />
E-mail: philippmayr@web.de<br />
http://www.ib.hu-berlin.de/~mayr<br />
The ongoing paradigm change in the scholarly publication system (‘science is turning to e-science’) makes it<br />
necessary to construct alternative evaluation criteria/metrics which appropriately take into account the unique<br />
characteristics of electronic publications and other research output in digital <strong>for</strong>mats. Today, major parts of<br />
scholarly <strong>Open</strong> <strong>Access</strong> (OA) publications and the self-archiving area are not well covered in the traditional<br />
citation and indexing databases. The growing share and importance of freely accessible research output demands<br />
new approaches/metrics <strong>for</strong> measuring and <strong>for</strong> evaluating of these new types of scientific publications. In this<br />
paper we propose a simple quantitative method which establishes <strong>indicators</strong> by measuring the access/download<br />
pattern of OA <strong>documents</strong> and other web entities of a single web server. The <strong>experimental</strong> <strong>indicators</strong> (search<br />
engine, backlink and direct access indicator) are constructed based on standard local web usage data. This new<br />
type of web-based indicator is developed to model the specific demand <strong>for</strong> better study/evaluation of the<br />
accessibility, visibility and interlinking of open accessible <strong>documents</strong>. We conclude that e-science will need new<br />
stable e-<strong>indicators</strong>.<br />
1. Introduction<br />
Web data driven studies are a relatively new, interdisciplinary and demanding research field<br />
in the in<strong>for</strong>mation science sector. The impetus <strong>for</strong> this mostly empirical oriented research<br />
comes from the rampant increase in users, <strong>documents</strong> and scholarly research output on the<br />
Web. In these studies there are two types of essential data: Web link data, well-explored by<br />
Mike Thelwall (Thelwall, 2004) and other researchers; and the relatively under-valued web<br />
usage data, which we have been studying.<br />
Web log files (web usage data) record user transactions on web servers and other openly<br />
accessible document repositories and provide an excellent source <strong>for</strong> in<strong>for</strong>mation behavior<br />
analysis due to their properties and amount of data (Nicholas et al., 2005a; 2005b). In addition<br />
to this well-known analysis path, usage data offer the possibility to draw conclusions<br />
concerning accessibility and visibility including interlinking of various types of <strong>documents</strong>.<br />
Recent in<strong>for</strong>metric studies demonstrate the potential to build <strong>indicators</strong> on this kind of data<br />
(Brody & Harnad, 2005; Bollen et al., 2005).<br />
Our approach is also based on web usage data. This approach could be relevant <strong>for</strong> the field of<br />
research evaluation because in the electronic age of publishing science, policy makers and<br />
reviewers, as well as others who use these results, need proper instruments. There is a need to<br />
construct new metrics which are comparable or compatible to citation impact. Perhaps<br />
measuring usage impact or new metrics of user preference can be a supplement <strong>for</strong> citation<br />
impact.<br />
“Is it possible to identify the importance of an article earlier in the read-cite cycle, at the point<br />
when authors are accessing the literature? Now that researchers access and read articles<br />
1
through the Web, every download of an article can be logged. The number of downloads of an<br />
article is an indicator of its usage impact, which can be measured much earlier in the readingciting<br />
cycle.” (Brody & Harnad, 2005)<br />
At a first step, the paper introduces to the field of <strong>Open</strong> <strong>Access</strong> (OA) and webometrics,<br />
including web-based <strong>indicators</strong>. Secondly we propose three <strong>experimental</strong> web <strong>indicators</strong> and<br />
shortly describe their construction. The paper ends with a discussion and a conclusion of the<br />
relevance and specific value of the proposed <strong>indicators</strong> <strong>for</strong> research evaluation.<br />
2. <strong>Open</strong> <strong>Access</strong> and Web <strong>indicators</strong><br />
According to advocates of OA and recent political declarations (e.g. Berlin declaration, 2003),<br />
the share and impact of OA journals as well as the self-archiving area (Lawrence, 2001) will<br />
extensively increase in coming years. In fact, this OA sector is still underrepresented and not<br />
well covered by the major indexing services (e.g. McVeigh, 2004). The consequence is a lack<br />
of established instruments to measure or evaluate the OA published and archived research<br />
output. All stakeholders involved in the scientific process (scientists, peers, journal editors,<br />
librarians, etc.) have indicated that robust web data based measuring methods and <strong>indicators</strong> 1 ,<br />
e.g. <strong>for</strong> determining the impact or quality of a document, are still lacking. There are presently<br />
no sustainable and simple standard <strong>indicators</strong> in sight. Only <strong>experimental</strong> approaches have<br />
been proposed (web link <strong>indicators</strong> included).<br />
<strong>Open</strong> <strong>Access</strong> repositories like CiteSeer, ArXiv and others are especially suited <strong>for</strong> developing<br />
web based <strong>indicators</strong> because they are defined by their scope and offer a certain degree of<br />
import control and content quality. The growing share and importance of freely accessible<br />
research <strong>documents</strong> in the scholarly communication demands robust web-based <strong>indicators</strong><br />
now. Otherwise evaluation of these new publication types is not feasible.<br />
The WISER project defines a web indicator as “a policy relevant measure that quantifies<br />
aspects of the creation, dissemination and application of science and technology in so far as<br />
they are represented on the internet or the World Wide Web.” (see WISER project web site<br />
http://www.wiserweb.org, 2005).<br />
Current web <strong>indicators</strong> are not without systematic problems. Webometric research can show,<br />
<strong>for</strong> example, that analyses based on commercial search engine results such as Google APIs<br />
have some limitations (Mayr & Tosques, 2005) 2 . Additionally, data from different search<br />
engines is not easily compared and interpreted (Bar-Ilan, 1998/9; 2005). Link analysis,<br />
intensively investigated by Mike Thelwall (Thelwall 2004), including co-link analysis (Katz,<br />
2004), is one leading direction <strong>for</strong> future web <strong>indicators</strong>.<br />
There is perhaps another direction <strong>for</strong> constructing reliable and comprehensive web-based<br />
<strong>indicators</strong>. The importance of web usage data is also becoming more accepted in the<br />
in<strong>for</strong>metric community. Recent papers in a special issue on in<strong>for</strong>metrics in In<strong>for</strong>mation<br />
Processing & Management (vol. 41(6), 2005) and a workshop at Humboldt University in<br />
Berlin 3 show various new uses of this data, e.g. alternative metrics of journal impact (Bollen<br />
et al., 2005) or deep log analysis of digital journals (Nicholas et al., 2005b). Modeling web<br />
1<br />
Definition by Mike Thelwall: “Statistics about university web sites are, there<strong>for</strong>e, process <strong>indicators</strong><br />
(Scharnhorst, 2004). These can be used to provide in<strong>for</strong>mation to aid policy makers and managers to ensure that<br />
web sites are being used effectively as part of the processes of education and research.” (Thelwall, 2004, p:228).<br />
2<br />
Limitations and differences in search engine APIs data (Google APIs and Yahoo! APIs) can be tested with<br />
some live demos, available at: http://bsd119.ib.hu-berlin.de/~ft/index_e.html.<br />
3<br />
See http://www.dini.de/veranstaltung/workshop/oaimpact/programm.php <strong>for</strong> the workshop programme and<br />
presentations.<br />
2
usage data <strong>for</strong> evaluation purposes is quite new (Brody & Harnad, 2005; Kurtz et al., 2005;<br />
Bollen et al., 2005) and requires the appropriate environment (e.g. e-print archives like<br />
arxiv.org). Preliminary results from this research show a positive correlation between usage<br />
data and citation data.<br />
The following chapter will deal with three <strong>experimental</strong> <strong>indicators</strong> constructed out of standard<br />
web usage log data.<br />
3. Experimental usage <strong>indicators</strong><br />
Conventional analysis of usage data focuses on aggregates of use from a macro perspective.<br />
Their common per<strong>for</strong>mance figures of hit, view and visit are broadly accepted, but they give<br />
only a very crude and incomplete picture of the underlying access pattern, such as:<br />
• How much traffic does an entity (site, directory, page) of a web space receive (see Fig.<br />
1)?<br />
• Where are the most important entry pages?<br />
• Where are the users coming from?<br />
• How do users return?<br />
The limitations and advantages of web usage data analysis has recently been reviewed by<br />
Jamali et al (2005, see also Nicholas et al., 1999).<br />
We can summarize that log files of web servers or OA repositories normally are:<br />
• structured enough to reliable extract pattern and instances of usage,<br />
• can be used <strong>for</strong> measuring web impact or usage impact (Brody & Harnad, 2005) of a<br />
certain entity,<br />
• have the potential <strong>for</strong> fast indication of usage trends, including user interest and<br />
preference.<br />
Below we will propose a simple quantitative method which establishes <strong>indicators</strong> by<br />
measuring the access pattern of selected OA <strong>documents</strong> and other web entities of a web server<br />
(see Fig. 1 <strong>for</strong> an illustration of the distinguishable entities). The procedure was developed in<br />
2004 and tested by an open accessible academic web site (Mayr, 2004a; 2004b). We will call<br />
the measure Web Entry measure.<br />
3
Figure 1: Different web entities (site, directory and page) in an open accessible web space.<br />
The main idea of the approach is to distinguish the access or entry pattern of a document or<br />
entity via a simple heuristic. The Web Entry measure uses a heuristic that distinguishes three<br />
access/download types “search engines,” “backlinks” and “direct access” (see Fig. 2) <strong>for</strong><br />
measuring the accessibility, interlinking and visibility ratios <strong>for</strong> certain <strong>documents</strong>. These<br />
access or entry types can be reliably identified in a log file (see also Thelwall, 2001; Mayr,<br />
2004a; see Fig. 2). The usage data in the extended log file <strong>for</strong>mat allows a separation of<br />
access requests into (see log file examples in Fig. 2):<br />
1. Backlink access: the usage of a hyperlink (backlink <strong>for</strong> the requested item) in<br />
another external paper or web document is documented in the usage data with<br />
the complete URL of the referencing document.<br />
2. Search engine access: a search engine query e.g. the title or the author of a<br />
paper, leads directly to the paper in the repository and will be logged as an<br />
access via search engine. Search engine access can be tracked by typical search<br />
engine urls in the referer log file field.<br />
3. Direct access: direct access can be established through user’s bookmarks or<br />
other <strong>for</strong>ms of directly requesting a document. Direct access can be tracked by<br />
the missing entry/url (e.g. “-“) in the referer log file field.<br />
Figure 2: A log file sample showing the proposed access types search engine, backlink and direct access which<br />
can be differentiated by a heuristic.<br />
4
Figure 2 shows anonymous virtual users requesting different pages (bold). The users access<br />
the pages via the three proposed entry types (typical search engine, backlink and direct access<br />
pattern are marked).<br />
The Web Entry measure proposed by the author can be implemented 4 in a freely accessible<br />
environment of <strong>Open</strong> <strong>Access</strong> <strong>documents</strong>. The differentiation of the entry requests allow<br />
measuring of, <strong>for</strong> example, the intensity and broadness of external interlinking or visibility via<br />
search services. This has been successfully applied in a study analyzing the content of a large<br />
academic website in Germany (Mayr, 2004a; 2004b).<br />
Furthermore, the Web Entry measure has the potential <strong>for</strong> building fast applicable <strong>indicators</strong><br />
using these aggregates of usage which may be a basis <strong>for</strong> various optimization or evaluation<br />
processes of a certain OA entity. Detailed usage impact and interest rates can be indicated<br />
shortly after electronic publication by the following ratios:<br />
• Web entity visibility or accessibility rates <strong>for</strong> different navigation and document<br />
access pattern,<br />
• Web entity interlinking rates give a global idea about the accessibility of an open<br />
accessible item by external linking/backlinking or electronic scholarly citing.<br />
The three entry patterns (exemplified by Fig. 2) can be extracted <strong>for</strong> entities, <strong>for</strong> example<br />
journals, journal volumes/issues or articles/abstracts etc, identifiable in the usage data. The<br />
following simple pure web-based <strong>indicators</strong> can be automatically computed and used <strong>for</strong><br />
further calculations (e.g. validations).<br />
1. Search engine Indicator Ise:<br />
Downloads by search engine access (Dse)<br />
Ise<br />
=<br />
Downloads total (Dtotal)<br />
2. Backlink Indicator Ibl:<br />
Ibl<br />
=<br />
Downloads by backlink access (Dbl)<br />
Downloads total (Dtotal)<br />
3. Direct access Indicator Ida:<br />
Ida<br />
=<br />
Downloads by direct access (Dda)<br />
Downloads total (Dtotal)<br />
The entity in Table 1, a single web page (article.htm in the folder irs), is downloaded 10.000<br />
times in a certain period of time. The proposed analysis method subdivides these total<br />
downloads into 2.000 downloads via search engines (Ise= 0.2), 7.000 downloads via backlinks<br />
(Ibl= 0.7) and 1.000 downloads via direct access (Ida= 0.1). The single indicator values Ise, Ibl,<br />
Ida can vary between 0 and 1. Each indicator can be drilled down to a more detailed level (see<br />
2-step scenario below).<br />
4<br />
The prototype Web Entry Miner (WEM) and sample log data are available at http://www.ib.huberlin.de/~mayr/wem/.<br />
5
Table 1: An example <strong>for</strong> segmented download ratios and derived <strong>indicators</strong> Ise, Ibl, Ida <strong>for</strong> an entity.<br />
Entity URL Dse (Ise) Dbl (Ibl) Dda (Ida) Dtotal<br />
Page /irs/article.htm 2.000 (0.2) 7.000 (0.70) 1.000 (0.10) 10.000<br />
Figure 3 shows a prototypical visualization of usage data via the proposed measure. The<br />
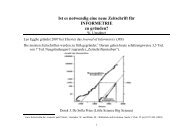
values of the selected page indicate a high search engine ratio (Ise of 0.75).<br />
Figure 3: A visualization of a web entity (page) via the Java tool Web Entry Miner.<br />
A next analysis step after the indicator computation (Tab. 1 or Fig. 3) could be the following<br />
2-step scenario:<br />
• Step 1: First the usage data will be analyzed with the proposed method. As a result we<br />
have a detailed macro view which distinguishes and displays the three usage<br />
aggregates, search engines, backlinks and direct access <strong>for</strong> each entity in a repository<br />
represented by their indicator values Ise, Ibl, Ida.<br />
• Step 2: In the second step, the data analyst wishes to study the precise composition of<br />
the indicator values <strong>for</strong> a favorite entity, <strong>for</strong> example by its search engine indicator Ise.<br />
In doing so, this starts a “drill down” to the data (the downloads via search engines Dse<br />
<strong>for</strong> the entity) which can display the exact configuration of the search engine<br />
accesses/downloads recorded in the log file. For example, 75% of search engine<br />
downloads refer back to the selected page in Figure 3 and these entries probably go<br />
back to several search engines and various search terms. The drill down analysis of the<br />
indicator can show all details, the search engines with the single search engine entry of<br />
the website referenced. In a further drill down step the search terms of an actual search<br />
engine, <strong>for</strong> example Google, will be shown. This is the point where the advanced<br />
macro analysis would end and a micro analysis could begin (see a micro-mining<br />
methodology in Nicholas & Huntington, 2003).<br />
A drill-down scenario can also start with the backlink indicator Ibl. An analyst could be<br />
interested in the used backlinks/electronic citations of an analyzed document or entity. The<br />
distribution of backlinks can typically be viewed over time or by the intensity of the backlink<br />
use.<br />
6
The following chapter will discuss the policy relevance and methodological difficulties of the<br />
proposed method. Furthermore we address the specific value and meaning of each indicator<br />
<strong>for</strong> evaluation of open accessible research <strong>documents</strong>.<br />
4. Discussion<br />
In accordance with the title of the paper, the proposed method to construct <strong>indicators</strong> <strong>for</strong><br />
science and innovation systems out of usage data is highly <strong>experimental</strong>. But this<br />
<strong>experimental</strong> status is not only a specific property of our <strong>indicators</strong>, rather the status quo of<br />
most web-based <strong>indicators</strong> in these days is far from robust, including <strong>indicators</strong> which are<br />
build on linking data. Tendencies to develop these ‘early’ approaches to larger prototyping<br />
projects 5 can be observed. Usage data based methods (including our approach) have now little<br />
policy relevance <strong>for</strong> evaluators, because of some reasons. First there is the availability and<br />
privacy issues of the data. Normally raw or filtered usage data files are not available <strong>for</strong><br />
everybody who is interested in the usage of a webserver or document repository. Especially<br />
the projects mentioned above (see footnote 5) show ideas/solutions how to overcome this<br />
problem. Secondly, the described method in this paper relies on the analysis of local log data,<br />
mostly only from one single webserver. Local log data is a limited data source in terms of<br />
measuring/evaluating science output and there<strong>for</strong>e it has only a little relevance <strong>for</strong> evaluators.<br />
A federated approach which has its own specific obstacles is a very promising direction with a<br />
higher impact <strong>for</strong> comprehensive science metrics. Evaluations of groups, institutes etc. would<br />
be better based on a federated approach. But we like to underline that our idea (distinguishing<br />
download pattern by a specific heuristic) has the potential to draw a more detailed picture of<br />
the usage statistics by establishing fine-grained <strong>indicators</strong>. Possibly this can be an add-on <strong>for</strong><br />
enhanced evaluation of total counts of downloads. The third reason is the enormous amount of<br />
data and the problems in securing data quality/validity. Particularly the data quality and the<br />
validity of the constructed <strong>indicators</strong> should be mentioned here. Usage data with its absolutely<br />
urgency in filtering, extracting and validating of the raw data, could be relatively easily be<br />
manipulated, compared to citation or linking data. Log data analysis techniques are<br />
contentious, vague and full of traps (see e.g. Nicholas et al., 1999). Proxy server caching, user<br />
identification issues and other complicated problems like evaluating <strong>documents</strong> on distributed<br />
or mirrored systems by merging and sampling usage data are only some examples of<br />
problems you have to cope with, if you like to standardize such an evaluation method. All<br />
these reasons let us summarize that metrics which are based on usage data need an even better<br />
testing and circumspection be<strong>for</strong>e using it <strong>for</strong> evaluation or other interpretations. Furthermore<br />
this kind of metrics tend to be more successful in indicating/monitoring research output <strong>for</strong><br />
user purposes. Users can better decide which publications are preferred by other users if<br />
downloads ratios are displayed. In accepting this shift from author/citation-centered to<br />
user/download-centered methodology, we have also a new and fast applicable basis <strong>for</strong><br />
ranking and ordering search results or monitoring science trends with an increase in data<br />
vagueness.<br />
The specific value and meaning of our approach lies in the detailed display of the total<br />
downloads of each single OA document or entities of items and the opportunity to dig deeper.<br />
The proposed <strong>indicators</strong> Ise, Ibl, Ida open a microscopic way to analyze aggregates/instances of<br />
usage. They offer e.g. the possibility to discover hidden linking structures and usage pattern of<br />
groups. Ise, the search engine indicator, is a first indication <strong>for</strong> a collection manager if any<br />
open accessible document is indexed and retrieved from outside of the repository. A more<br />
5 Projects to build <strong>indicators</strong>/metrics out of usage data: e.g. the bX project of the Los Alamos National<br />
Laboratory and Ex Libris or the Interoperable Repository Statistics (IRS) project by University of Southampton<br />
(http://irs.eprints.org/) presented recently (see footnote 3).<br />
7
detailed analysis of Ise offer the possibility to learn more about the accessibility of items (see<br />
2-step scenario in chapter 3). Ibl, the backlink indicator, is an immediate indication of impact<br />
of a document, because preference expressed by hyperlinks/’e-citations’ and the usage of<br />
these links can be measured. Furthermore this indicator can show more than the absolute<br />
count of backlinks, but also the distribution of backlink usage over time. The Ibl is conceptual<br />
related to traditional citation based <strong>indicators</strong>, because of the relatedness between citing and<br />
scholarly hyperlinking. It holds the greatest potential to build own/free <strong>for</strong>ms of aggregation<br />
or validation with traditional metrics <strong>for</strong> evaluation purposes. Ida, the direct access indicator, is<br />
a specialty of our metric. It can indicate to which rate a document is downloaded directly.<br />
5. Conclusions<br />
As we can show, logging data and derived web-based <strong>indicators</strong> of open accessible scholarly<br />
web spaces, is a very interesting source and also monitors real usage by real readers/users, in<br />
almost real time. Implementing widespread usage analysis and usage based <strong>indicators</strong> in OA<br />
repositories demonstrates benefits such as fast indication of usage impact and user preference.<br />
Today we are at a level where we should consider supplementing or enhancing traditional<br />
evaluation with new <strong>for</strong>ms of web data. Web <strong>indicators</strong> based on usage data are a way to<br />
obtain unique in<strong>for</strong>mation of the utility and scholarly acceptance of OA research output, but<br />
these new user oriented web <strong>indicators</strong> are still in an early <strong>experimental</strong> phase. The rationale<br />
of these approaches is strong but standardization of web metrics is at the beginning. In<br />
agreement with Thelwall’s opinion that “providing in<strong>for</strong>mation that may be used to take<br />
corrective action in research policy” (2004, p. 233) is an ambitious goal <strong>for</strong> our web-based<br />
<strong>indicators</strong>, research shows this to be a worthy goal, but there is still much to be done in<br />
evaluation of OA research. In addition we need further approaches to build robust measures<br />
and metrics especially <strong>for</strong> OA publications/<strong>documents</strong>. Following the thesis “science is<br />
turning to e-science” (Kretschmer & Aguillo, 2005; WISER website) we conclude e-science<br />
will need new stable e-<strong>indicators</strong> or a combination with traditional <strong>indicators</strong> to appropriately<br />
take e-only research output into consideration.<br />
Acknowledgement<br />
I would like to thank Jeof Spiro <strong>for</strong> helpful questions and proof reading of the manuscript.<br />
References<br />
Bar-Ilan, Judit 1998/9. Search Engine Results over Time – A Case Study on Search Engine Stability.<br />
Cybermetrics, 2/3. Retrieved January 15, 2006 from<br />
.<br />
Bar-Ilan, Judit 2005. Comparing ranking of search results on the Web. In<strong>for</strong>mation Processing &<br />
Management, 41(6), 1511-1519.<br />
Bollen, Johan; van de Sompel, Herbert; Smith, J.A.; Luce, Rick 2005. Towards alternative metrics of<br />
journal impact: A comparison of download and citation data. In<strong>for</strong>mation Processing & Management,<br />
41(6), 1419-1440.<br />
Brody, Tim and Harnad, Stevan 2005. Earlier Web Usage Statistics as Predictors of Later Citation<br />
Impact. Technical report. Retrieved January 15, 2006 from .<br />
8
Jamali, R. Hamid; Nicholas, David; Huntington, Paul 2005. The use and users of scholarly e-journals:<br />
a review of log analysis studies. Aslib Proceedings, 57( 6), 554-571.<br />
Katz, J. Sylvan 2004. Co-Link Web Indicators of the European Research Area. Technical report.<br />
Retrieved January 15, 2006 from .<br />
Kretschmer, Hildrun and Aguillo, Isidro 2005. New <strong>indicators</strong> <strong>for</strong> gender studies in Web networks.<br />
In<strong>for</strong>mation Processing & Management, 41(6), 1481-1494.<br />
Kurtz, J. Michael; Eichhorn, Guenther; Accomazzi, Alberto; Grant, Carolyn; Demleitner, Markus;<br />
Henneken, Edwin; Murray, Stephen S. 2005. The effect of use and access on citations. In<strong>for</strong>mation<br />
Processing & Management, 41(6), 1395-1402.<br />
Lawrence, Steve 2001. Online or Invisible? Nature, 411(6837). Retrieved January 15, 2006 from<br />
.<br />
Mayr, Philipp 2004a. Entwicklung und Test einer logfilebasierten Metrik zur Analyse von Website<br />
Entries am Beispiel einer akademischen Universitäts-Website. Berliner Handreichungen zur<br />
Bibliothekswissenschaft und Bibliothekarsausbildung, 129. Published Master’s thesis. Retrieved<br />
January 15, 2006 from .<br />
Mayr, Philipp 2004b. Website entries from a web log file perspective - a new log file measure.<br />
Proceedings of the AoIR-ASIST 2004, Workshop on Web Science Research Methods. Retrieved<br />
January 15, 2006 from .<br />
Mayr, Philipp and Tosques, Fabio 2005. Google Web APIs – an Instrument <strong>for</strong> Webometric Analyses?<br />
In P. Ingwersen and B. Larsen (Ed.), Proceedings of ISSI 2005, 677-678. Stockholm: Retrieved<br />
January 15, 2006 from .<br />
McVeigh, E. Marie 2004. <strong>Open</strong> <strong>Access</strong> Journals in the ISI Citation Databases: Analysis of Impact<br />
Factors and Citation Patterns. A citation study from Thomson Scientific. Retrieved January 15, 2006<br />
from .<br />
Nicholas, David; Huntington, Paul; Lievesley, Nat; Withey, Richard 1999. Cracking the code: web log<br />
analysis. Online & CD-ROM Review, 23, 263-269.<br />
Nicholas, David; Huntington, Paul; Dobrowolski, Tom; Rolands, Ian; Jamali, R. Hamid; Polydoratou,<br />
Panayiota 2005a. Revisiting ‘obsolescence’ and journal article ‘decay’ through usage data: an analysis<br />
of digital journal use by year of publication. In<strong>for</strong>mation Processing & Management, 41(6), 1441-<br />
1461.<br />
Nicholas, David; Huntington, Paul; Watkinson, Antony 2005b. Scholarly journal usage: the results of<br />
deep log analysis. Journal of Documentation, 61(2), 248-280.<br />
Nicholas, David; Huntington, Paul 2003. Micro-Mining and Segmented Log File Analysis: A Method<br />
<strong>for</strong> Enriching the Data Yield from Internet Log Files. Journal of In<strong>for</strong>mation Science, 29(5), 391-404.<br />
Thelwall, Mike 2001. Web log file analysis: Backlinks and Queries. Aslib Proceedings, 53, 217-223.<br />
Thelwall, Mike 2004. Link Analysis: An In<strong>for</strong>mation Science Approach. Amsterdam: Elsevier.<br />
9