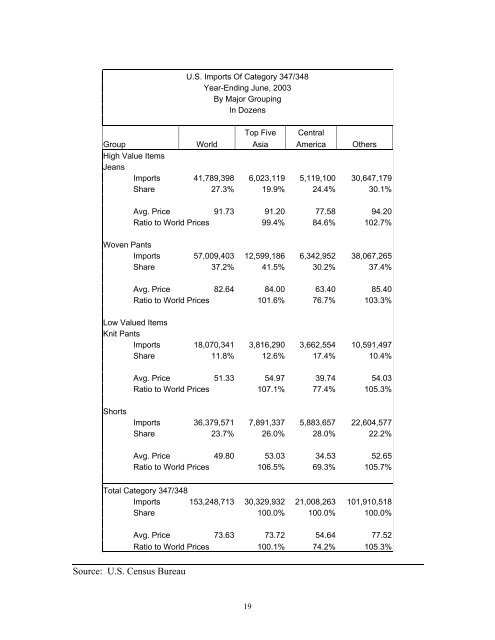
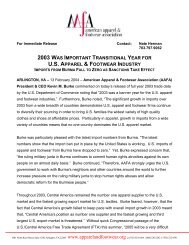
U.S. Imports Of Category 347/348Year-Ending June, 2003By Major GroupingIn DozensTop Five <strong>Central</strong>Group World Asia America OthersHigh Value ItemsJeansImports 41,789,398 6,023,119 5,119,100 30,647,179Share 27.3% 19.9% 24.4% 30.1%Avg. Price 91.73 91.20 77.58 94.20Ratio to World Prices 99.4% 84.6% 102.7%Woven PantsImports 57,009,403 12,599,186 6,342,952 38,067,265Share 37.2% 41.5% 30.2% 37.4%Avg. Price 82.64 84.00 63.40 85.40Ratio to World Prices 101.6% 76.7% 103.3%Low Valued ItemsKnit PantsImports 18,070,341 3,816,290 3,662,554 10,591,497Share 11.8% 12.6% 17.4% 10.4%Avg. Price 51.33 54.97 39.74 54.03Ratio to World Prices 107.1% 77.4% 105.3%ShortsImports 36,379,571 7,891,337 5,883,657 22,604,577Share 23.7% 26.0% 28.0% 22.2%Avg. Price 49.80 53.03 34.53 52.65Ratio to World Prices 106.5% 69.3% 105.7%Total Category 347/348Imports 153,248,713 30,329,932 21,008,263 101,910,518Share 100.0% 100.0% 100.0%Avg. Price 73.63 73.72 54.64 77.52Ratio to World Prices 100.1% 74.2% 105.3%Source: U.S. Census Bureau19
As shown, <strong>Central</strong> <strong>American</strong> suppliers have a lower percentage of their trade inthe higher valued items, jeans and woven trousers, when compared with the top 5 Asianquota suppliers and all other trading partners. <strong>Central</strong> <strong>American</strong> trade is moreconcentrated in the lower valued items, knit pants and shorts. Further, prices for <strong>Central</strong><strong>American</strong> merchandise are consistently less than prices for the top five Asian quotasuppliers as well as all other suppliers. <strong>The</strong> price differences are significant: anywherefrom an average of 15.4 percent less for jeans to 30.7 percent less for shorts. For allCategory 347/348 trade, <strong>Central</strong> <strong>American</strong> exports had average unit prices of $54.64 perdozen. This is 25.8 percent less than the average prices for all suppliers.<strong>The</strong>se price comparisons are based on FOB terms, prior to duty preference. Whenduties are added, in jeans for example, <strong>Central</strong> <strong>American</strong> prices, without duty, are 72.5percent of world average for comparable merchandise with full duty.A number of quota-related events impacted the changes in trade levels since 2000.Imports from Vietnam increased from nearly zero during 2000 to 11.3 million dozenduring the year-ending June 2003. Thus, Vietnam accounted for 44.3 percent of thegrowth in imports during this period. Vietnam was not previously subject to quota.Beginning in May 2003, Vietnam’s trade was limited to seven million dozen on anannual basis, meaning Vietnam’s trade will decline sharply at least through the end of2004.During 2002, Bangladesh massively over shipped its Category 347/348 limit andborrowed from its 2003 limit in order to avoid an embargo. This borrowing is being paidback at a rate of 3:1, effectively causing a large cut in Bangladesh’s 2003 access to theU.S. market this year, despite annual quota growth of nearly 13 percent.Hong Kong’s trade in Category 347/348 declined 3.8 percent between 2000 andthe year-ending June 2003. Annual quota growth for Hong Kong, even after growthacceleration under the WTO, is less than one percent. Since Hong Kong regularly fills itsCategory 347/348 limit, it cannot participate in any growth in this product until quotasare removed in 2005.<strong>The</strong> top five quota suppliers have experienced extremely heavy quota utilizationin recent years. Two of those countries, Turkey and Bangladesh, have fully utilized theirlimits each of the past three years. <strong>The</strong> average utilization for these five suppliers duringthe past three years has been an amazing 98.8 percent, indicating significant pent updemand for Category 347/348 merchandise from these countries.Despite the apparent difficulties inherent with importing cotton pants and shortsfrom Asian quota suppliers, these countries increased their market shares, in a growingU.S. market. <strong>The</strong> top five Asian suppliers subject to quota since 2000 increased theircombined share of imports from 16.5 percent during 2000 to 17.0 percent during theyear-ending June 2003. This growth occurred despite the fact that their combined20