The Central American Textile And Apparel Industry
The Central American Textile And Apparel Industry
The Central American Textile And Apparel Industry

Create successful ePaper yourself
Turn your PDF publications into a flip-book with our unique Google optimized e-Paper software.
market. This can be illustrated two ways. First, Asian prices are consistently higher on aproduct-by-product basis than those of <strong>Central</strong> <strong>American</strong> countries. Normally, higherprices would indicate less efficiency. But imports from Asian suppliers are growingwhile the market share of <strong>Central</strong> <strong>American</strong> suppliers is declining or stagnant. Thus, thehigher prices are an indication of higher-end products. Second, when quotas wereremoved from certain products during the third stage of integration in 2002, prices fromAsian suppliers declined by amounts far greater than the quota premiums that were inplace. This is not an indication of sudden price gouging or dumping. Instead, it is proofthat Asia’s trade became free to migrate “down-market” into lower valued items. SinceAsian countries held the highest price segments of each of these markets, any growth intrade it could achieve was in lower-valued goods. This led to an apparent sharp drop inprices, as reported in trade statistics.<strong>Central</strong> America Needs A Commercially Meaningful U.S./<strong>Central</strong> America FreeTrade Agreement (FTA)To Survive <strong>And</strong> Thrive Post 2004<strong>The</strong> textile and apparel industry in <strong>Central</strong> America is not well suited tocompete in the market after 2004, even with the benefits provided under theCBTPA. It clearly needs to make dramatic changes if it can be expected to compete withlarger, diversified and flexible suppliers in other countries and to survive over the longterm. <strong>The</strong> implementation of an FTA could be of significant benefit to the industry. Butthis benefit will only materialize if the FTA is structured to meet the needs of the regionalindustry. As witnessed with the CBTPA program, preferences granted to existingoperations do not necessarily result in growth in trade. <strong>The</strong> program was successful inmoving the cutting operation to the region, promoting the textile sector through thelimited use of regionally knit fabrics, and allowing modest growth in “full package”operations 11 through the use of short supply fabrics sourced from outside of the region.<strong>The</strong>se successes, however, were not enough, as CBI countries’ share of the U.S. apparelimport market has declined since implementation of the CBTPA. <strong>The</strong> countries of theregion require additional and commercially meaningful benefits if they are to remaincompetitive – not just under present conditions, but, more importantly, when quotas areremoved in 2005 and Asian suppliers become even more efficient.When the evolution of the <strong>Central</strong> <strong>American</strong> textile and apparel industry is takenin an historical perspective, 2005 will be a watershed event, as it will be for nearly everycountry involved in the textile and apparel sector. In this context, the <strong>Central</strong> <strong>American</strong>industry should have been preparing for this event for years. As such, the evolution ofpreferences now being considered for <strong>Central</strong> America, are basically several years late.Nonetheless, the importance and urgency for additional competitive benefits for thisregion’s industry cannot be overstated. <strong>The</strong> textile and apparel industries of theUnited States and <strong>Central</strong> America would be well served if an agreement were11 Under “full package” operations, offshore contractors are responsible for more elements of theproduction chain. Instead of assembling and exporting “cut parts” that are shipped by a U.S. customer, fullpackage operators work directly with fabric and other input suppliers to produce a finished product readyfor sale to the ultimate customer.6
concluded and implemented quickly and that agreement contained flexibletreatment for textile and apparel trade.<strong>The</strong> U.S./<strong>Central</strong> America FTA negotiations are entering the final phase and thedetails of the textile and apparel provisions are not settled. Thus, the potential benefits ofan FTA for the <strong>Central</strong> <strong>American</strong> textile and apparel industry cannot yet be measured.<strong>The</strong>re are a number of issues that are being discussed that would result in a flexibleagreement that will allow the <strong>Central</strong> <strong>American</strong> industry to flourish and remain viable.<strong>The</strong>se are described below.Yarn-forward essential character origin rule: As shown with the provisionsunder CBTPA for regionally knit fabrics, the allowance of <strong>Central</strong> <strong>American</strong> inputs wassubstantially used and was a success in policy terms. Further, it aided in somediversification of the regional industry. <strong>The</strong> proposed yarn-forward essential characterrule would allow unlimited use of U.S. or regional yarns and U.S. and regionally formedfabrics whether knit or woven. This is an improvement over the current preferenceprogram. However, when compared with the textile and apparel origin rules under otherFTAs, including U.S. agreements with Israel and Jordan as well as those of the EuropeanUnion, this rule is extremely limiting. Furthermore, the current version of the yarnforwardessential character origin rule by itself would not provide much incentivefor the full scope of diversification needed by the <strong>Central</strong> <strong>American</strong> industry if thatindustry is to survive.Short Supply Provision: This provision would allow for the use of foreign yarnsand fabrics provided the inputs are not widely available in commercial quantities in atimely manner within the United States or the region. Provided the rules for includingproducts on the short supply list are written in a user-friendly fashion, this provision willallow <strong>Central</strong> <strong>American</strong> manufacturers to expand their own sourcing matrix and willfurther allow increased “full package” offerings to their U.S. clients.Cumulation: Under cumulation, inputs from FTA and trade preference partnerswould be allowed under the yarn-forward essential character origin rule. As with theother provisions, this would allow for an improvement over the existing preferenceprogram. Specifically, cumulation would allow more flexibility in piece good sourcing(i.e. yarns and fabrics) for <strong>Central</strong> <strong>American</strong> suppliers, as well as their ability to providefull package services, by permitting the use of inputs from countries like Mexico. U.S.textile companies would directly benefit from such provisions as well since thesecumulated inputs often contain U.S. content or involve U.S. investments abroad.Tariff Preference Levels (TPLs): Other FTAs, including the North <strong>American</strong>Free Trade Agreement (NAFTA), Singapore and Chile, allow limited quantities ofapparel to enter free of duty without complying with the yarn-forward essential characterorigin rule. As noted previously, the primary engine of growth in apparel exports since2000 from CBI countries has been in products that do not receive any preference. Thistrade is significant in that it provides the greatest hope for a diversified and successfultextile and apparel industry in <strong>Central</strong> America over the long term. <strong>The</strong> amounts7
involved, however, are relatively small and cannot, on their own, sustain the entireregion. Further, these operations will become subject to additional competitive forces in2005. This aspect of <strong>Central</strong> <strong>American</strong> trade should be nurtured, so the regional industrycan be competitive both during the immediate crisis – the removal of quotas – and for thelong term. <strong>The</strong> best way to ensure that this “non preference” trade does not migrateafter 2004 is by providing duty preferences for limited, but commerciallymeaningful quantities of apparel regardless of the source of the inputs.Representatives of the U.S. textile industry vehemently oppose the use of TPLs inthe <strong>Central</strong> <strong>American</strong> agreement. <strong>The</strong> basis for their position is the notion that anyprovision that promotes outside production equates to lost business for U.S. textileproducers. In reality, such provisions tend to promote the use of U.S. inputs by extendingduty free benefits to garments made with a mix of U.S. and foreign inputs.<strong>The</strong> <strong>Central</strong> <strong>American</strong> industry cannot survive for long simply relying on theassembly of U.S. inputs. It must act now to evolve further from its one-dimensionalnature into a more diversified and competitive industry. A U.S./<strong>Central</strong> America FTAwithout key flexibilities, including those noted above, would provide onlyincremental benefits to the <strong>Central</strong> <strong>American</strong> industry in terms of promoting itscompetitiveness and its diversity. Moreover, such a restrictive FTA would probablybe “too little, too late” when considered in the context of the competitive forces thatwill be unleashed in a mere 13 months. On the other hand, an FTA with keyflexibilities can promote the diversity that is of paramount importance to the long-termhealth and competitiveness of the <strong>Central</strong> <strong>American</strong> industry. Since U.S. textile makersrely on apparel production in the region, the health and diversity of that production baseis important to U.S. textile makers.U.S. <strong>Textile</strong> Exports Require a Commercially Meaningful FTA to Grow<strong>Central</strong> <strong>American</strong> apparel production is primarily based around the use of tariffpreferences, which require the use of U.S. inputs. <strong>The</strong> various programs that have beenin effect have had some successes, both in terms of stimulating the <strong>Central</strong> <strong>American</strong>assembly industry, but also as a stimulant to certain U.S. exports. <strong>The</strong> amounts involvedare significant. As the table below illustrates, the mix of products that the U.S. industryexports to the region have followed changes in preference programs. For example, underCBTPA, the U.S. cutting requirement was effectively dropped and garments made fromregionally knit fabrics of U.S. yarns were provided new benefits. As a result, the mix ofU.S. exports migrated towards yarns and fabrics and away from cut garment pieces,which are counted as garments in the U.S. trade statistics.8
Failure to do so will place <strong>American</strong> jobs at risk. As shown in Appendix I, $3.0billion in textile and apparel exports directly correlates to approximately 24,000 jobs inthe United States. <strong>The</strong> true potential loss to U.S. workers is far larger. Few workers areemployed solely in the manufacture of articles for export. Further, few mills aremanufacturing solely articles for export. Instead, the exported merchandise constitutes ashare of output. As the customers for this share of output are lost, the enterprise as awhole becomes less profitable. Given the state of the U.S. textile industry, it would nottake much of a reduction in sales to put a typical mill out of business. Thus, as theexport segment of production is lost, entire mills will be closed and the entireworkforce of each of those mills will be lost.On a larger scale, the U.S. textile industry is in dire need of diversification. If aU.S./<strong>Central</strong> America FTA is not enacted in a meaningful manner, the U.S. textileindustry will lose this export market and this loss will be a significant cause in theacceleration of the downward spiral in U.S. textile manufacturing and employment. <strong>The</strong>potential loss of employment in this scenario would be measured in the hundreds ofthousands and a significant loss of capital.10
INDIVIDUAL PRODUCT ANALYSES 12 : CENTRAL AMERICA POST – 2005WITHOUT A MEANINGFUL U.S. – CENTRAL AMERICAN FTAThis study will focus on <strong>Central</strong> <strong>American</strong> trade in four products:• Category 338/339: Cotton knit shirts• Category 340/640: Cotton & manmade fiber woven shirts, men & boys• Category 347/348: Cotton trousers and shorts• Category 352: Cotton underwearAs a group, these products account for $4.6 billion in trade – over half of theregion’s total. <strong>The</strong> <strong>Central</strong> <strong>American</strong> situation with respect to each of these marketsvaries from product to product.Category 338/339: Cotton Knit Shirts<strong>Central</strong> <strong>American</strong> and Caribbean suppliers have long dominated U.S. imports ofcotton knit shirts. U.S. imports of Category 338/339 from the five <strong>Central</strong> <strong>American</strong>countries totaled 98.7 million dozen during the year-ending June 2003. This equates toone-third of Category 338/339 imports from all sources. Three <strong>Central</strong> <strong>American</strong>suppliers, Honduras, El Salvador, and Guatemala, are among the top four suppliers to theU.S. market. Six of the top ten suppliers to the U.S. market are located in the WesternHemisphere.At the same time, imports from other suppliers are tightly controlled by quotas.<strong>The</strong> table below sets out import levels for the top five 13 quota suppliers and <strong>Central</strong><strong>American</strong> countries, as well as average quota fill rates for the past three years.12 This analysis uses the Category system under which different textile and apparel product lines aregrouped together for quota purposes.13 Vietnam was not subject to quota until May 2003. Trade for Vietnam is not included in “Top 5 QuotaSuppliers” in the graph below.11
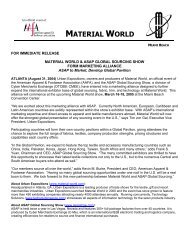
Category 338/339U.S. Imports & Quota Utilization For Top SuppliersPercent AverageU.S. Imports Share QuotaSource 2000 2001 2002 (2002) Utilization 14World 226,928,905 234,259,872 265,157,730<strong>Central</strong> America 70,494,557 76,535,543 86,971,722 32.8% n.a.Mexico 47,357,000 44,944,977 46,561,468 17.6% n.a.Other Top 5Pakistan 9,766,046 9,212,557 9,810,979 3.7% 99.8%Turkey 6,628,830 6,424,684 7,665,484 2.9% 99.0%India 4,523,126 4,743,332 6,277,202 2.4% 100.0%Vietnam 500,375 713,132 6,067,673 2.3% 100.0%Hong Kong 5,082,507 4,725,901 5,799,366 2.2% 98.8%Egypt 2,819,877 2,609,298 3,001,769 1.1% 72.9%Others 80,256,962 85,063,580 99,069,740 37.4%<strong>The</strong> graph below illustrates the recent interaction in market share among <strong>Central</strong>America, Mexico, the top five quota suppliers 15 , and others. In a pattern that will berepeated throughout this analysis in other products, <strong>Central</strong> America is gaining marketshare at the expense of Mexico; quota suppliers’ growth is stymied; and other countriesare gaining share.14 U.S. Department of Homeland Security, Bureau of Customs & Border Protection.15 Vietnam did not become a top 5 supplier, or subject to quota until recently. <strong>The</strong> graph below does notinclude Vietnam as a “Top 5” country.12
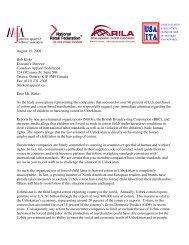
Category 338/339 includes a variety of products. For the purposes of thisanalysis, the grouping is divided between shirts 16 , T-shirts & tank tops, and sweatshirts &other pullovers. Generally speaking, “shirts” contain a higher level of fashion contentand require more complex assembly operations than garments in the other breakouts.Prices for these garments are typically higher and provide for higher value added in theassembly process than is the case for garments in the other two groups. In contrast, tanktops and T-shirts are often the simplest garments and contain little fashion content orcomplexity.As shown in the chart below, Category 338/339 imports from <strong>Central</strong> <strong>American</strong>countries are skewed towards lower valued garments. In addition, prices for <strong>Central</strong><strong>American</strong> goods are lower than those from other sources.16 Garments classified in HTS 6105 & 6106, which includes garments with a full or partial opening, bodycoverage from the neck tot the waist; and typically has sleeves and collar.13
U.S. Imports Of Category 338/339Year-Ending June, 2003By Major GroupingIn Dozens<strong>Central</strong>Group World China America Others6105/6 ShirtsImports 40,741,840 353,911 8,743,980 31,643,949Share of Cat. 338/339 13.8% 12.8% 8.9% 16.3%Avg. Price 53.34 94.75 43.06 55.71Ratio to World Prices 177.6% 80.7% 104.4%T-Shirts & Tank TopsImports 100,120,882 903,904 39,530,308 59,686,670Share of Cat. 338/339 33.9% 32.8% 40.1% 30.7%Avg. Price 23.77 35.87 18.41 27.14Ratio to World Prices 150.9% 77.5% 114.2%Pullovers & OtherImports 154,846,031.0 1,499,903.0 50,411,735.0 102,934,393.0Share of Cat. 338/339 52.4% 54.4% 51.1% 53.0%Avg. Price 39.64 93.85 26.64 45.22Ratio to World Prices 236.8% 67.2% 114.1%Total Category 338/339Imports 295,708,753 2,757,718 98,686,023 194,265,012Avg. Price 36.16 74.96 24.80 41.38Ratio to World Prices 207.3% 68.6% 114.4%Source: U.S. Census BureauWorld trade in Category 338/339 consists of approximately one-half pullovers,one-third T-shirts, and one-sixth shirts. Imports from <strong>Central</strong> America, however, are onefourthpullovers, 40 percent t-shirts and one-tenth shirts. Further, <strong>Central</strong> <strong>American</strong>prices on a product grouping comparison are, on average, 25 percent less than averageprices from all sources.14
<strong>The</strong> situation does not bode well for the future. <strong>Central</strong> <strong>American</strong> producers havemassed their production at the bottom of the market and their share of the U.S. market isdeclining. <strong>Central</strong> <strong>American</strong> producers currently enjoy preferential tariff treatment fortheir products while their main competition is stifled by quotas. Incredibly, <strong>Central</strong><strong>American</strong> producers have not been able to leverage these advantages and move upmarket,either in terms of higher prices, higher value-added lines, or increased marketshare.With the removal of quotas in 2005, one of these pillars of leverage will beremoved. It is difficult, if not impossible to accurately gauge the amount of trade that<strong>Central</strong> <strong>American</strong> producers will lose once Asian competitors are freed from quota. <strong>The</strong>prevalence of quotas on the most efficient suppliers, China, Turkey, India and Pakistan,has utterly warped the landscape. Clearly, though, <strong>Central</strong> <strong>American</strong> suppliers will likelylose significant market share.It is likely that <strong>Central</strong> <strong>American</strong> producers do not directly compete with Asiansuppliers for many products. To illustrate this concept, consider the U.S. market for alower-value, commoditized garment such as a T-shirt. A typical simple T-shirt has alanded cost of approximately $20 per dozen. Quota premiums for China’s knit shirtquota average $15 per dozen, making the commercially competitive production of simpleT-shirts in China and many other Asian countries for the U.S. market impossible. Asiansuppliers are effectively barred from the U.S. market for basic T-shirts, leaving the bulkof it to suppliers in the Western Hemisphere. Once quotas are removed, the barrier willbe dropped and production of basic T-shirts will suddenly be open to competition.Clearly, <strong>Central</strong> <strong>American</strong> producers are having difficulty maintaining theirposition in the current environment. Unless producers in this region are able toquickly and aggressively improve their business plans and/or their competitiveadvantages with respect to other suppliers to the U.S. market, it is likely that theywill lose substantial amounts of market share when quotas are removed in 2005.Since there are a number of large, vertically integrated suppliers (China, Pakistan, Indiaand Turkey) that are currently restrained by quotas, the application of safeguard actionson China’s trade in Category 338/339 will have little impact on this projected outcomesince other suppliers will likely take China’s place ahead of <strong>Central</strong> <strong>American</strong> suppliers.Category 340/640: Woven Cotton and Manmade Shirts, M&BAsian suppliers have long dominated the U.S. import market for woven shirts. Ofthe top ten suppliers, only two, Mexico and Honduras, are non-Asian. <strong>Central</strong> <strong>American</strong>countries account for only 10.9 percent of Category 340/640 imports. During the yearendingJune 2003, total U.S. imports of Category 340/640 increased 12.9 percent, whileimports from <strong>Central</strong> <strong>American</strong> counties declined 4.7 percent.This situation is not surprising in that woven shirt manufacturing is not conduciveto the U.S. fabric/trade preference production model. Unlike other commodity garmentssuch as knit shirts and jeans, woven shirts tend to have significant variation in fabrication.15
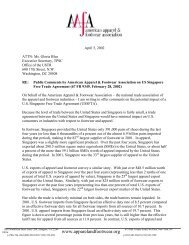
Fabric sourcing for woven shirt production is made in small purchases, or runs. U.S.fabric producers, however, tend to produce in larger runs.In many cases, the assembly of a man’s shirt requires more highly skilled sewingabilities that are more plentiful in Asia. Use of preference programs is light for theseproducts, with only 35 percent of Category 340/640 imports from <strong>Central</strong> <strong>American</strong>countries entering under a tariff program. It is understood that a substantial share ofCategory 340/640 trade from the region entered under preference programs is made fromheavier weight fabrics available from United States textile manufacturers – and typicallyused for uniforms and similar low-fashion items.Quota control of Category 340/640 trade has had a significant impact on tradepatterns during the past few decades. <strong>The</strong> largest, traditional suppliers, Hong Kong,Korea and Taiwan were provided relatively large quotas several decades ago. As theselimits were filled, the trade migrated to a number of other countries, includingBangladesh, China, India, Indonesia, and Sri Lanka. Over time, the economies andindustries of the traditional suppliers evolved beyond apparel assembly and quotas forthese suppliers are now generally under utilized, although they still remain among thelargest suppliers. Quotas for the second set of countries were set at relatively lowerlevels and these limits continue to experience heavy utilization. <strong>The</strong> most recententrants, Cambodia and Vietnam, have also been placed under quota and these limits arefilling. As a result of the growth-on-growth provision of the WTO’s Agreement on<strong>Textile</strong>s and Clothing, the annual growth rates for Category 340/640 quotas are mostly inthe 10-12 percent range. This growth has allowed Asian suppliers to effectively captureall of the recent growth in this market during the past year.As the chart below illustrates, the market share of the top five quota suppliers, aswell as other Asian suppliers, continues to grow, despite heavy quota utilization. <strong>The</strong>excess quota for the top five suppliers is entirely attributable to Korea and Hong Kong.<strong>The</strong> remaining three suppliers, Bangladesh, India, and Indonesia, have had an averagequota utilization of 97.8 percent during the past three years.16
It is clear from the current situation that <strong>Central</strong> <strong>American</strong> suppliers cannotcompete with Asian suppliers, even when quota premiums are included in the costs.This cost is not insignificant. Premiums in China have averaged approximately $20 perdozen, or one-third of the average prices for China’s trade. Once the quotas, andtherefore the quota premiums, are removed, two-thirds of <strong>Central</strong> America’s trade inCategory 340/640 (i.e.: the amount not currently receiving duty preferences) will bedecimated by quota-free competition from Asian sources.<strong>The</strong> remaining third of <strong>Central</strong> America’s production may or may not bethreatened. <strong>Central</strong> <strong>American</strong> and Asian suppliers are currently in different productniches and price points. To the extent that <strong>Central</strong> <strong>American</strong> trade preference shipmentsare competing with Asian suppliers, Asian suppliers will be able to gain additionalmarket share from <strong>Central</strong> <strong>American</strong> producers. To the extent this trade is not directlycompeting with Asian suppliers, it is not clear what will occur once quotas are removed.Asian suppliers may or may not expand their trade “down-market” to compete in thissegment.17
CATEGORY 347/348: COTTON TROUSERS AND SHORTSU.S. imports of cotton trousers and shorts have increased steadily for severalyears. Totaling 98.4 million dozen during 1998, imports have increased each calendaryear reaching 140.3 million dozen during 2002. Imports further increased to 153.2million dozen during the year-ending June 2003. At the same time, imports from <strong>Central</strong><strong>American</strong> countries have grown from 17.5 to 21.0 million dozen. In terms of marketshare, however, <strong>Central</strong> <strong>American</strong> suppliers’ share of imports declined from 15.7 percentduring 1998 to 13.7 percent during the year-ending June 2003.Category 347/348 trade from <strong>Central</strong> <strong>American</strong> countries, generally, is in lowervaluedtypes of products and its prices are lower than those of other suppliers. <strong>The</strong> tablebelow breaks out Category 347/348 import data by major product groupings: jeans, knitpants, other woven pants, and shorts.18
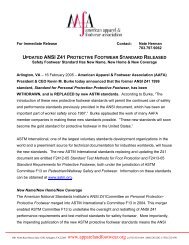
U.S. Imports Of Category 347/348Year-Ending June, 2003By Major GroupingIn DozensTop Five <strong>Central</strong>Group World Asia America OthersHigh Value ItemsJeansImports 41,789,398 6,023,119 5,119,100 30,647,179Share 27.3% 19.9% 24.4% 30.1%Avg. Price 91.73 91.20 77.58 94.20Ratio to World Prices 99.4% 84.6% 102.7%Woven PantsImports 57,009,403 12,599,186 6,342,952 38,067,265Share 37.2% 41.5% 30.2% 37.4%Avg. Price 82.64 84.00 63.40 85.40Ratio to World Prices 101.6% 76.7% 103.3%Low Valued ItemsKnit PantsImports 18,070,341 3,816,290 3,662,554 10,591,497Share 11.8% 12.6% 17.4% 10.4%Avg. Price 51.33 54.97 39.74 54.03Ratio to World Prices 107.1% 77.4% 105.3%ShortsImports 36,379,571 7,891,337 5,883,657 22,604,577Share 23.7% 26.0% 28.0% 22.2%Avg. Price 49.80 53.03 34.53 52.65Ratio to World Prices 106.5% 69.3% 105.7%Total Category 347/348Imports 153,248,713 30,329,932 21,008,263 101,910,518Share 100.0% 100.0% 100.0%Avg. Price 73.63 73.72 54.64 77.52Ratio to World Prices 100.1% 74.2% 105.3%Source: U.S. Census Bureau19
As shown, <strong>Central</strong> <strong>American</strong> suppliers have a lower percentage of their trade inthe higher valued items, jeans and woven trousers, when compared with the top 5 Asianquota suppliers and all other trading partners. <strong>Central</strong> <strong>American</strong> trade is moreconcentrated in the lower valued items, knit pants and shorts. Further, prices for <strong>Central</strong><strong>American</strong> merchandise are consistently less than prices for the top five Asian quotasuppliers as well as all other suppliers. <strong>The</strong> price differences are significant: anywherefrom an average of 15.4 percent less for jeans to 30.7 percent less for shorts. For allCategory 347/348 trade, <strong>Central</strong> <strong>American</strong> exports had average unit prices of $54.64 perdozen. This is 25.8 percent less than the average prices for all suppliers.<strong>The</strong>se price comparisons are based on FOB terms, prior to duty preference. Whenduties are added, in jeans for example, <strong>Central</strong> <strong>American</strong> prices, without duty, are 72.5percent of world average for comparable merchandise with full duty.A number of quota-related events impacted the changes in trade levels since 2000.Imports from Vietnam increased from nearly zero during 2000 to 11.3 million dozenduring the year-ending June 2003. Thus, Vietnam accounted for 44.3 percent of thegrowth in imports during this period. Vietnam was not previously subject to quota.Beginning in May 2003, Vietnam’s trade was limited to seven million dozen on anannual basis, meaning Vietnam’s trade will decline sharply at least through the end of2004.During 2002, Bangladesh massively over shipped its Category 347/348 limit andborrowed from its 2003 limit in order to avoid an embargo. This borrowing is being paidback at a rate of 3:1, effectively causing a large cut in Bangladesh’s 2003 access to theU.S. market this year, despite annual quota growth of nearly 13 percent.Hong Kong’s trade in Category 347/348 declined 3.8 percent between 2000 andthe year-ending June 2003. Annual quota growth for Hong Kong, even after growthacceleration under the WTO, is less than one percent. Since Hong Kong regularly fills itsCategory 347/348 limit, it cannot participate in any growth in this product until quotasare removed in 2005.<strong>The</strong> top five quota suppliers have experienced extremely heavy quota utilizationin recent years. Two of those countries, Turkey and Bangladesh, have fully utilized theirlimits each of the past three years. <strong>The</strong> average utilization for these five suppliers duringthe past three years has been an amazing 98.8 percent, indicating significant pent updemand for Category 347/348 merchandise from these countries.Despite the apparent difficulties inherent with importing cotton pants and shortsfrom Asian quota suppliers, these countries increased their market shares, in a growingU.S. market. <strong>The</strong> top five Asian suppliers subject to quota since 2000 increased theircombined share of imports from 16.5 percent during 2000 to 17.0 percent during theyear-ending June 2003. This growth occurred despite the fact that their combined20
quotas, as a percent of imports, declined from 19.2 percent of imports during 2000 to18.6 percent of imports during the year-ending June 2003. 17Given the current circumstances relating to quota, it is apparent that imports fromthe largest Asian suppliers will decline for the balance of 2003 and likely through 2004 aswell. <strong>Central</strong> <strong>American</strong> suppliers have experienced difficulty competing with Asiansuppliers, despite significantly lower prices and quota problems being encountered bycompetitors in Asia. When quotas and the related distortions in trade are removed,<strong>Central</strong> <strong>American</strong> suppliers will be at a huge disadvantage and are poised to lose asubstantial amount of business.CATEGORY 352: COTTON UNDERWEARUnlike the situation with respect to Categories 338/339, 340/640 and 347/348,Western Hemisphere suppliers, including <strong>Central</strong> <strong>American</strong> countries, maintain amassive share of the U.S. import market and stand a reasonable chance of maintainingthis business after 2004. North/Western Hemisphere suppliers (CBI & Mexico)17 A large portion of Turkey’s Category 347/348 quota is reserved for shorts, which is largely untapped.When this quota “overhang” is eliminated, the top five Asian quota suppliers’ quotas total only 16.4percent of imports during the year-ending June 2003.21
accounted for 65 percent of all Category 352 imports during the year-ending June 2003.<strong>Central</strong> <strong>American</strong> countries accounted for 45.3 percent of imports.<strong>The</strong> production of cotton underwear in CBI and <strong>Central</strong> America is well suited toinclude the use of U.S. inputs. Co-production with U.S. inputs has the general advantageof shortening lead times as well as specific, additional advantages: Many cottonunderwear products are made with little variation in style, including men’s knit briefs andunderwear-type T-shirts and tank tops. This allows U.S. fabric makers to implementlarge production runs. <strong>The</strong> sewing required to produce these garments also has littlevariation from season to season, reducing the requirement for large amounts of highlyskilled sewers.As a result, virtually all U.S. imports in Category 352 from CBI and <strong>Central</strong><strong>American</strong> countries are provided preferential duty treatment. During the years 1998thorough September 2000, roughly 98 percent of all Category 352 imports from CBI and<strong>Central</strong> <strong>American</strong> countries was entered under HTS Heading 9802. With theimplementation of the CBTPA, Category 352 trade from CBI countries migrated into thebasic CBTPA origin rule preference and the knit apparel provisions. 18<strong>The</strong> knit apparel provisions have proved extremely popular. During the initialquota year that began on October 1, 2001, CBTPA countries shipped 69.5 million SMEsunder this provision. In subsequent two years, as procedures and rules governing the useof this provision became clearer, usage increased sharply, to 149.6 millions SMEs and255.3 million SMEs. During 2002, U.S. imports of cotton underwear under the knitapparel provision totaled 90.3 million SME. This equates to 60.4 percent of the amountcharged against the provision’s limitation for the year-ending September 2002 for all knitapparel.<strong>The</strong> knit apparel provision is another example of a positive development for the<strong>Central</strong> <strong>American</strong> industry whereby new trade preferences allowed for a diversification inthe market in the region and the market was quick to react. Furthermore, this provisionhas allowed the <strong>Central</strong> <strong>American</strong> industry to diversify and meet the changing needs ofU.S. consumers.Unlike the other products analyzed in this section, cotton underwear, generally,appears to be an area where <strong>Central</strong> <strong>American</strong> producers are competitive. It is likely, butnot certain, that underwear production in the region will remain competitive after quotasare removed in 2005. <strong>The</strong> experience with the knit apparel provision shows that themarket is quick to adopt business models that allow the use of inputs from a wider varietyof sources. Presuming a <strong>Central</strong> <strong>American</strong> agreement would allow unlimited duty-freetreatment for underwear made from regionally formed fabrics, this would provide anadditional boost to the region’s outlook in this market. It is not clear, however, if theU.S. textile industry would be able to continue to provide these materials in the event ofchanging consumer tastes.18Origin rule: duty-free treatment for garments assembled in CBTPA countries from U.S. yarn & fabric.Knit apparel provision: Garments assembled in a CBTPA country from U.S. yarn & regionally knit fabric.22
Because of the flexibility allowed for cotton underwear under CBTPA, thiscategory has been one of the most successful for the <strong>Central</strong> <strong>American</strong> industry, as wellas for U.S. textile manufacturers.ConclusionExisting trade preference programs have had some success in promoting U.S. inputs andin encouraging the development of a textile and apparel industry, primarily based onassembly operations of lower valued products. As a result, the regional industry hasemerged as an important market for U.S. textile companies. But these programs are notvigorous enough to help the regional textile and apparel enter the next critical stage ofdevelopment and diversification. Moreover, they are not enough to support export growthfor U.S. based textile companies.Through individual product analyses it is clear that, in most instances, the <strong>Central</strong><strong>American</strong> textile and apparel industry is not well equipped to sustain itself, especially inlight of the expected competition after quotas are removed. Even assuming continuedrestraints on China, <strong>Central</strong> America faces intense competition from a number of othercurrently restrained countries.A U.S./<strong>Central</strong> America FTA that builds upon the yarn forward essential characterapproach by including Cumulation, a commercially meaningful short supplyprovision, limited, but meaningful TPLs, and other key flexibilities can ensure that<strong>Central</strong> America remain competitive and continues to be a viable market for U.S.textile products.23
APPENDIX IApproximate U.S. <strong>Textile</strong> <strong>And</strong> <strong>Apparel</strong> EmploymentDirectly Dependent On <strong>Central</strong> <strong>American</strong> Exports During 2002ProductEmploymentFiber, Yarn & Thread Mills 846Fabric Mills 2,685<strong>Apparel</strong> Manufacturing 20,474TOTAL 24,005Note: Figures are a rough approximation based on assumed export/production andexport/employment ratios.Methodological Note<strong>The</strong> figures assume that the share of U.S. employment that is directly dependenton <strong>Central</strong> <strong>American</strong> exports is substantially the same as the share of total U.S.production that is exported to <strong>Central</strong> <strong>American</strong> countries. <strong>The</strong> share of total U.S.production that is exported to <strong>Central</strong> America was calculated in three separate steps, asfollows:(a) U.S. Domestic Production Of Yarn, Fabric <strong>And</strong> <strong>Apparel</strong>: Domestic yarn andfabric production is not available in terms of value. Since value data wasneeded for this analysis, it was assumed that the observed export/productionratios in terms of quantity for both yarn and fabric were substantially thesame as the export/production ratios in terms of value. <strong>The</strong> export/productionratios in terms of quantity were obtained from data published in the U.S.Census Current Industrial Reports for yarn, knit fabric, broadwoven fabric,and apparel. Since apparel production is available in terms of value, noestimation was necessary and the production figure published by Census for2002 was used.(b) <strong>Central</strong> <strong>American</strong> Share Of Total Yarn, Fabric <strong>And</strong> <strong>Apparel</strong> Production:U.S. exports to <strong>Central</strong> America in each of the products at hand were dividedby the estimated U.S. production of that product in terms of value to come upwith the share of <strong>Central</strong> <strong>American</strong> exports to total U.S. production. U.S.yarn, fabric and apparel export data to <strong>Central</strong> America was compiled fromOTEXA statistics.(c) <strong>Central</strong> <strong>American</strong> Share Of Total Yarn, Fabric <strong>And</strong> <strong>Apparel</strong> Employment:<strong>The</strong> <strong>Central</strong> <strong>American</strong> shares calculated as described above were applied tototal yarn, fabric and apparel manufacturing employment to determine theestimated number of jobs that are directly dependent on exports to <strong>Central</strong>America. <strong>The</strong> employment data was obtained from U.S. Bureau of LaborStatistics figures.
APPENDIX IILIST OF COMMONLY USED ACRONYMSAAFACBICBTPAFTAFTZITCNAFTASMETPLWTOAMERICAN APPAREL & FOOTWEAR ASSOCIATIONCARIBBEAN BASIN INITIATIVECARIBBEAN BASIN TRADE PARTNERSHIP ACTFREE TRADE AGREEMENTFOREIGN TRADE ZONEINTERNATIONAL TRADE COMMISSIONNORTH AMERICA FREE TRADE AGREEMENTSQUARE METER EQUIVALENTTARIFF PREFERENCE LEVELSWORLD TRADE ORGANIZATION