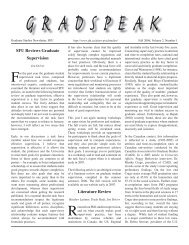
652 M. W. Hart and P. B. Marko(Johannesson 1988) but the quantitative effects ofvariation in colonization rate (independent of differencesin gene flow after colonization) have beenlargely overlooked by marine phylogeographers, perhapsbecause the two effects could not previously bedifferentiated in analyses that used F-statistics interpretedmainly in terms of ongoing gene flow. Lastly,Puritz et al. found qualitatively different patterns ofN e variation between these two species: a two-fold tofive-fold increase in M. calcar N e (compared to ancestralN e ), and at least an order of magnitude decreasein P. exigua N e (Fig. 5). We are unsurewhether these two contrasting differences in t andN e are causally linked, or independently varying, inthese two species, but they strongly contradict asimple expectation of similar demographic processesunderlying similar spatial patterns of geneticdifferentiation.On a second geographic scale, Puritz et al. compareddemographic parameters for population pairsof both species from the far ends of the eastern andwestern biogeographic regions documented by Ayreet al. (2009). Because these eastern and westernsamples were from locations in South Australia andNew South Wales that are separated by an additionalcandidate biogeographic barrier (soft sedimentshores between Wilson’s Promontory and theregion around Adelaide to the west in SouthAustralia) outside of the immediate region of thephylogeographic break that was sampled on amuch finer scale by Ayre et al., the results ofPuritz et al. tend to complement, rather than test,the patterns reported previously. Both species showvery strong spatial differentiation on this geographicscale (for mtDNA variation, M. calcar F CT ¼ 0.58; P.exigua F CT ¼ 0.72), with reciprocally monophyleticallele or haplotype genealogies at one or both loci.In this comparison, east–west population divergencetimes were generally similar to those estimated byAyre et al. (2009) but significantly younger in M.calcar (223,000 years) than in P. exigua (4600,000years; Fig. 4), and older than the M. calcar divergencetimes across Bass Strait. Like the Bass Straitcomparison, migration rates were zero for both speciesand the two species differed in the pattern ofevolution of population size (expanding in M. calcar,Downloaded from icb.oxfordjournals.org at <strong>Simon</strong> <strong>Fraser</strong> <strong>University</strong> on November 2, 2010Fig. 5 Posterior probability distributions of effective population sizes (N e ) of sea stars as in Fig. 4. Each panel shows estimated ancestralN e (gray symbols and text), plus the estimate for extant populations from New South Wales (black, large symbols and text) andfrom either South Australia (above; small symbols and text) or from Tasmania (below). For P. exigua (right), N e estimates werelog-transformed in order to show both small (extant) and large (ancestral) N e values on the same scale. Note the seconddependent variable scale (gray) for lower probability values of ancestral N e estimates in P. exigua.
Divergence genetics and modes of development 653shrinking in P. exigua, relative to the ancestral population;Fig. 5). Because all estimates of migrationrates on these spatial scales were zero, the spatialdifferentiation and contrasting histories of populationgrowth are not likely to be explained by differencesin larval dispersal. One candidate explanationis based on differences in mating systems: P. exiguaindividuals are small sex-changing hermaphroditeswith fecundities on the order of 10 2 –10 3 per eggmass, whereas M. calcar individuals are large gonochoricbroadcast spawners with clutch sizes severalorders of magnitude larger than in P. exigua. SmallN e in P. exigua may reflect population bottlenecksexacerbated by the evolution of very small clutchsize. IMA analyses of variation in both species onsmaller spatial scales (within each of the three regionswe considered in this comparison) will beuseful in estimating the possible difference betweenspecies in local migration rates within biogeographicalregions (as suggested by Ayre et al. 2009).However, none of these comparisons so far suggesta primary role for gene flow via larval dispersal (ordifferences between species in mode of development)for generating large-scale phylogeographic structureor determining species differences in these spatialpatterns.In the northeastern Pacific, Marko et al. (2010)combined mtDNA with some nuclear intron orother noncoding nuclear DNA sequences for a similartaxonomically broad sample of co-occurring speciesfrom a temperate rocky-shore community. Thisstudy did not include a single putative regional biogeographicbarrier (although some strong phylogeographicbreaks occur among some of the speciessurveyed), but rather focused on inter-specific patternsof spatial genetic diversity caused by latePleistocene glaciations, especially the last glacial maximum(LGM) 20,000 years ago. Among the 14 speciesstudied, 12 showed statistically significantevidence of past population expansions as measuredby standard summary statistics that assume equilibriumrates of mutation, gene flow, and genetic drift(i.e., Tajima’s D, Fu’s F s , and Ramos-Osins andRozas’ R2; Tajima 1989; Ramos-Onzins and Rozas1992). Eleven species showed no strong populationdifferentiation, together suggesting a shared demographichistory of recent postglacial expansion ofthe population across the entire community.However, when analyzed with IMA, some speciesshowed consistently ancient inter-population divergencetimes that were much older than the LGM(Balanus glandula, Patiria miniata, and Xiphisteratropurpureus) whereas others displayed youngerpopulation divergence times (e.g., Nucella lamellosa,X. mucosus) consistent with post-LGM recolonization.Old population divergences were found in specieswith (B. glandula, P. miniata) and without(N. lamellosa, X. atropurpureus) long-lived planktoniclarvae, and IMA estimates of migration rates were notconsistently correlated with either the mode of reproductionor the age of the most significant populationdifferentiation. Notably, Marko et al. (2010) foundvery old (B. glandula) or very young (X. mucosus)multilocus population divergence times in specieswithout significant mtDNA population differentiation.Population separation times inferred with IMAwere consistent with demographic reconstructions ofchanges in past population size (from Bayesian skylineplots); many species exhibited evidence of largedemographic expansions in the past, but the timingof these expansions varied dramatically among speciesin an unpredictable manner with respect to developmentalmode. Marko et al. (2010) concludedthat there might be more evidence for long-termpopulation persistence (population-pairs with old divergencetimes) among species with planktonic larvaldispersal than among species with benthic embryosand larvae, but found no statistically significant associationbetween population history and mode ofdevelopment.In the same biogeographic region studied by Markoet al. (2010), we have tried to carefully compare regionalvariation in spatial structure and demographic historyin two broadly sympatric species with differentmodes of development (N. lamellosa, P. miniata)using IMA analyses of a large sample of mtDNA plussix anonymous noncoding nuclear DNA sequencemarkers for each species (T. McGovern, C. Keever, C.Saski, M. Hart, P. Marko, unpublished results). Thisdetailed comparison has revealed clear examples ofthree types of incongruence between spatial populationstructure and underlying demographic history thattend to reject the simple predicted effects of modeof development and larval dispersal on rates of geneflow and the evolution of population differentiation.The first example demonstrates how unexpectedpatterns of differentiation with respect to larval dispersalpotential can be more readily explained oncethe patterns are considered in the temporal contextprovided by IMA. Across Queen Charlotte Sound inBritish Columbia (between the northern end ofVancouver Island and the Haida Gwaii/Alexander archipelagosof northern BC and southeastern Alaska),P. minata shows a large and highly statistically significantmtDNA population genetic break (F CT 0.4) butN. lamellosa shows no significant genetic differentiationacross the same expanse. Given their differentmodes of development, this spatial pattern ofDownloaded from icb.oxfordjournals.org at <strong>Simon</strong> <strong>Fraser</strong> <strong>University</strong> on November 2, 2010