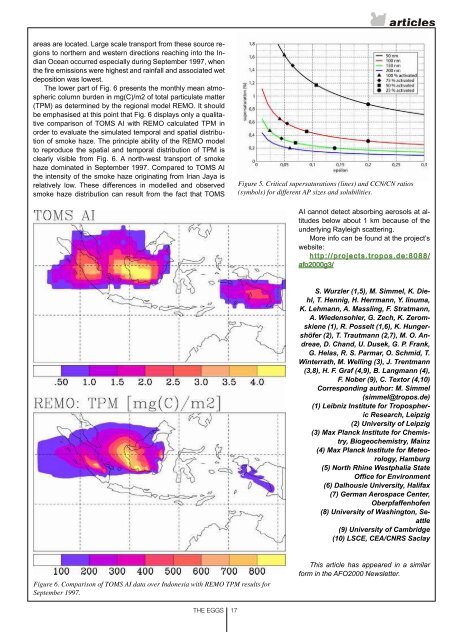
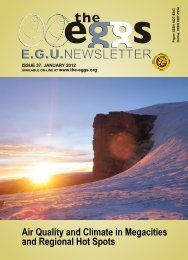
ing different aspects of this topic <strong>on</strong> a range of spatial and temporalscales. Combined with <strong>the</strong> input data from <strong>the</strong> laboratoryexperiments this integrated approach allows a more completeview <strong>on</strong> physical, chemical and dynamical aspects of biomassburning plumes. The model hierarchy facilitates seamlesstransiti<strong>on</strong> from microscale to regi<strong>on</strong>al scale models and spans<strong>the</strong> temporal scale from a few minutes to m<strong>on</strong>ths and years.Am<strong>on</strong>g o<strong>the</strong>r aspects <strong>the</strong> modelling efforts address:• impact of biomass burning aerosol <strong>on</strong> cloud microphysicsand precipitati<strong>on</strong> using detailed and parameterized model approachesincluding <strong>the</strong> ice phase• evoluti<strong>on</strong> of individual biomass burning plumes, c<strong>on</strong>sideringdynamical evoluti<strong>on</strong> and troposphere-stratosphere exchangeof emissi<strong>on</strong>s as well as chemical processes in youngplumes• effect of radiative transport <strong>on</strong> chemistry and dynamics of<strong>the</strong> atmosphere and determinati<strong>on</strong> of <strong>the</strong> role of biomass burning<strong>on</strong> <strong>the</strong> regi<strong>on</strong>al climate• effect of biomass burning <strong>on</strong> <strong>the</strong> atmospheric budgets oftrace c<strong>on</strong>stituents, water, and energy <strong>on</strong> <strong>the</strong> regi<strong>on</strong>al scaleSelected resultsOptical properties of <strong>the</strong> biomass burning aerosol: Modelling<strong>the</strong> impact of vegetati<strong>on</strong> fires <strong>on</strong> radiative transport requiresaccurate knowledge of <strong>the</strong> optical properties of biomass burningaerosol. Optical properties of particles are well describedby Mie <strong>the</strong>ory and mainly depend <strong>on</strong> particle size, shape, andindex of refracti<strong>on</strong> m. However, for biomass burning aerosolespecially m is not well known. The EFEU data set provides<strong>the</strong> unique opportunity to investigate m for various fuel typesand burning c<strong>on</strong>diti<strong>on</strong>s. As an example Fig. 4 shows 2-minuteaverages of <strong>the</strong> measured SSA (single scattering albedo = ratioof scattering and extincti<strong>on</strong> coefficient) at a wavelength of550 nm of about 9-minutes old biomass burning aerosol froman oak (dry) fire; <strong>the</strong> corresp<strong>on</strong>ding burning c<strong>on</strong>diti<strong>on</strong>s are alsoshown as dCO/dCO2 trace (crosses), where dCO and dCO2represent CO and CO2 c<strong>on</strong>centrati<strong>on</strong>s above background levels.There was an obvious positive correlati<strong>on</strong> between SSAand dCO/dCO2. In <strong>the</strong> smouldering phase at <strong>the</strong> beginningof <strong>the</strong> experiment (dCO/dCO2 > 8%) SSA was very high withvalues around 0.95. With <strong>the</strong> start of <strong>the</strong> flaming combusti<strong>on</strong>(dCO/dCO2 < 8%) at 11:33 SSA showed a sharp decreaseFigure 4. Comparis<strong>on</strong> between measured and modelled singlescattering albedo (SSA) for a 1-hour fire with dry oak as fuel.down to approximately 0.7 followed by a relatively steady increaseto just above 0.9 accompanied by an increase in dCO/dCO2.For comparis<strong>on</strong>, Fig. 4 also shows Mie calculati<strong>on</strong>s of <strong>the</strong>SSA for three different black carb<strong>on</strong> (BC) mass fracti<strong>on</strong>s based<strong>on</strong> <strong>the</strong> measured number size distributi<strong>on</strong>s under <strong>the</strong> assumpti<strong>on</strong>of spherical particle shape which is justified by SEM pictures.Due to <strong>the</strong> significantly lower volatility of black carb<strong>on</strong>(BC) compared to organic carb<strong>on</strong> (OC) we performed <strong>the</strong> Miecalculati<strong>on</strong>s for coated spheres with a BC core (mBC = 1.75-0.44i) and an OC shell (mOC = 1.53-0.0i). Fig. 4 shows that<strong>the</strong> modelled SSA is fairly c<strong>on</strong>stant for each BC mass fracti<strong>on</strong>.Hence, changes in size distributi<strong>on</strong> al<strong>on</strong>e cannot explain <strong>the</strong>observed variati<strong>on</strong>s in SSA which indicates a significant role ofparticle chemistry and hence m. We found that BC mass fracti<strong>on</strong>sof 2 and 20% represent <strong>the</strong> observed extreme SSA valuesof about 0.95 and 0.7, respectively, reas<strong>on</strong>ably well. Thisis c<strong>on</strong>sistent with <strong>the</strong> expected higher BC c<strong>on</strong>tent for moreflaming fires (lower dCO/dCO2 values) which produce highercombusti<strong>on</strong> temperatures and c<strong>on</strong>sequently more soot. Hence,our results suggest that young biomass burning aerosol maybe modelled as BC spheres coated with a variable amount ofOC depending <strong>on</strong> <strong>the</strong> burning c<strong>on</strong>diti<strong>on</strong>s. Similar Mie calculati<strong>on</strong>swill be performed for all of <strong>the</strong> wood types investigated in<strong>the</strong> EFEU laboratory campaign and <strong>the</strong>n hopefully c<strong>on</strong>densedinto a single parameterizati<strong>on</strong> at least for certain categories ofwood (e.g. nor<strong>the</strong>rn boreal, tropical, peat, etc.).Drop nucleati<strong>on</strong> ability of <strong>the</strong> aerosol particles: As a step for<strong>the</strong> understanding of <strong>the</strong> influence of biomass burning aerosol<strong>on</strong> cloud formati<strong>on</strong>, potential cloud c<strong>on</strong>densati<strong>on</strong> nuclei (CCN)were identified by determining <strong>the</strong> CCN/CN ratio in <strong>the</strong> laboratoryexperiments. This was d<strong>on</strong>e for different dry particle sizes(50, 100, 150, 250, and 325 nm) at different supersaturati<strong>on</strong>sfrom 0.24 to 1.64 %. The experimental results are compared tocritical supersaturati<strong>on</strong>s calculated from extended Köhler <strong>the</strong>orywhich is also used in <strong>the</strong> detailed microphysical models appliedin <strong>the</strong> project. Fig. 5 shows <strong>the</strong> critical supersaturati<strong>on</strong> forvarying e (soluble fracti<strong>on</strong>, here amm<strong>on</strong>ium sulphate) and APsizes (lines with different colors). CCN/CN ratios of 25 (circles),50 (squares), 75 (diam<strong>on</strong>ds), and 100 % (triangles) are deducedfrom <strong>the</strong> measurements and compared to <strong>the</strong> <strong>the</strong>oreticalvalues. The black square <strong>on</strong> <strong>the</strong> red line means, e.g., that50 % of <strong>the</strong> 100 nm AP are activated at 0.46 % supersaturati<strong>on</strong>which corresp<strong>on</strong>ds to a <strong>the</strong>oretical value of e = 0.08. One cansee that <strong>the</strong> soluble fracti<strong>on</strong> generally is small (e < 10 % forabout 50 % of <strong>the</strong> particles) as it is expected for biomass burningAP and that e is slightly higher for smaller AP sizes (50 nmvs. 150 nm). Despite <strong>the</strong>ir small e, larger particles (150, 200nm) are activated at relatively low supersaturati<strong>on</strong>s that easilycould be reached in clouds. Obviously, <strong>the</strong> critical supersaturati<strong>on</strong>sare very sensitive to e < 20 % especially for smaller sizes(50, 100 nm). Therefore, small changes in epsil<strong>on</strong> could highlyinfluence <strong>the</strong> number of drops in clouds affected by biomassburning. The CCN/CN ratios are quite similar for <strong>the</strong> differentwood types (spruce, pine, oak, and musasa) c<strong>on</strong>sidered in <strong>the</strong>EFEU experiments.Modelling results from <strong>the</strong> regi<strong>on</strong>al model REMO: Thespatial distributi<strong>on</strong> of smoke haze in Ind<strong>on</strong>esia in 1997 canbe derived from <strong>the</strong> TOMS Aerosol Index (AI) data, shown asm<strong>on</strong>thly mean in <strong>the</strong> upper part of Fig. 6. During <strong>the</strong> smokehaze period maximum intensity in TOMS AI data is visible in<strong>the</strong> provinces of South Sumatra, Jambi, Central and West Kalimantan,and <strong>on</strong> Irian Jaya, where <strong>the</strong> main peat fire emissi<strong>on</strong>THE EGGS 16
areas are located. Large scale transport from <strong>the</strong>se source regi<strong>on</strong>sto nor<strong>the</strong>rn and western directi<strong>on</strong>s reaching into <strong>the</strong> IndianOcean occurred especially during September 1997, when<strong>the</strong> fire emissi<strong>on</strong>s were highest and rainfall and associated wetdepositi<strong>on</strong> was lowest.The lower part of Fig. 6 presents <strong>the</strong> m<strong>on</strong>thly mean atmosphericcolumn burden in mg(C)/m2 of total particulate matter(TPM) as determined by <strong>the</strong> regi<strong>on</strong>al model REMO. It shouldbe emphasised at this point that Fig. 6 displays <strong>on</strong>ly a qualitativecomparis<strong>on</strong> of TOMS AI with REMO calculated TPM inorder to evaluate <strong>the</strong> simulated temporal and spatial distributi<strong>on</strong>of smoke haze. The principle ability of <strong>the</strong> REMO modelto reproduce <strong>the</strong> spatial and temporal distributi<strong>on</strong> of TPM isclearly visible from Fig. 6. A north-west transport of smokehaze dominated in September 1997. Compared to TOMS AI<strong>the</strong> intensity of <strong>the</strong> smoke haze originating from Irian Jaya isrelatively low. These differences in modelled and observedsmoke haze distributi<strong>on</strong> can result from <strong>the</strong> fact that TOMSFigure 5. Critical supersaturati<strong>on</strong>s (lines) and CCN/CN ratios(symbols) for different AP sizes and solubilities.AI cannot detect absorbing aerosols at altitudesbelow about 1 km because of <strong>the</strong>underlying Rayleigh scattering.More info can be found at <strong>the</strong> project’swebsite:h t t p : / / p r o j e c t s . t r o p o s . d e : 8 0 8 8 /afo2000g3/S. Wurzler (1,5), M. Simmel, K. Diehl,T. Hennig, H. Herrmann, Y. Iinuma,K. Lehmann, A. Massling, F. Stratmann,A. Wiedensohler, G. Zech, K. Zeromskiene(1), R. Posselt (1,6), K. Hungershöfer(2), T. Trautmann (2,7), M. O. Andreae,D. Chand, U. Dusek, G. P. Frank,G. Helas, R. S. Parmar, O. Schmid, T.Winterrath, M. Welling (3), J. Trentmann(3,8), H. F. Graf (4,9), B. Langmann (4),F. Nober (9), C. Textor (4,10)Corresp<strong>on</strong>ding author: M. Simmel(simmel@tropos.de)(1) Leibniz Institute for TroposphericResearch, Leipzig(2) University of Leipzig(3) Max Planck Institute for Chemistry,Biogeochemistry, Mainz(4) Max Planck Institute for Meteorology,Hamburg(5) North Rhine Westphalia StateOffice for Envir<strong>on</strong>ment(6) Dalhousie University, Halifax(7) German Aerospace Center,Oberpfaffenhofen(8) University of Washingt<strong>on</strong>, Seattle(9) University of Cambridge(10) LSCE, CEA/CNRS SaclayFigure 6. Comparis<strong>on</strong> of TOMS AI data over Ind<strong>on</strong>esia with REMO TPM results forSeptember 1997.This article has appeared in a similarform in <strong>the</strong> AFO2000 Newsletter.THE EGGS 17