Annexure –1 Sampling techniques used for selection of the units ...
Annexure –1 Sampling techniques used for selection of the units ...
Annexure –1 Sampling techniques used for selection of the units ...
- No tags were found...
Create successful ePaper yourself
Turn your PDF publications into a flip-book with our unique Google optimized e-Paper software.
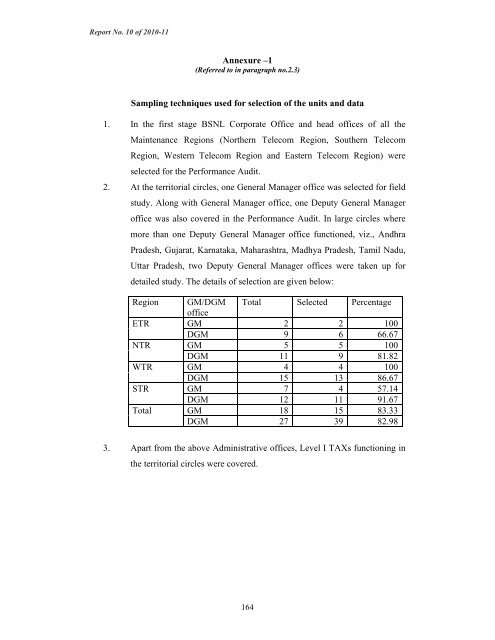
Report No. 10 <strong>of</strong> 2010-11<strong>Annexure</strong> <strong>–1</strong>(Referred to in paragraph no.2.3)<strong>Sampling</strong> <strong>techniques</strong> <strong>used</strong> <strong>for</strong> <strong>selection</strong> <strong>of</strong> <strong>the</strong> <strong>units</strong> and data1. In <strong>the</strong> first stage BSNL Corporate Office and head <strong>of</strong>fices <strong>of</strong> all <strong>the</strong>Maintenance Regions (Nor<strong>the</strong>rn Telecom Region, Sou<strong>the</strong>rn TelecomRegion, Western Telecom Region and Eastern Telecom Region) wereselected <strong>for</strong> <strong>the</strong> Per<strong>for</strong>mance Audit.2. At <strong>the</strong> territorial circles, one General Manager <strong>of</strong>fice was selected <strong>for</strong> fieldstudy. Along with General Manager <strong>of</strong>fice, one Deputy General Manager<strong>of</strong>fice was also covered in <strong>the</strong> Per<strong>for</strong>mance Audit. In large circles wheremore than one Deputy General Manager <strong>of</strong>fice functioned, viz., AndhraPradesh, Gujarat, Karnataka, Maharashtra, Madhya Pradesh, Tamil Nadu,Uttar Pradesh, two Deputy General Manager <strong>of</strong>fices were taken up <strong>for</strong>detailed study. The details <strong>of</strong> <strong>selection</strong> are given below:RegionETRNTRWTRSTRTotalGM/DGM Total Selected Percentage<strong>of</strong>ficeGM 2 2 100DGM 9 6 66.67GM 5 5 100DGM 11 9 81.82GM 4 4 100DGM 15 13 86.67GM 7 4 57.14DGM 12 11 91.67GM 18 15 83.33DGM 27 39 82.983. Apart from <strong>the</strong> above Administrative <strong>of</strong>fices, Level I TAXs functioning in<strong>the</strong> territorial circles were covered.164
Report No. 10 <strong>of</strong> 2010-11<strong>Annexure</strong> – II(Referred to in paragraph no.2.8.4)Statement showing links and cost <strong>of</strong> Purchase Order (phase wise)PHASEDate <strong>of</strong>PurchaseOrderCost <strong>of</strong>PurchaseOrder (Rs. incrore)Links providedPHASE-I 29.09.2005 19.62 3000PHASE-II 20.12.2006 60.20 19200PHASE-III 23.05.2008 58.80 NATOTAL 138.62 22200165
Report No. 10 <strong>of</strong> 2010-11<strong>Annexure</strong> – III(Referred to in paragraph no.2.8.4.1)Delay in Providing Point <strong>of</strong> Intersection (POI) to private operatorsRegionDivision/RouteDelay (indays)From ToAmount (Rs. inlakh)NTR Lucknow 6 137 5.45ETRWTRBihar &Jharkhand300 570 264.00 #Ahmedabad 44 168 9.50Rajkot 0 545 14.96Bhopal 17 336 9.22Raipur 2 101 3.31Total 306.44# includes potential loss due to non-provisioning <strong>of</strong> POI also166
Report No. 10 <strong>of</strong> 2010-11<strong>Annexure</strong> – IV(Referred to in paragraph no.2.8.4.2)IUC Outstanding (Post-IOBAS Period) against Private OperatorsRegion Division/Route PeriodAmount (Rs. inFrom Tocrore)ETR Patna, April 2005 March 2009 37.18Bhubaneswar,Guwahati,KolkataWTR Gujarat(Ahmedabadand Rajkot)November2005January20094.47STRMadhyaPradesh(Bhopal andRaipur)December2005March 2009 2.00Bangalore and April 2008 March 2009 0.29ChennaiTotal 43.94167
Report No. 10 <strong>of</strong> 2010-11<strong>Annexure</strong> – V(Referred to in paragraph no.3.1)Organisation Chart <strong>of</strong> Helicopter Complex168
Report No. 10 <strong>of</strong> 2010-11<strong>Annexure</strong>-VI(Referred to in paragraph no.3.1)Statement showing details <strong>of</strong> ALH project cost (September 2009)(Rs. in crore)Nature <strong>of</strong> Sanction cost Expenditure RemarksexpenditureincurredDesign <strong>of</strong> ALH-Basic Helicopter536.05 536.05 Customer fundedWSI ProjectArmy 405.95 243.64Navy 139.92 137.81IAF 54.29 42.70Customer fundedSub total <strong>of</strong> WSI 600.16 424.15ProjectTotal 1136.21 960.20 Customer fundedInfrastructureCapital – ALH 259.25 176.52 Company fundedCapital – Shaktiengine070.16 15.52 Company fundedDRE - ALH 408.80 177.41 Company fundedDRE – Shaktiengine029.25 17.19 Company fundedTotal 767.46 386.64Civil version <strong>of</strong>ALHWSI – ShaktiEngine89.31 89.17 Company funded110.05 104.62 Initially to be fundedby Company and lateron to be recoveredduring productionphase.Total 966.82 580.43 Company funded169
Report No. 10 <strong>of</strong> 2010-11<strong>Annexure</strong> – VII(Referred to in paragraph no.3.7.1.1)Major milestones <strong>of</strong> helicopter development programme1. Specification <strong>of</strong> development target values2. Freeze <strong>of</strong> ALH basic configuration3. Definition <strong>of</strong> critical components4. Release <strong>of</strong> long lead items (LLITS) <strong>for</strong> prototype5. Lay down <strong>of</strong> test programmes and test procedures6. Design freeze <strong>of</strong> PT17. GTV operational8. PR1 roll out9. PT2/PT3 first flight10. Design freeze <strong>of</strong> production version11. PT4 first flight12. Acceptance <strong>of</strong> per<strong>for</strong>mance data13. PT delivery to Indian Armed Forces text centre170
Report No. 10 <strong>of</strong> 2010-11YearNo.ALHsold<strong>Annexure</strong>-VIII(Referred to in paragraph no.3.7.3)Statement showing <strong>the</strong> working <strong>of</strong> pr<strong>of</strong>itability <strong>of</strong> ALH-Defence and Civil customersSale valueMaterialcostLabour cost O<strong>the</strong>r costs Total cost Materialcost perunitLabourcost perunitO<strong>the</strong>rcosts perunit(Rs. in crore)Total Pr<strong>of</strong>it/Lossunit costperTotal ALH2004-05 12 437.71 36.48 281.56 44.25 32.85 358.66 23.46 3.69 2.74 29.892 55.20 27.60 46.93 7.38 5.48 59.79 23.46 3.69 2.74 29.8914 492.91 35.21 328.49 51.63 38.33 418.45 23.46 3.69 2.74 29.89 5.322005-06 11 378.08 34.37 261.58 49.83 36.19 347.60 23.78 4.53 3.29 31.602 64.00 32.00 47.56 9.06 6.58 63.20 23.78 4.53 3.29 31.6013 442.08 34.01 309.14 58.89 42.77 410.80 23.78 4.53 3.29 31.60 2.412006-07 10 368.55 36.86 225.67 41.23 28.30 295.20 22.57 4.12 2.83 29.52 7.342007-08 9 309.60 34.40 170.73 90.78 32.92 294.43 18.97 10.09 3.66 32.721 25.50 25.50 18.97 10.09 3.66 32.72 18.97 10.09 3.66 32.7210 335.10 33.51 189.70 100.87 36.58 327.15 18.97 10.09 3.66 32.72 0.792008-09 3 106.34 35.45 59.28 26.66 15.82 101.76 19.76 8.89 5.27 33.9211 364.94 33.18 217.34 97.74 57.99 373.07 19.76 8.89 5.27 33.9214 471.28 33.66 276.62 124.40 73.81 474.83 19.76 8.89 5.27 33.92 -0.26171
Report No. 10 <strong>of</strong> 2010-11Customer/year o<strong>for</strong>derONGCLimited(April 2005)Govt. <strong>of</strong>Jharkahand(February2005)RoyalNepaleseArmy (Jan2003)Ecuador AirForce (April2008)OrderedNos.<strong>Annexure</strong>-IX(Referred to in paragraph no.3.7.5.2)SuppliedNosOrderValueAppx-(Rs.crore)Remarks3 2 111 Third ALH was not accepted by ONGC.Reasons not on record. Subsequently, itwas supplied to Ministry <strong>of</strong> HomeAffairs resulting in locking up Rs.30.49crore <strong>for</strong> two years. Fur<strong>the</strong>r due to nonprovisionin <strong>the</strong> contract with ONGC <strong>for</strong>recovery <strong>of</strong> operation and maintenancecharges during <strong>the</strong> period <strong>of</strong> nonutilisation <strong>of</strong> <strong>the</strong> ALH due to snags, <strong>the</strong>Company could not recover from ONGCRs.2.17 crore it had paid to <strong>the</strong> serviceprovider.2 1 62 Due to delay <strong>of</strong> two years in supply <strong>of</strong>first ALH <strong>the</strong> order <strong>for</strong> <strong>the</strong> second ALHwas cancelled.2 2 76 One ALH delivered met with an accident(October 2004) due to failure <strong>of</strong> Tailrotor control tube resulting in Companyabsorbing repair/replacement cost <strong>of</strong>Rs.9.17crore.7 5 254 One ALH crash landed in October 2009.Supply <strong>of</strong> balance ALH pendingoutcome <strong>of</strong> <strong>the</strong> enquiry report <strong>of</strong> crash.172
Report No. 10 <strong>of</strong> 2010-11<strong>Annexure</strong> X(Referred to in paragraph no.5.5)<strong>Sampling</strong><strong>Sampling</strong> <strong>techniques</strong> <strong>used</strong> <strong>for</strong> <strong>selection</strong> <strong>of</strong> <strong>the</strong> <strong>units</strong> and dataThe per<strong>for</strong>mance audit was conducted as a horizontal study across <strong>the</strong> four PSU insurersviz., NIA, NIC, OIC and UIIC with corporate <strong>of</strong>fices at Mumbai, Kolkata, New Delhiand Chennai. The following methodology was adopted <strong>for</strong> <strong>selection</strong> <strong>of</strong> <strong>units</strong> and sample<strong>selection</strong> <strong>of</strong> policies underwritten <strong>for</strong> test audit.1. Two Regional Offices (ROs) <strong>for</strong> each PSU insurer under each zone were selectedon <strong>the</strong> basis <strong>of</strong> claims incurred during <strong>the</strong> last three years. The selected ROsrepresented 68 per cent, 75 per cent, 51 per cent and 79 per cent <strong>of</strong> <strong>the</strong> premiumcollected by NIA, NIC, OIC and UIIC respectively.2. Out <strong>of</strong> total 95 ROs <strong>of</strong> <strong>the</strong> four PSU insurers 32 ROs were selected <strong>for</strong> detailedaudit. The ROs in metro cities with high density <strong>of</strong> health policies and high claimratio were selected. Two DOs under each selected RO were selected byrespective <strong>of</strong>fice <strong>of</strong> <strong>the</strong> Principal Director <strong>of</strong> Commercial Audit & ex-<strong>of</strong>ficioMember Audit Board at Mumbai, Kolkata, New Delhi and Chennai and one BOunder each DO was selected by <strong>the</strong> audit party on judgmental basis. Thus, 32ROs, 64 DOs and 64 BOs were visited during <strong>the</strong> per<strong>for</strong>mance audit.3. 100 per cent analysis <strong>of</strong> <strong>the</strong> data furnished by <strong>the</strong> TPAs in respect <strong>of</strong> issue <strong>of</strong>identity cards, cashless settlement, reimbursement claims and claims settlementwas done using IDEA so as to evaluate <strong>the</strong> per<strong>for</strong>mance <strong>of</strong> <strong>the</strong> Third PartyAdministrators.4. Structured Query Language (SQL) was <strong>used</strong> <strong>for</strong> data analysis in respect <strong>of</strong>individual mediclaim policies.5. In respect <strong>of</strong> underwriting, out <strong>of</strong> <strong>the</strong> 3882 TMGPs issued by <strong>the</strong> selectedDivisional <strong>of</strong>fices/Branch <strong>of</strong>fices, 701 policies were selected using appropriatesampling <strong>techniques</strong> <strong>for</strong> test check. Details <strong>of</strong> cases selected are given below:PSU insurer No. <strong>of</strong> TMGPs issued No <strong>of</strong> TMGP selectedNIA 2534 254NIC 600 135OIC 507 172UIIC 241 140Total 3882 701173
Report No. 10 <strong>of</strong> 2010-11<strong>Annexure</strong> XI(Referred to in paragraph no.5.7.1.3)Corporate Clients <strong>of</strong> PSU InsurersSl.No. Year Insurer Insured Premium Claim ICR1. 2007-08 OIC ALCATEL 63,000,000 49,100,000 77.942. 2008-09 OIC ALCATEL 64,200,000 49,800,000 77.573. 2007-08 OIC AMAR RAJA BATTERIES 3,278,000 1,131,000 34.504. 2008-09 OIC AMAR RAJA BATTERIES 5,145,000 5,174,000 100.565. 2006-07 NIC ANZ Operations & Tech. 13,873,006 9,175,523 66.146. 2007-08 NIC ANZ Operations & Tech. 10,538,650 17,962,918 170.457. 2006-07 NIC ASIAN PAINTS 12,600,000 25,500,000 202.388. 2007-08 NIC ASIAN PAINTS 11,700,000 13,800,000 117.959. 2008-09 NIC ASIAN PAINTS 16,300,000 19,700,000 120.8610. 2007-08 OIC BLUE STAR 8,800,000 8,100,000 92.0511. 2008-09 OIC BLUE STAR 9,600,000 11,100,000 115.6312. 2006-07 NIC Caterpillar 7,571,350 6,934,206 91.5813. 2006-07 NIC Caterpillar 21,505,839 41,809,591 194.4114. 2007-08 NIC Caterpillar 2,381,490 2,873,192 120.6515. 2007-08 NIC Caterpillar 2,803,489 5,152,482 183.7916. 2008-09 NIC Caterpillar 5,766,367 1,213,414 21.0417. 2008-09 NIC Caterpillar 19,616,472 20,061,204 102.2718. 2006-07 OIC CTS 83,200,000 121,600,000 146.1519. 2007-08 OIC CTS 187,800,000 182,000,000 96.9120. 2008-09 OIC CTS 193,400,000 230,000,000 118.9221. 2007-08 OIC DHL 4,500,000 6,100,000 135.5622. 2006-07 OIC DQ ENTERTAINMENT 2,207,000 3,611,000 163.6223. 2007-08 OIC DQ ENTERTAINMENT 4,545,000 7,868,000 173.1124. 2006-07 NIC EXIM BANK 5,200,000 4,500,000 86.5425. 2007-08 NIC EXIM BANK 4,800,000 5,600,000 116.6726. 2008-09 NIC EXIM BANK 8,400,000 6,800,000 80.9527. 2006-07 NIC First Indian Corpn. 10,642,840 11,012,061 103.4728. 2008-09 NIC First Indian Corpn. 14,561,045 9,657,419 66.3229. 2006-07 NIA HDFC 114,600,000 95,100,000 82.9830. 2007-08 NIA HDFC 230,300,000 179,600,000 77.9931. 2006-07 NIA HPCL 518,600,000 365,900,000 70.5632. 2007-08 NIA HPCL 504,800,000 428,800,000 84.9433. 2006-07 NIC I I T, Chennai 1,591,659 2,705,615 169.9934. 2007-08 NIC Inautix Tech. 14,513,462 15,017,602 103.4735. 2008-09 NIC Inautix Tech. 12,759,544 7,612,012 59.6636. 2006-07 NIC Indian Instt <strong>of</strong> Tech 4,040,143 9,218,820 228.1837. 2006-07 NIC Indian Instt <strong>of</strong> Tech 1,972,220 4,658,044 236.1838. 2008-09 OIC INFOR GLOBAL 4,759,000 6,713,000 141.0639. 2006-07 OIC INFOR GLOBAL SOLUTIONS 7,754,000 7,161,000 92.35174
Report No. 10 <strong>of</strong> 2010-1140. 2007-08 OIC INFOR GLOBAL SOLUTIONS 6,631,000 4,842,000 73.0241. 2006-07 NIC Infosys 80,434,824 132,518,227 164.7542. 2007-08 NIC Infosys 136,292,332 141,706,283 103.9743. 2008-09 NIC Infosys 142,303,196 100,834,954 70.8644. 2007-08 NIC Infosys - dependants 19,529,812 23,950,708 122.6445. 2008-09 NIC Infosys - dependants 24,850,308 16,677,283 67.1146. 2007-08 NIC Infosys BPO 26,013,514 19,532,866 75.0947. 2008-09 NIC Infosys BPO 8,139,315 16,085,655 197.6348. 2006-07 NIC INTEGRAN MANAGERD 2,100,000 200,000 9.5249. 2006-07 OIC INTERGRAPH CONSULTING 1,858,000 1,999,000 107.5950. 2008-09 OIC Invensys Dev Centre India Pvt Ltd 5,339,000 7,742,000 145.0151. 2008-09 OIC ITC INFOTECH LTD 8,989,000 10,326,000 114.8752. 2006-07 NIC JAIN IRRIGATION 3,500,000 3,600,000 102.8653. 2007-08 NIC JAIN IRRIGATION 6,800,000 11,600,000 170.5954. 2008-09 NIC JAIN IRRIGATION 11,400,000 14,000,000 122.8155. 2006-07 OIC JET AIRWAYS 21,300,000 72,000,000 338.0356. 2007-08 OIC JET AIRWAYS 39,500,000 72,600,000 183.8057. 2008-09 OIC JET AIRWAYS 90,000,000 110,400,000 122.6758. 2006-07 NIC KEOMI TRAVELS 3,400,000 7,300,000 214.7159. 2007-08 NIC KEOMI TRAVELS 3,400,000 8,800,000 258.8260. 2006-07 NIC KOLKATA MUNICIPAL CORP 19,447,000 49,194,000 252.9661. 2007-08 NIC KOLKATA MUNICIPAL CORP 19,447,000 24,567,000 126.3362. 2008-09 NIC KOLKATA MUNICIPAL CORP 19,447,000 24,567,000 126.3363. 2006-07 NIC KOLKATA POLICE FORCE 27,016,000 49,939,000 184.8564. 2007-08 NIC KOLKATA POLICE FORCE 37,363,000 49,490,000 132.4665. 2008-09 NIC KOLKATA POLICE FORCE 32,962,000 27,327,000 82.9066. 2006-07 NIA LIC 437,100,000 747,200,000 170.9467. 2007-08 NIA LIC 711,500,000 792,200,000 111.3468. 2006-07 NIA LIC AGENTS 28,200,000 31,900,000 113.1269. 2007-08 NIA LIC AGENTS 27,200,000 21,200,000 77.9470. 2008-09 NIA LIC AGENTS 41,800,000 60,700,000 145.2271. 2006-07 UIIC M/s. Bharat Electronics Ltd. Corporate <strong>of</strong>fice 31,357,037 40,370,720 128.7572. 2007-08 UIIC M/s. Bharat Electronics Ltd. Corporate Office 37,827,214 38,737,475 102.4173. 2006-07 UIIC M/s. Bharat Electronics Ltd. Jalahalli 17,408,000 36,928,357 212.1374. 2007-08 UIIC M/s. Bharat Electronics Ltd. Jalahalli 17,405,860 22,589,092 129.7875. 2006-07 UIIC M/s. Corporate Infrastructure Services 6,874,094 14,000,932 203.6876. 2007-08 UIIC M/s. Corporate Infrastructure Services 16,224,612 27,934,618 172.1777. 2006-07 UIIC M/s. Delphi TVS Diesel Systems Limited 4,103,729 2,793,596 68.0778. 2007-08 UIIC M/s. Delphi TVS Diesel Systems Limited 3,790,819 3,267,340 86.1979. 2008-09 UIIC M/s. Delphi TVS Diesel Systems Limited 4,163,375 3,791,039 91.0680. 2006-07 UIIC M/s. Goldman Sachman 14,909,926 18,117,933 121.5281. 2007-08 UIIC M/s. Goldman Sachman 18,975,896 31,346,466 165.1982. 2008-09 UIIC M/s. Goldman Sachman 35,329,156 23,526,352 66.5983. 2006-07 UIIC M/s. Hewlett Packard-Employees 56,514,968 73,258,786 129.6384. 2007-08 UIIC M/s. Hewlett Packard-Employees 83,412,670 118,746,089 142.3685. 2006-07 UIIC M/s. Hewlett Packard-Parents 50,313,919 92,304,217 183.4686. 2007-08 UIIC M/s. Hewlett Packard-Parents 102,490,085 124,622,384 121.59175
Report No. 10 <strong>of</strong> 2010-1187. 2006-07 UIIC M/s. IBM India Limited-Employees 113,459,776 116,548,706 102.7288. 2007-08 UIIC M/s. IBM India Limited-Employees 133,583,004 175,025,989 131.0289. 2008-09 UIIC M/s. IBM India Limited-Employees 174,342,829 219,786,549 126.0790. 2006-07 UIIC M/s. IBM India Limited-Parents 189,318,864 194,293,397 102.6391. 2007-08 UIIC M/s. IBM India Limited-Parents 235,422,557 292,533,054 124.2692. 2008-09 UIIC M/s. IBM India Limited-Parents 298,120,539 360,988,177 121.0993. 2006-07 UIIC M/s. J & B S<strong>of</strong>tware India Pvt. Ltd. 1,373,837 1,919,046 139.6994. 2007-08 UIIC M/s. J & B S<strong>of</strong>tware India Pvt. Ltd. 1,749,511 1,945,796 111.2295. 2006-07 UIIC M/s. Lucas TVS Ltd. Padi 18,745,608 18,423,926 98.2896. 2007-08 UIIC M/s. Lucas TVS Ltd. Padi 10,706,241 19,089,187 178.3097. 2008-09 UIIC M/s. Lucas TVS Ltd. Padi 17,272,570 19,574,273 113.3398. 2006-07 UIIC M/s. MRF Employees Union 3,459,136 3,921,365 113.3699. 2006-07 UIIC M/s. MRF Ltd. 1,788,654 6,380,284 356.71100. 2007-08 UIIC M/s. MRF Ltd. 4,513,323 8,281,562 183.49101. 2008-09 UIIC M/s. MRF Ltd. 4,388,640 9,263,228 211.07102. 2006-07 UIIC M/s. Sundaram Fasteners 3,424,692 2,527,069 73.79103. 2007-08 UIIC M/s. Sundaram Fasteners 4,072,162 4,832,412 118.67104. 2008-09 UIIC M/s. Sundaram Fasteners 4,512,844 5,484,107 121.52105. 2006-07 UIIC M/s. Technical Stampings 1,144,031 1,390,934 121.58106. 2007-08 UIIC M/s. Technical Stampings 1,222,803 2,326,898 190.29107. 2006-07 NIC MAGMA 3,492,000 9,449,000 270.59108. 2007-08 NIC MAGMA 6,494,000 14,548,000 224.02109. 2008-09 NIC MAGMA 7,498,000 0 0.00110. 2006-07 OIC MATRIX LAB 5,264,000 13,200,000 250.76111. 2007-08 OIC MATRIX LAB 10,700,000 8,900,000 83.18112. 2008-09 OIC MATRIX LAB 16,603,000 21,858,000 131.65113. 2007-08 NIC Neyveli Lignite 117,978,000 70,779,085 59.99114. 2008-09 NIC Neyveli Lignite 110,112,800 25,269,898 22.95115. 2006-07 NIA NIC MEDICLAIM STAFF 10,900,000 16,900,000 155.05116. 2007-08 NIA NIC MEDICLAIM STAFF 10,900,000 17,000,000 155.96117. 2008-09 OIC ORCHID CHEMICALS 11,400,000 21,100,000 185.09118. 2006-07 NIA PANCARD CLUBS 67,200,000 51,700,000 76.93119. 2007-08 NIA PANCARD CLUBS 88,500,000 46,900,000 52.99120. 2007-08 NIC PANTALOON 22,100,000 31,700,000 143.44121. 2008-09 NIC PANTALOON 24,500,000 27,800,000 113.47122. 2008-09 NIC PARSI GROUP 1,200,000 5,200,000 433.33123. 2008-09 UIIC PARSI RESOURCE 1,200,000 5,200,000 433.33124. 2006-07 NIC RALLIS 1,900,000 2,900,000 152.63125. 2007-08 NIC RALLIS 1,600,000 5,200,000 325.00126. 2006-07 OIC RIL 35,800,000 113,600,000 317.32127. 2007-08 OIC RIL 54,700,000 134,000,000 244.97128. 2008-09 OIC RIL 146,400,000 156,000,000 106.56129. 2006-07 NIC SAP India 7,881,680 11,347,551 143.97130. 2007-08 NIC SAP Labs 21,189,883 30,492,592 143.90131. 2006-07 OIC SHANTA BIOTECHNICS 2,766,000 1,606,000 58.06132. 2007-08 OIC SHANTA BIOTECHNICS 3,944,000 2,761,000 70.01133. 2006-07 NIC SREI INFRASTRUCTURE 1,565,000 4,723,000 301.79176
Report No. 10 <strong>of</strong> 2010-11134. 2007-08 NIC SREI INFRASTRUCTURE 2,752,000 3,952,000 143.60135. 2008-09 NIC SREI INFRASTRUCTURE 3,801,000 5,711,000 150.25136. 2007-08 NIC SRF Ltd 2,137,904 2,434,939 113.89137. 2008-09 NIC SRF Ltd 2,851,772 1,240,442 43.50138. 2006-07 OIC SYNTEL 9,900,000 18,100,000 182.83139. 2007-08 OIC SYNTEL 11,100,000 20,600,000 185.59140. 2008-09 OIC SYNTEL 11,300,000 3,300,000 29.20141. 2006-07 NIA TATA MOTORS 26,400,000 34,600,000 131.06142. 2007-08 NIA TATA MOTORS 35,500,000 29,600,000 83.38143. 2008-09 NIA TATA MOTORS 25,100,000 23,400,000 93.23144. 2006-07 NIA TATA POWER 20,000,000 35,000,000 175.00145. 2007-08 NIA TATA POWER 25,000,000 40,000,000 160.00146. 2006-07 NIA TCS 491,900,000 640,300,000 130.17147. 2007-08 NIA TCS 791,200,000 991,600,000 125.33148. 2006-07 NIC Texas tech. 8,735,073 14,338,202 164.15149. 2008-09 NIC Texas tech. 14,747,173 14,701,535 99.69150. 2008-09 OIC TN GOVT EMP SCHEME 84,100,000 112,400,000 133.65151. 2006-07 OIC UIIC STAFF MEDICLAIM 128,500,000 215,500,000 167.70152. 2007-08 OIC UIIC STAFF MEDICLAIM 115,900,000 216,600,000 186.89153. 2008-09 OIC UIIC STAFF MEDICLAIM 134,900,000 245,100,000 181.69154. 2006-07 NIA VSNL 27,200,000 33,200,000 122.06155. 2007-08 NIA VSNL 42,300,000 44,700,000 105.67156. 2008-09 NIA VSNL 51,000,000 60,700,000 119.02157. 2006-07 NIC WEST BENGAL FINANCE CORP 727,000 844,000 116.09158. 2007-08 NIC WEST BENGAL FINANCE CORP 856,000 966,000 112.85159. 2008-09 NIC WEST BENGAL FINANCE CORP 1,251,000 905,000 72.34177
Report No. 10 <strong>of</strong> 2010-11<strong>Annexure</strong> XII(Referred to in paragraph no.5.7.1..4)PSUInsurerPremium <strong>for</strong>egone due to non-compliance with guidelines(Rs. in crore)Malus* O<strong>the</strong>r criteria**YearNo. <strong>of</strong>casestestchecked.No. <strong>of</strong>caseswithshortloadingAmount No. <strong>of</strong>caseswithshortloadingAmountTotal2006-07 31 6 9.74 2 0.15 9.89NIC 2007-08 32 17 28.32 0 0.00 28.322008-09 72 10 24.17 1 1.55 25.72Total 135 33 62.23 3 1.70 63.932006-07 57 14 2.79 21 1.83 4.62NIA 2007-08 97 17 4.84 44 5.60 10.442008-09 100 16 10.54 45 9.97 20.52Total 254 47 18.17 110 17.40 35.582006-07 27 6 2.28 2 0.12 2.40OIC 2007-08 35 8 6.49 8 0.84 7.332008-09 110 17 6.68 7 2.92 9.60Total 172 31 15.45 17 3.88 19.332006-07 42 35 21.23 35 35.32 56.55UIIC2007-08 45 42 47.26 42 38.57 85.832008-09 53 45 36.05 45 32.42 68.47Total 140 122 104.54 122 106.31 210.85Grand Total 701 233 200.39 252 129.29 329.68* Malus loading premium <strong>for</strong>egone is worked out based on <strong>the</strong> incurred claim ratio <strong>of</strong> <strong>the</strong>previous policy period and in accordance with <strong>the</strong> guidelines issued by <strong>the</strong> respectivePSU insurer.** O<strong>the</strong>r criteria like loading <strong>for</strong> pre-existing diseases, maternity, family floater,corporate buffer premium <strong>for</strong>egone was worked out in accordance with <strong>the</strong> guidelines <strong>of</strong>respective PSU insurer.178
Report No. 10 <strong>of</strong> 2010-11<strong>Annexure</strong> XIII(Referred to in paragraph no.5.7.6.3)Variation in <strong>the</strong> claims paid <strong>for</strong> <strong>the</strong> same disease(in Rupees)PSU Insurer 2006-07 2007-08 2008-09DISEASE – CATARACTRO/TPA Min Max Min Max Min MaxChennai ROTTK 10000 50188 10000 53866 10000 69458NIC FHP 10000 63713 10000 98000 10000 98000Bengaluru ROTTK 10050 50000 10030 133391 10013 115395Mediassist 10000 50000 10000 100200 10000 74374Chennai ROFHP 10210 29509 10095 90575 11884 41700Medicare 10137 60000 10222 65024 11604 56053OICHyderabad ROTTK 10000 37600 10000 44700 10500 40511FHP 11086 50706 10000 29557 13225 41536Kolkata ROMedicare 5928 51821 5932 34200 8800 29450Heritage 5642 30500 7304 51427 7289 90707Bangalore ROGenins 10483 22000 10000 22000 10000 36000Mediassist 10132 91659 10000 85140 10000 155000Medsave 10000 39014 10000 55000 10000 25425UIIC Paramount 10199 58822 12607 25595 13452 25000Chennai ROMedicare 14940 17140 15150 19580 18436 18436Medsave 10000 37810 10000 54000 10000 60000Paramount 10002 30000 10070 27000 11963 11963NIA Chennai ROTTK 10000 78500 10000 139674 10000 66929179
Report No. 10 <strong>of</strong> 2010-11MD India 12600 44100 10000 54270Medi Assist 0 0 10589 45000 10000 61000Hyderabad ROAlankit 0 0 0 0 11000 64857FHPL 10400 49055 10000 58500 10605 45000GHPL 10000 60000 11720 131100 10000 72800MD India 15000 32000 26550 65000 10800 120000DISEASE – APPENDICITISChennai ROTTK 11288 62861 10000 74912 10000 100044NIC FHP 12670 73672 12000 68190 10588 105856Bengaluru ROTTK 11258 94718 10500 113837 10555 72939Hyderabad ROFHPL 11530 55000 15273 66173 11148 72185NIA GHPL 27124 73500 20742 109762 21729 72523Chennai ROMedsave 10765 69886 13710 200000 10000 85013UIICBangalore ROParamount 10432 30963 11396 46444 10163 38787Medsave 11060 54292 23620 28750 12075 40296Genins 14100 32197 16181 50000 14319 75273180
Report No. 10 <strong>of</strong> 2010-11<strong>Annexure</strong>-XIV(Referred to in paragraph no. 6.1)Organization Chart <strong>of</strong> BHEL181
Report No. 10 <strong>of</strong> 2010-11<strong>Annexure</strong>-XV(Referred to in paragraph no. 6.2)Selected <strong>units</strong> and its functionsUnits/Division,LocationMainFunctions/ActivitiesMajor ProductsProcuredProducts Selectedunder AuditHeavy PowerEquipmentPlant,HyderabadManufacture <strong>of</strong> industrialand utility TurboGenerators i.e. GasTurbines, Steam Turbines,Compressors & associatedequipment like Heaters,Dearators, HeatExchangers, Pumps, BowlMills, Switchgears, OilDrilling Rigs etc.Rotor <strong>for</strong>ging, Nickel,Stainless Steel U-Tubes ,Frame 9E Flange toFlange Machines,Hydraulic Couplings,Pump Casing, BevelPlanetary Gear BoxesLiner and Pads, Casings& Forgings.Rotor <strong>for</strong>ging, Nickel,Stainless Steel U-Tubes, Frame 9EFlange to FlangeMachines, HydraulicCouplings, PumpCasing, BevelPlanetary Gear BoxesLiner and Pads,Casings & Forgings.High PressureBoiler Plant,TrichyManufacture <strong>of</strong> SteamGenerators<strong>for</strong>utilities/industries viz.Heat Recovery SteamGenerators behind GasTurbines, Fluidized BedCombustion Boilers,Valves, Fittings & SootBlowers, High PressurePiping System, NuclearSteam Generators,Seamless Steel Tubes etc.Carbon Steel tubes,Boiler water circulatingpumps, Alloys SteelPlates, Boiler qualityplates, Pipes , StructuralSteel Beams, Channelsand Seamless Pipes.Carbon Steel tubes,Boiler water circulatingpumps, Alloys SteelPlates, Boiler qualityplates, Pipes, StructuralSteel Beams, Channelsand Seamless Pipes.HeavyElectricalPlant, BhopalManufacture <strong>of</strong> HeavyElectrical equipments viz.Hydro, Steam, Marine &Nuclear Turbines, HeatExchangers, Hydro &Turbo Generators,Trans<strong>for</strong>mers,Switchgears, Controlgears, TransportationEquipment, Capacitors,Bushings, ElectricalMotors, Rectifiers, OilDrilling Rig Equipmentsand Diesel Generatingsets.Steel, Copper, Castings,Forgings, Cranes, GuideVane, Cables, Bearings,Magnet Frame, LeadWire Assembly,Commutator Bar Blank,Flange Barrel Assy,Suspension Tube, ENDShield PE Casting, LEcasting etcSteel, Copper,Castings, Forgings,Cranes, Guide Vane,Cables, Bearings,Magnet Frame, LeadWire Assembly,Commutator BarBlank, Flange BarrelAssy, SuspensionTube, END Shield PECasting, LE casting etc182
Report No. 10 <strong>of</strong> 2010-11HeavyElectricalEquipmentPlant, HaridwarManufacture <strong>of</strong> ElectricalMachines, Industrialcontrols panels, TurboGenerators, Hydro Sets,Steam Turbine,Condenser, Super RapidGun Mount, & GasTurbine.Rotors (Low Pressure,High Pressure &Intermediate Pressure),Outer Casing (HighPressure & IntermediatePressure), Inner Casings(High Pressure &Intermediate Pressure),Moving Blades, TurboGenerator, DamperWedge & Carbon SteelPlates.Rotors (Low Pressure ,High Pressure &Intermediate Pressure),Outer Casing (HighPressure&Intermediate Pressure),Inner Casings (HighPressure&Intermediate Pressure),Moving Blades, TurboGenerator, DamperWedge &Carbon SteelPlatesBoilerAuxiliariesPlant, RanipetManufacture <strong>of</strong> ESPs,Fans and Air Pre Heaters,Defence Systems, Gates &Dampers, SpaceApplications, DesalinationPlants, Wind ElectricGenerators, Ash & Coalhandling SystemsECHVR, SS Wire,Plates, Sheets, Angles,Beams, Channels, CRCoils, Panel TypeHopper Heater.ECHVR, SS Wire,Plates, Sheets, Angles,Beams, Channels, CRCoils, Panel TypeHopper Heater.Power Sectors–Sou<strong>the</strong>rn andWesternRegion,Chennai,NagpurInstallation andCommissioning <strong>of</strong> PowerPlants-Thermal, Hydro,Nuclear & Gas,Renovation&Modernization <strong>of</strong> PowerPlants, Service after Sales.Cement, Steel, Cranesand Capital items <strong>of</strong>customer relatedprojects.Cement, Steel, Cranesand Capital items <strong>of</strong>customer relatedprojects.ProjectEngineeringManagement,NoidaProject EngineeringManagement (PEM),procured Balance <strong>of</strong> PlantEquipments <strong>for</strong> BHEL'sProjects. PEM also doing<strong>the</strong> Engineering's works<strong>for</strong> projects.Condensate PolishingUnit, Cooling Tower,Lime Stone HandlingSystem, Oxygen DosingSystem, Power StationCabling, Station LightingSystem, LV Switchgearsand DM PlantsCondensate PolishingUnit, Cooling Tower,Lime Stone HandlingSystem, OxygenDosing System, PowerStation Cabling,Station LightingSystem,LVSwitchgears and DMPlantsTransmissionBusinessGroup, DelhiTransmission BusinessGroup, procured Balance<strong>of</strong> Plant Equipments <strong>for</strong>Transmission Businessand Power Projects.G.I Structures, LT/ HTcables, Control & RelayPanel , Circuit Breakers,Steel, Clamp &Connectors , PLCCequipments & DG Sets.G.I Structures, LT/ HTcables, Control &Relay Panel, CircuitBreakers, Steel, Clamp& Connectors, PLCCequipments & DG Sets.183
Report No. 10 <strong>of</strong> 2010-11Name <strong>of</strong> <strong>the</strong>unitTrichyHyderabadHaridwarBhopalPEM, NoidaTBG,DelhiBAPRanipetPSSRChennaiPSWRNagpurTotalNewTotal No.<strong>of</strong>PurchaseOrders<strong>Annexure</strong>-XVI(Referred to in paragraph no.6.2)Unit-wise details <strong>of</strong> Selected Sample(Amount: Rupees in crore)Total Value<strong>of</strong> PurchaseOrdersSelectedNo. <strong>of</strong>PurchaseOrdersValue <strong>of</strong>SelectedPurchaseOrdersPercentage <strong>of</strong>selected valueto total value<strong>of</strong> PurchaseOrders37513 11793 170 3941 3329589 8679 186 2865 3316643 7961 151 2484 3144227 5031 806 2091 422592 2526 85 848 341614 749 90 218 297766 3102 394 1313 42783 780 75 521 67298 149 85 141 95141025 40770 2042 14422 35184
Report No. 10 <strong>of</strong> 2010-11<strong>Annexure</strong>-XVII(Referred to in paragraph no.6.6.4.2)Limited Vendor BaseUnit Product No. <strong>of</strong> VendorsHyderabad 429 material categories 2Bhopal 476 material categories 2Haridwar 411 material categories 2Trichy 37 material categories 2PEM 12 material categories 2Hyderabad 390 material categories 3PEM 15 material categories 3Trichy 98 material categories 3Haridwar 402 material categories 3185
Report No. 10 <strong>of</strong> 2010-11<strong>Annexure</strong>-XVIII(Referred to in paragraph no.6.6.4.5)Statement Showing Details <strong>of</strong> Orders to Banned PartiesJob_No Project Name Po No Po Date Package Vendor PO Value226 Lehra Mohabbat -2x250 Mw234 Amarkantak Tps1x210mw234 Amarkantak Tps1x210mwP-94/06 22-May-2006 temp-COLTCS Gea BgrEnergy SystemIndia Ltd.P-146/06 11-Jul-2006 Fuel Oil HandlingAnd StorageSystemP-147/06 11-Jul-2006 Fuel Oil HandlingAnd StorageSystem-E&C1,86,00,000Techno Electric 3,27,25,000And Engg. Co.Ltd.Techno Electric42,24,517And Engg. Co.Ltd.Sub total 5,55,49,517281 Sikka TPSExtension Units 3 &4, 2x270MW280 Koderma TPS Stage- I Unit 1 & 2280 Koderma TPS Stage- I Unit 1 & 2266 Budge BudgeGeneratingStn,1X250MWUnit3279 Rayalseema TPPStage III, UNIT 5277 Santaldih1X250MW Unit-6260 PARICHA EXTN2x250MW,Unit-5&6262 2X250MWHarduaganj TPSExpansion269 DADRI 1X490MWSTAGE II / Unit-2NCTPP248 BARSINGSAR-2x125 MW, NLC244 Neyveli TPS IIexpansion - 2x250MW239 BHILAI PROJECT2x250 MW214 KORBA (EAST)TPS 2X250 MWName <strong>of</strong> sister concern <strong>of</strong> GEA namely (GEA ECOFLEX INDIA PVT LTD)Date <strong>of</strong>issueenquiry13.03.200813.03.200801.12.200704.12.2007P-183/08 03-Jul-2008 HeatExchangers(PlateType)P-172/08 30-Jun-2008 HeatExchangers(PlateType)P-176/08 30-Jun-2008 HeatExchangers(PlateType)P-84/08 26-May-2008 HeatExchangers(PlateType)P-85/08 26-May-2008 HeatExchangers(PlateType)P-44/08 13-May-2008 HeatExchangers(PlateType)P-325/07 11-Sep-2007 HeatExchangers(PlateType)P-326/07 11-Sep-2007 HeatExchangers(PlateType)P-329/07 11-Sep-2007 HeatExchangers(PlateType)P-319/07 10-Sep-2007 HeatExchangers(PlateType)P-320/07 10-Sep-2007 HeatExchangers(PlateType)P-337/06 10-Oct-2006 HeatExchangers(PlateType)P-25/06 25-Apr-2006 HeatExchangers(PlateType)3,56,51,8073,04,96,38126,50,31575,11,93388,04,4511,38,60,0001,47,40,0011,47,40,0011,20,00,0011,90,10,0021,74,50,0001,92,61,6311,62,75,423Sub Total 21,24,51,946Grand Total(Rs.)26,80,01,463186
Report No. 10 <strong>of</strong> 2010-11<strong>Annexure</strong>-XIX(Referred to in paragraph no. 6.6.5.2)Details <strong>of</strong> Extra Cost due to Delayed placement <strong>of</strong> OrdersUnitnamePO No./Project Material Audit observations Management’s reply & fur<strong>the</strong>r remarks Rs. inCroreHaridwar T8N6320 & 6321dated 29 July 2008IP ShaftForgingsNon placement <strong>of</strong> order within <strong>the</strong> validity <strong>of</strong> <strong>of</strong>fer, laterre-tendering and placement <strong>of</strong> order on same vendor insubsequent enquiry at revised negotiated price.The unit stated (June 2009) that approving authority deemed itsuitable to pursue <strong>the</strong> vendor to accept its own LPP. However, <strong>the</strong>ef<strong>for</strong>ts made were unsuccessful and <strong>the</strong> validity expired. The replyis not tenable as <strong>the</strong> validity period <strong>of</strong> <strong>the</strong> <strong>of</strong>fers should have kept in6.10Haridwar PO No. T7N 6436and 6437) and PI No.71/T/T212/7/1301N/1.IP Shaft(5 nos.)Hyderabad B708P035 Axial TurboBlowersHyderabad D308A016 Stainless SteelU-TubesApproval <strong>for</strong> AMA was given by <strong>the</strong> Corporate <strong>of</strong>fice inJune 2007 <strong>for</strong> procurement <strong>of</strong> IP Shaft but <strong>the</strong> enquirywas issued in August 2007 against <strong>the</strong> internal target <strong>of</strong>9 days.Due to delay in finalization <strong>of</strong> specification <strong>of</strong> materialand expiry <strong>of</strong> validity <strong>of</strong> bid, led to extra cost <strong>of</strong> Rs.4.47crore.Delay in placement <strong>of</strong> order within <strong>the</strong> validity period <strong>of</strong><strong>of</strong>fer. The enquiry was again re-issued (April 2008)Thus, due to failure to finalise <strong>the</strong> order within <strong>the</strong> initial<strong>of</strong>fer validity period <strong>the</strong> unit incurred an avoidable extraexpenditure <strong>of</strong> Rs 2.13 crore.mind while perusing <strong>the</strong> vendor.The unit stated (August 2009) that enquiry was issued late due tomanpower/ time constraints/ priority <strong>of</strong> jobs in hand. Reply is nottenable as enquiry was issued after 81 days from <strong>the</strong> date <strong>of</strong> receipt<strong>of</strong> indent which can not be justifiable.The unit stated (May 2009) that delay in finalisation <strong>of</strong>specification was due to time taken in reaching acceptablespecification. The reply is not acceptable as against <strong>the</strong>stipulated time <strong>of</strong> 75 days <strong>for</strong> conversion <strong>of</strong> indent to order,<strong>the</strong> time <strong>of</strong> six months taken <strong>for</strong> finalization <strong>of</strong> specificationsper se was not justified.The Management stated (January 2010) that though Indentswere raised by Engineering in <strong>the</strong> year 2007, <strong>the</strong> actualproduction / supply <strong>of</strong> Heaters were not planned in <strong>the</strong> samefinancial year due to so many <strong>of</strong>ficial reasons. Actualauthorization <strong>for</strong> processing <strong>the</strong> indents was received afterdiscussions by product Head and Head <strong>of</strong> MPC in January2008. .The reply is not acceptable as <strong>the</strong> due date <strong>for</strong>submission was extended upto 29-02-2008 from 19-02-08due to non receipt <strong>of</strong> bids. Vendor”s price . was was validupto 29-02-2008 only. The unit did not contact <strong>the</strong> vendorimmediately <strong>for</strong> extension <strong>of</strong> price validity. Subsequently, <strong>the</strong>vendor agreed <strong>for</strong> extension <strong>of</strong> validity subject to 9 per cent1.00 14.472.131 Financial impact has been worked out taking <strong>the</strong> mean <strong>of</strong> price <strong>of</strong>fers received in February 2007 and September 2007.187
Report No. 10 <strong>of</strong> 2010-11Ranipet Five POs CR coils The unit had not placed purchase order within time as aresult <strong>the</strong> Vendor did not accept <strong>the</strong> order. Later,purchases were made at rates higher by Rs. 5.57 crore.As a result Company incurred extra expenditure.increase in prices. Consequently, <strong>the</strong> tender was cancelledand revised bids were obtained which resulted in extraexpenditure.The unit stated (June 2009) that during <strong>the</strong> reverse auctionconducted on 19/02/2008, M/S ISPAT had signed <strong>the</strong> compliancereport confirming that <strong>the</strong> rates were valid till 30 days from auctiondate i.e., up to 20/03/2008 and hence <strong>the</strong> order was placed on04/03/2008, which was well within <strong>the</strong> validity period <strong>of</strong>20/03/2008.The reply is not acceptable since M/S ISPAT hadcategorically stated that <strong>the</strong>ir <strong>of</strong>fer was valid up to 29/02/2008.There<strong>for</strong>e, though <strong>the</strong> price was valid <strong>for</strong> execution up to 20/03/2008as confirmed by <strong>the</strong>m in <strong>the</strong> reverse auction, <strong>the</strong> purchase ordershould have been placed by <strong>the</strong> unit be<strong>for</strong>e 29/02/2008. TheCorporate Management, however, stated (January 2010) that o<strong>the</strong>rBHEL Units were advised to recover <strong>the</strong> extra financial implicationfrom any <strong>of</strong> <strong>the</strong> pending bills <strong>of</strong> M/s ISPAT Industries.5.57TBG No. 4588422,4588423 and4588424 dated 10thDecember 2008AirConditioningVentilationSystemPrice bid was not opened within validity date. Later onrevised price bid was submitted by <strong>the</strong> vendor which ledto extra expenditure.The. Management did not furnish any specific reply on <strong>the</strong> issueraised and stated (January 2010) that <strong>the</strong> specifications <strong>of</strong> packageswere dependant on finalization <strong>of</strong> layouts at site and finalization <strong>of</strong>relevant equipment. In order to expedite <strong>the</strong> procurementengineering releases advance indents with an estimated data, whichwill change, based on <strong>the</strong> actual site requirement and needs customerapproval. Hence <strong>the</strong>re was a delay in finalization <strong>of</strong> purchase orders.0.77 2TBGDelhiTBGDelhiNewNewPO No. 4568136dated 7 July 2006PO No. 4568072 &4568071LT Power andControl Cables<strong>for</strong>Chanderpuraand MejiaprojectClamp &Connector <strong>for</strong>DVC Projects,Technical evaluation <strong>of</strong> bids against indent <strong>of</strong> November2005 completed in March 2006 & <strong>of</strong>fers were valid upto 7 April 2006. Due to non-extension <strong>of</strong> bids validity,apparently due to rise in prices, order placed againstsnap price bids on M/s KEI Industries <strong>for</strong> value Rs. 7.30Crore, against Billing Break Up cost quoted to <strong>the</strong>customer Rs. 2.95 Crore, which lead to extraexpenditure <strong>of</strong> Rs.4.25 crore.Against indent <strong>of</strong> 14 July 2005 and tender enquiry <strong>of</strong> 28July 2005, technical evaluation sent on 5 December2005 was received after 110 days on 25 March 2006 andThe unit reply is silent on this issue. Management stated (January2010) that <strong>the</strong> specifications <strong>of</strong> packages were dependant onfinalization <strong>of</strong> layouts at site and finalization <strong>of</strong> relevant equipment.In order to expedite <strong>the</strong> procurement engineering releases advanceindents with an estimated data, which will change, based on <strong>the</strong>actual site requirement and needs customer approval. Hence <strong>the</strong>rewas a delay in finalization <strong>of</strong> purchase orders. Management repliesis not acceptable since <strong>the</strong> technical evaluation <strong>of</strong> bids against indent<strong>of</strong> November 2005 completed in March 2006 & <strong>of</strong>fers were valid upto 7 April 2006 .The unit noted <strong>the</strong> observation stating that technical evaluation wasreceived after 16 weeks with enhanced scope. The CorporateManagement stated (January 2010) that <strong>the</strong> specifications <strong>of</strong>4.25 30.712 The financial impact has been worked out with reference to first cost estimate.3 The financial impact has been worked out with reference to price quoted to <strong>the</strong> customer.188
Report No. 10 <strong>of</strong> 2010-11RanipetPO No 3170120 &3170119220 KV Substation,Chanderpuraand MejiaSpeed reducertype IIA andIIBbids were valid up to 4 April 2006. On requestingvendor to provide price <strong>of</strong> additional items, vendorsubmitted revised price bid valid up to 30 April 2006, asmetal prices were rising and order placed <strong>for</strong> value Rs.1.81 crore, whereas Billing Break Up Cost quoted to <strong>the</strong>customer was Rs. 1.10 crore.The Unit delayed <strong>the</strong> development <strong>of</strong> indigenous vendorand had to place order on <strong>the</strong> <strong>for</strong>eign vendor resulting inextra expenditure <strong>of</strong> Rs.1.35 crore.packages were dependant on finalization <strong>of</strong> layouts at site andfinalization <strong>of</strong> relevant equipment. In order to expedite <strong>the</strong>procurement engineering releases advance indents with an estimateddata, which will change, based on <strong>the</strong> actual site requirement andneeds customer approval. Hence <strong>the</strong>re was a delay in finalization <strong>of</strong>purchase orders.The unit stated (January 2010) that speed reducers were initially 1.35imported and subsequently two indigenous vendors have beendeveloped. It was also stated that being a critical item <strong>for</strong> <strong>the</strong>functioning <strong>of</strong> <strong>the</strong> air preheater, all precautions had to be takenbe<strong>for</strong>e indigenous sources were introduced.The fact remains that <strong>the</strong> unit started <strong>the</strong> process <strong>of</strong> developing newindigenous vendors after a delay <strong>of</strong> 24 monthsTotal 26.35189
Report No. 10 <strong>of</strong> 2010-11Sl.No.<strong>Annexure</strong>-XX(Referred to in paragraph no.6.6.5.3)Statement showing <strong>the</strong> Additional Expenditure <strong>of</strong> Rs.29.09 crorePO Reference Audit Observation Management’s Reply Amount(Rs. in1. T7N6116 &T7N6117(May 2007)2. T8N6106(April 2008)Two Purchase Orders were placed (23 February 2007) on M/sSDF @ EU 955000 <strong>for</strong> LP Rotors. Instead <strong>of</strong> approaching <strong>the</strong>vendor <strong>for</strong> repeat ordering against additional requirement <strong>of</strong> 6LP Rotors, <strong>the</strong> unit floated fresh enquiry (22 March 2007).Accordingly, two purchase orders were placed one on M/sSDF @ EU 1329700 per pc <strong>for</strong> 4 LP Rotors <strong>for</strong> deliverybe<strong>for</strong>e March 2009 and @ EU 1330186 per pc <strong>for</strong> 2 LP Rotors<strong>for</strong> delivery after 1 April 2009), which resulted in extraexpenditure <strong>of</strong> Rs.14.24 crore (EU 2249172).The unit had placed PO (January 2008) <strong>for</strong> procurement <strong>of</strong> 4LP Rotors @ EU1172100. Instead <strong>of</strong> approaching <strong>the</strong> vendor<strong>for</strong> repeat ordering on <strong>the</strong> vendors (M/s SAAR & M/s SDF),<strong>the</strong> Unit floated fresh enquiry (27 February 2008) despiteknowing <strong>the</strong> increasing price trend. The rates <strong>of</strong>fered in <strong>the</strong>subsequent enquiry were EU 1265000 per rotor whichresulted in extra expenditure <strong>of</strong> Rs.6.47 crore (EU 1021900).The Corporate Management stated (January 2010) that repeat order was very delicatedecision which was heavily dependent on assessment <strong>of</strong> market situation at that time. Inmany cases especially in recession times it may prove to be counter productive. Also, itwas akin to Single Tender purchase. Hence repeat ordering was not encouraged in highvalue procurements. The reply is not in <strong>the</strong> line with <strong>the</strong> provisions <strong>of</strong> Purchase Policywhich insists <strong>the</strong> placement <strong>of</strong> repeat order provided <strong>the</strong>re is no downward price trend.The unit stated (29 August 2009) that as <strong>the</strong> price bid against <strong>the</strong> earlier enquiry wasopened, <strong>the</strong> clubbing <strong>of</strong> additional requirement was not possible.Reply is not tenable as:(i) After opening <strong>of</strong> price bid, <strong>the</strong> Company could have approached <strong>the</strong> L1 vendor <strong>for</strong>additional requirement as in case <strong>of</strong> repeat order.(ii) Moreover, <strong>the</strong> unit also had <strong>the</strong> option to place repeat order against PO placed inearlier enquiry. (Management replies and rebuttal as mentioned above)crore)14.246.473. T7N6380(September2007)Against <strong>the</strong> indent (21 May 2007) <strong>for</strong> 5 Nos. LP Rotors, <strong>the</strong>Unit approached (25 July 2007) M/s SDF <strong>for</strong> repeat ordering(PO No. 7/6117 @ EU 1329700 per pc) and placed a repeatorder (PO No. 7/6231 and 7/6232 dated 31 July 2007).However, be<strong>for</strong>e placement <strong>of</strong> repeat order (PO No. 7/6231and 7/6232), fur<strong>the</strong>r indents <strong>for</strong> 3 Nos. LP Rotors with firmrequirement had also been finalized (20 & 24 July 2007)which were received in Purchase Department on 26 July 2007.Instead <strong>of</strong> clubbing <strong>the</strong> additional requirement <strong>of</strong> 3 Nos. inrepeat ordering, <strong>the</strong> Unit invited limited tender enquiry (16August 2007). Only one <strong>of</strong>fer <strong>of</strong> M/s SDF was received and<strong>the</strong> Unit placed two POs in September 2007 @ EU 1587800per pc) on <strong>the</strong> vendor.Thus by not opting <strong>for</strong> repeat order, Company committed toincur extra expenditure <strong>of</strong> Rs 4.90 crore (EU 774300).Management stated (June 2009) that:-(i) Against last enquiry M/s SDF had quoted <strong>for</strong> all 6 nos. with differential rates <strong>of</strong> EU1329700 per pc <strong>for</strong> 4 Nos. with delivery till 31March 2009 and EU 1369600 per pc <strong>for</strong> 2nos. deliveries after 1 April 2009. M/s Mitsui had quoted <strong>for</strong> 2 nos. @ EU1338357 per pcand delivery after 1 April 2009.(ii) Since delivery against indent 7/1300 was be<strong>for</strong>e 31March 2009 repeat order wasplaced on M/s SDF. However, <strong>for</strong> delivery after 1 April 2009 order had been placed onM/s Mitsui who had <strong>of</strong>fered only 2 nos. against enquiry <strong>of</strong> 6 nos., competent authorityordered <strong>for</strong> fresh enquiry.Reply is not tenable because:(i) As per Corporate purchase policy a repeat order may be placed provided <strong>the</strong>re is nodownward price trend and it should give benefit in delivery.(ii) Since M/s SDF had quoted differential rates on delivery based, repeat order couldhave been placed <strong>for</strong> additional 3nos having required delivery after March 2009.(iii) Repeat order placed (PO No 7/6231-32) were with delivery after April 2009.4.904. T8N6091(April 2008)The unit had placed (2 January 2008) PO (No. T7N6633 and6634) @ EU 341000 per pc <strong>for</strong> procurement <strong>of</strong> 4 nos. IPRotor on M/s SAAR. But instead <strong>of</strong> approaching vendor <strong>for</strong>The Unit stated (October 2009) that since <strong>the</strong> last PO placed <strong>for</strong> one No. IP Rotor andindents were <strong>for</strong> 5 nos., it was thought prudent to issue fresh enquiry <strong>for</strong> taking1901.77
Report No. 10 <strong>of</strong> 2010-11repeat order, fresh enquiry was floated (20 February 2008)and PO (T8N6091) was placed (19 November 2008) @ EUadvantage <strong>of</strong> bulk quantity. Reply is not tenable as <strong>the</strong> earlier PO (No. T7N6633 &T7M6634) was placed <strong>for</strong> 4 nos. on <strong>the</strong> same vendor.381000 per pc against <strong>the</strong> additional requirement <strong>of</strong> 7 nos. IPRotor.Thus, by not opting <strong>for</strong> repeat order Company committed toincur extra expenditure <strong>of</strong> Rs 1.77 crore (EU 280000).5. T8M6612 The unit had placed a PO (8/6234) <strong>for</strong> procurement <strong>of</strong> IP The Corporate Management stated (January 2010) that repeat order was very delicate 1.40(December Inner Casing (3 Sets) on M/s Cividale @ EU 494500 per set. decision which was heavily dependent on assessment <strong>of</strong> market situation at that time. In2008) However, instead <strong>of</strong> asking <strong>the</strong> vendor <strong>for</strong> repeat orderingagainst <strong>the</strong> additional requirement <strong>of</strong> 4 sets, fresh enquiry wasfloated (22 July 2008) and PO (2008/6612) was placed (22December 2008) on <strong>the</strong> same vendor @ EU 568094 per setresulting into extra-expenditure <strong>of</strong> Rs.1.40 crore (EU 220782).many cases especially in recession times it may prove to be counter productive. Also, itwas akin to Single Tender purchase. Hence repeat ordering was not encouraged in highvalue procurements. The reply is not in <strong>the</strong> line with <strong>the</strong> provisions <strong>of</strong> Purchase Policywhich insists <strong>the</strong> placement <strong>of</strong> repeat order provided <strong>the</strong>re is no downward price trend.6. F7K6566 A PO was placed (3 August 2007) on M/s. Dilling GTS, <strong>for</strong> The Corporate Management stated (January 2010) that repeat order was very delicate 0.31(November Carbon Steel Plates <strong>of</strong> thickness 110mm and 120mm @ EU decision which was heavily dependent on assessment <strong>of</strong> market situation at that time. In2007) 1225 per MT. Indent <strong>for</strong> <strong>the</strong> same material along with o<strong>the</strong>ritems was again raised on 12 September 2007 (approximatelyone and half month after PO placement). Instead <strong>of</strong> asking <strong>the</strong>vendor <strong>for</strong> repeat order, <strong>the</strong> Unit went <strong>for</strong> fresh enquiry andplaced PO on M/s. Reiner Brach @ EU 1320 & EU 1335 perMT respectively in November, 2007 resulting into extraexpenditure <strong>of</strong> Rs.30.73 lakh.many cases especially in recession times it may prove to be counter productive. Also, itwas akin to Single Tender purchase. Hence repeat ordering was not encouraged in highvalue procurements. The reply is not in <strong>the</strong> line with <strong>the</strong> provisions <strong>of</strong> Purchase Policywhich insists <strong>the</strong> placement <strong>of</strong> repeat order provided <strong>the</strong>re is no downward price trend.7. Total 29.09191
Report No. 10 <strong>of</strong> 2010-11<strong>Annexure</strong>-XXI(Distillate Yield and Fuel & Loss)(Referred to in paragraph no.7.7.1)Mathura RefineryPanipat Refinery2006-07 2007-08 2008-09 2006-07 2007-08 2008-09Distillate MOU target (%) 69.9 70 70 78.6 77.0 78Yield Actual (%) 71.5 70.8 71.1 72.2 78.1 80.7Fuel & MOU target (%) 10.0 9.8 9.3 12.6 10 10.2Loss Actual (%) 8.8 8.8 8.7 13.0 9.7 9.6<strong>Annexure</strong>- XXII(Capacity utilization <strong>of</strong> processing <strong>units</strong>)(Referred to in paragraph no.7.7.2)(in percentage)Units 2006-07 2007-08 2008-09 2006-07 2007-08 2008-09Mathura RefineryPanipat RefineryCDU 111 104.5 107.5 89.7 97.1 101.0CDU 2 67.6 116.6 116.8VDU 106.75 95.37 103.26 79.6 87.5 92.6VDU 2 63.9 114.3 115.1BBU 135.80 89.72 79.39 87.0 74.6 53.9CCRU 94.20 89.04 88.28 60.8 78.1 79.7DCU 47.3 96.0 98.3DHDS 79.74 74.99 84.76 52.5 66.4 109.6DHDT 79.23 79.15 80.08 59.0 87.7 86.6FCCU 103.29 90.08 100.41 103.5 104.4 100.4HGU I 87.21 85.12 85.54 51.1 74.1 52.9HGU II 62.64 54.69 65.16 47.9 60.0 67.2NHDT 75.03 49.60 47.26NSU 78.00 98.44 106.07OHCU 97.70 90.00 100.95 77.8 100.0 107.2PENEX 87.18 61.27 60.84PRU 50.44 50.74 26.45PX 58.9 90.6 87.2PTA 36.4 75.2 77.5PXPTA Splitter 60.09 56.01 56.75SRU 64.21 58.29 71.53 44.9 60.1 41.3SRU 2 24.7 50.4 78.0VBU 83.73 60.54 84.82 52.4 48.8 7.6HCU 60.0 105.5 106.3192
Report No. 10 <strong>of</strong> 2010-11<strong>Annexure</strong>- XXIII(Referred to in paragraph no.7.7.2)Statement showing quantity <strong>of</strong> Production <strong>of</strong> various products(Qty in MT)Product Mathura Panipat2006-07 2007-08 2008-09 2006-07 2007-08 2008-09Propylene 13514 13445 7012 -56 2220 -488LPG 315972 294552 328317 289036 424450 465767LAN 306807 257525 383966Super Naphtha 7660 3851 10739Naphtha 593371 806624 824631PTA 196915 386201 401639Paraxylene - 17397 5097PX-PTA feed Naphtha 155526 149603 154736MS-BS II 560423 570335 801231BS-II 3% Bz 196075 259083 274950MS Xtra Premium 13083 0 0MS Euro-III 890495 736257 720688 104225 185562 186010MS 93 RON 1657 1184 1186SKO 509796 427430 437754 779779 1114106 1237813ATF 716312 695843 674303 456722 661671 672759MTO 9621 11817 10600HSD BS-II 2891863 4190836 4404156HSD Euro-III 1806515 1518617 1740179 1198342 1724645 1663307HSD Winter Grade 1994 1751 2666ULHSD 1536552 1488946 1466477DHPPA 5386 12068 14779HPS 429757 391599 441615 319214 317330 191434Bitumen 677917 717034 722638Bitumen (80-100) 365799 290133 246341Bitumen (60-70) 118931 126924 134930RPC 317533 699784 725015Sulphur 38525 36276 42915 67782 113811 139170Gas Fuel 163250 150873 143340 384011 - -Liquid Fuel 913157 - -Coke 54556 47455 53795 42150 - -FO 836885 721693 809325RFO 80115 64492 35708193
Report No. 10 <strong>of</strong> 2010-11<strong>Annexure</strong> XXIV(Referred to in paragraph no.7.7.6)(Details <strong>of</strong> Pollution control)a) Air Polluants: SO 2 EmissionsSl. SO 2 Emission from Limit Mathura RefineryPanipat RefineryNo. Process Unit2006-07 2007-08 2008-09 2006-07 2007-08 2008-091 AVU (Kg/MT Crude) 0.25 0.09 0.06 0.07 0.17 0.13 0.122 FCCU (Kg/MT <strong>of</strong> feed) 2.5 0.58 0.58 0.53 0.42 0.15 0.173 SRU (Kg/MT <strong>of</strong>120 18.62 21.28 21.28 30.69 17.6 18.8Sulphur in feed)4 Total SO 2 emission(Kg/hr)450 333 302 308BB 1Treated Effluent Leaving RefineryWater Pollutants-Mathura RefineryMINASActualSl. No. Parameter Old Revised 2006-07 2007-08 2008-09Standard Standard*1 pH 6.0–8.5 6.0–8.5 7.5-7.9 7.3 7.1-7.72 Oil & Grease 10 max 5 max 5.5-6.0 5.6-6.0 4.53 Phenol 1.0 max 0.35 max 0.06-0.07 0.06-0.07 0.05-0.064 Sulphides 0.5 max 0.5 max 0.18-0.20 0.17-0.19 0.10-0.205 BOD 15 max 15 max 11.0-12.0 9.0-10.0 7.0-9.06 COD - 125 max - - 65-887 TSS 20 max 20 max 10.0-11.0 9.5-10.2 9.0-11.0*Revised Standard notified vide gazette notification dated 18 March 2008Sl.No.ParameterB 2 Water Pollutants-Panipat RefineryOld RevisedActualStandardStandard* 2006-07 2007-08 2008-09ETP-1 ETP-2 ETP-1 ETP-2 ETP-1 ETP-21 pH 6.0–8.5 6.0–8.5 7.8 7.4 7.2 7.3 7.9 7.62 Oil & Grease 10 max 5 max 7.4 7.1 7 7.5 7.2 7.13 Phenol 1.0 max 0.35 max 0.06 0.05 0.07 0.07 0.05 0.054 Sulphides 0.5 max 0.5 max 0.4 0.4 0.35 0.35 0.34 0.335 BOD 15 max 15 max 12.2 12.1 12.5 12.8 11.9 11.56 COD - 125 max 83.6 84.7 106 109 89 87.27 TSS 20 max 20 max 16 13 16 15 15.2 14.4ETP-Effluent Treatment Plant194
Report No. 10 <strong>of</strong> 2010-11<strong>Annexure</strong> XXV(Referred to in paragraph 8.1 and 8.7.3.3)Main features <strong>of</strong> Nomination blocks and NELP blocksA. Nomination blocks(a) Upto 1998, <strong>the</strong> Company was <strong>of</strong>fered exploratory blocks on ‘nomination basis’ and wasallowed to apply to <strong>the</strong> Ministry <strong>of</strong> Petroleum and Natural Gas (MOPNG) <strong>for</strong> grant <strong>of</strong>Petroleum Exploration License (PEL) in respect <strong>of</strong> <strong>the</strong> <strong>of</strong>fshore blocks and, hence, <strong>the</strong>seblocks were called as nomination blocks.(b) The Ministry <strong>of</strong> Petroleum and Natural Gas (MOPNG) amended its policy in March 2002and directed that <strong>the</strong> PEL would not be extended beyond <strong>the</strong> current re-grant cycle.(c) The re-grant <strong>of</strong> Petroleum Exploration Licence (PEL) was given <strong>for</strong> four years with anextension <strong>of</strong> fifth year subject to surrender <strong>of</strong> 25 per cent <strong>of</strong> <strong>the</strong> original PEL area held by <strong>the</strong>Company.(d) Sixth and seventh year extension is granted <strong>for</strong> pursuing <strong>the</strong> lead <strong>of</strong> hydrocarbon reserveswith a condition that maximum area retained cannot exceed 50 per cent <strong>of</strong> <strong>the</strong> original PELarea.(e) No re-grant would be available after completion <strong>of</strong> current grant cycle where nei<strong>the</strong>r leadshave been obtained nor discovery has been made.B. NELP blocks(a) The Companies/JVs, while bidding <strong>for</strong> <strong>the</strong> NELP blocks submit Phase-wise minimum workprogramme (MWP) which is included in <strong>the</strong> Production Sharing Contracts (PSCs).(b) The MWP consists <strong>of</strong> commitments made by <strong>the</strong> bidder <strong>for</strong> each block in terms <strong>of</strong> extent <strong>of</strong>surveys to be conducted and wells to be drilled within seven years, divided into three Phases.(c) In <strong>the</strong> event <strong>of</strong> non-fulfillment <strong>of</strong> <strong>the</strong> MWP <strong>for</strong> any Phase, <strong>the</strong> Company can be granted firstextension not exceeding six months without penalty.(d) Fur<strong>the</strong>r extensions, however, are granted as per <strong>the</strong> Extension Policy <strong>of</strong> 2006 which envisagefurnishing <strong>of</strong> a bank guarantee equal to <strong>the</strong> cost <strong>of</strong> unfinished MWP besides payment <strong>of</strong>liquidated damages at <strong>the</strong> rate <strong>of</strong> 10 per cent and 30 per cent <strong>of</strong> <strong>the</strong> cost <strong>of</strong> unfinished MWP<strong>for</strong> second and third extensions (six months each) respectively.(e) No extension is allowed beyond 18 months and <strong>the</strong> extended period <strong>of</strong> a particular Phase issubtracted from <strong>the</strong> subsequent Phase <strong>of</strong> <strong>the</strong> exploration.(f) In case no discovery is made, <strong>the</strong> block has to be surrendered.Merger Policy under NELPThe MOPNG introduced an optional scheme known as Merger Policy 2007 <strong>for</strong> NELP III and IVblocks to address <strong>the</strong> un<strong>for</strong>eseen situation on non availability <strong>of</strong> <strong>of</strong>fshore rigs in <strong>the</strong> internationalmarket. The period <strong>of</strong> <strong>the</strong> existing Phase I was re-named as new Phase I and <strong>the</strong> MWP <strong>of</strong>existing Phase II and III was merged into a new Phase II to be completed in <strong>the</strong> period providedin <strong>the</strong> existing Phase III. However, <strong>the</strong> contractor was required to avail 18 months extension interms <strong>of</strong> Extension Policy <strong>of</strong> 2006 be<strong>for</strong>e <strong>the</strong> merged period <strong>of</strong> erstwhile Phase II commenced.The contracts already entered in Phase II or which had only seismic work programme and nodrilling commitments in Phase I were not covered under this scheme.195
Report No. 10 <strong>of</strong> 2010-11Sl.No.<strong>Annexure</strong> XXVI(Referred to in para 8.7.1.1)Statement showing details <strong>of</strong> <strong>the</strong> nomination blocks held during 2004-2008Name <strong>of</strong> <strong>the</strong>block1. BombayOffshoreExtn.-III2. R-6/R-28Structure3. ED-AStructureName <strong>of</strong><strong>the</strong>BasinDate o<strong>for</strong>iginalgrantCommencement <strong>of</strong>current regrantperiodDate <strong>of</strong> expiry <strong>of</strong>current re-grantWOB 20.11.1989 19.11.2001 Converted intomining lease inNovember 2006.Area ason31.03.2008(SKM)523WOB 01.11.1996 1.12.2002 31.10.2009 362WOB 18.11.1996 18.11.2002 17.11.2009 5064. WO-9 Block WOB 12.12.1990 12.12.2002 11.12.2009 2775. Bombay WOB 14.11.1985 14.11.2003 13.11.2010 18599Offshore 1/2/36. B-142 WOB 22.04.1991 20.4.2003 Surrendered in 30StructureFebruary 2009.7. SW <strong>of</strong> BH WOB 01.01.1998 1.1.2004 31.12.2010 8468. KD-GKH WOB 01.04.1998 1.4.2004 31.03.2011 4486Block9. KutchOffshoreBlock I "A &B"WOB 06.06.1986 6.6.2004 05.08.2011 27910. KutchOffshoreBlock-I Extn.11. Kutch-H blockI & II12. Saurashtra-Dahanu13. B-192 ABlockWOB 01.01.1987 1.1.2005 31.12.2011 2118WOB 27.06.1994 27.6.2004 Surrendered in 159December 2008.WOB 20.07.1993 20.7.2005 19.12.2012 1880WOB 12.05.1995 12.5.2005 Converted intomining lease inNovember 2007.14. SM-86-A WOB 01.02.1997 1.2.2003 Surrendered in 520December 2006.15. IA K.G. 22.10.1998 22.10.2004 21.10.2011 110Offshore16. IB K.G. 16.12.1998 18.12.2004 15.12.2011 123Offshore17. IE K.G. 16.12.1998 15.12.2004 15.12.2011 201Offshore18. IF K.G. 20.09.1997 20.09.2003 19.9.2010 309Offshore19. IG K. G. 01.02.1997 01.02.2003 13.01.2010 104.40Offshore20. C-OS-IX Cauvery 01.01.1998 01.01.2004 13.12.2010 803Offshore21. C-OS-X Cauvery 01.01.1998 01.01.2004 Surrendered in 866OffshoreDecember 2007.157196
Report No. 10 <strong>of</strong> 2010-11Sl.No.Name <strong>of</strong><strong>the</strong> block1. MB-OSN-97-42. KK-OSN-97/33. MB-OSN-2000/1PhaseYearsPhase<strong>Annexure</strong> XXVII(Referred to in para 8.7.1.2)MWP vis-à-vis achievement in respect <strong>of</strong> Shallow Water NELP BlocksPeriod3-2-2Phase I8.5.2000 to7.5.20033-2-2 8.5.2000 to7.5.20033-2-2 2.8.2001 toPhase I 1.8.2004CommitmentActual within <strong>the</strong> Phase – IPeriodShortfall/Remarks2D 3D (SKM) Wells 2D 3D(SKM Wells(LKM)(LKM)500 150 1 512 152 - 1 well- 100 1 - 100 - 1 (Well K-10 spud on 17.09.03)Block surrendered on 06.04.04.1000 1500 5 1001 2418 3 2(Block surrendered in 2008)4. GS-OSN/2001/15. KK-OSN-2001/23-2-2Phase I3-2-2Phase I12.3.2003 to11.3.200612.3.2003 to11.3.20061000 2000 4 1022 2073 - 41000 500 1 990 591 - One well under drilling during2008-096. KK-OSN-2001/37. GS-OSN-2003/18. GS-OSN-2004/19. KG-OSN-97/110. KK-OSN-2000/111. CY-OSN-2000/13-2-2Phase I12.3.2003 to11.3.20062-3-2 5.12.2005 to4.12.20074-3 02.3.2007 to01.3.20112-3-2 19.5.2000 toPh.I 18.5.20022-3-2 16.8.2001 toPhase I 15.8.20032-3-2 01.8.2001 toPhase I 31.7.20031500 500 1 1052 602 - One well yet to be drilled500 - - 510 - MWP completed in Phase I3700 1000 1 3713 1069 -2000 - - 2042 -- -- No pending MWP <strong>of</strong> Phase I500 - - 502 - - No pending MWP in Phase IBlock surrendered on 15.02.2004500 -- - 518 - No pending MWP in Phase I,Block surrendered on 14.2.2007197
Report No. 10 <strong>of</strong> 2010-11Sl.No.Name <strong>of</strong><strong>the</strong> block12. CY-OSN-2000/2PhaseYearsPhase3-2-2Phase IPeriod16.8.2001 to15.8.2004CommitmentActual within <strong>the</strong> Phase – IPeriodShortfall/Remarks2D 3D (SKM) Wells 2D 3D(SKM Wells(LKM)(LKM)1000 500 3 1174 1035 2 113. CB-OSN-2003/114. KG-OSN-2004/115. WB-OSN-2000/116. MN-OSN-97/317. MN-OSN-2000/13-2-2Phase I5.12.2005 to4.12.20084-3Phase I25.5.2007 to24.5.20113-2-2 30.7.2001 toPhase I 29.7.20042-3-2 19.5.2000 toPhase I 18.5.20022-3-2 16.8.2001 to15.8.20031000 - 8 1173 - 2 2008-09Two wells drilled and 6 wellspending500 1150 7 - 964 Phase I is upto 20112000 1500 4 2010 1508 - Four Wells pending.1500 1280 No shortfall in MWP in Phase I500 - - 500 - - No shortfall in MWP in Phase INote 1: MWP in Phase-I not completed in <strong>the</strong> blocks at Sl. No.1 to 6, 12,13 and 15.2: Shortage <strong>of</strong> 21 wells in <strong>the</strong> blocks at Sl. No.1 to 6, 12,13 and 15.3: Blocks upto NELP-V (15 Nos) and blocks in NELP-VI (2 Nos. viz. GS OSN 2004/1 and KG OSN 2004/1).4: MWP completed in Phase I (6 Nos. viz. MN OSN 97/3, MN OSN 2000/1, CY OSN 2000/1, KK OSN 2000/1, KG OSN 97/1 and GS OSN 2003/1 ).5. Blocks Surrendered as on 30 th September 2009: Sl.No.1, 2, 4,11,12,15, 16 and 17.6. Blocks Proposed to be surrendered as on 30 th September 2009: Sl.No.3 and 9.7. Block at Sl.No.10 was surrendered in 203-04 and as such was not within <strong>the</strong> scope <strong>of</strong> per<strong>for</strong>mance audit.198
Report No. 10 <strong>of</strong> 2010-11Sr.No.<strong>Annexure</strong>-XXVIII(Referred to in para 8.7.1.2)Statement showing project evaluation <strong>of</strong> 16 NELP shallow water blocks whilebiddingName <strong>of</strong> blockArea inSKMNo. wellsdrilled earlierin <strong>the</strong> area2D dataacquiredin LKMNo. <strong>of</strong>prospectsidentifiedNo. <strong>of</strong>leadsidentified1 MB OSN 97/4 18860 4 (3 dry) 21762 25 102 KK OSN 97/3 15910 2 (dry) 6477 9 03 MN OSN 97/3 5420 4 (dry) 3100 0 134 KG OSN 97/1 4485 - (nil wells) 1107 3 25 MB OSN 2000/1 18414 8 (7 dry and 1 21516 5 0oil indication)6 CY OSN 2000/1 5920 Nil wells 2036 0 37 CY OSN 2000/2 3530 2 (dry) 3693 3 38 MN OSN 2000/1 6730 Nil wells 505 0 29 WB OSN 2000/1 6700 5 (dry) 1805 5 010 KK OSN 2001/2 14120 3 (dry) 8022 2 011 KK OSN 2001/3 8595 1 (dry) 8208 3 012 GS OSN 2001/1 9468 1 (dry) 8044 20 013 GS OSN 2003/1 5970 1(dry) 3142 3 014 CB OSN 2003/1 2394 5 (2 dry) 1695 6 015 GS OSN 2004/1 6589 2 (dry) 5111 0 016 KG OSN 2004/1 1151 14 (12 dry)(2 Gas)2851450 SKM– 3D5 0Total: 52 wells 89 33Of <strong>the</strong> 52 wells, 45 were dry and 7 indicated presence <strong>of</strong> oil/gas.199
Report No. 10 <strong>of</strong> 2010-11<strong>Annexure</strong> XXIX(Referred to in para 8.7.3.1)Basin-wise details <strong>of</strong> number <strong>of</strong> locations planned as per AP and RDP and actual locationsdrilled during 2004-08Year Planned as Planned as DrilledShortfall with reference toper AP per RDPAPRDPMumbai Offshore Basin2004-05 24 22 14 10 082005-06 18 18 ^^11 07 072006-07 17 17 13 04 042007-08 20 20 17 03 03Total 79 77 55 24 22Krishna-Godavari Basin2004-05 5 8 2 3 62005-06 7 7 5 2 22006-07 5 7 2 3 52007-08 6 9 4 2 5Total 23 31 13 10 18Cauvery Basin2004-05 5 2 2 3 02005-06 2 2 0 2 22006-07 1 1 0 1 12007-08 0 0 0 0 0Total 8 5 2 6 3Bengal-Mahanadi Basin2004-05 6 2 0 6 22005-06 4 6 1 3 52006-07 4 4 1 3 32007-08 4 5 4 0 1Total 18 17 6 12 11GrandTotal128 130 76 52 54^^excluding two locations planned in 2004-05 but drilled in 2005-06-----------------------------------------------------------------------------------------------------------<strong>Annexure</strong> XXX(Referred to in para 8.7.3.4)Details <strong>of</strong> productive and unproductive rig time (in hours)YearProductiveTimeTotalComplicationsNon Productive TimeWaitingon manandmaterialWaiting onwea<strong>the</strong>rRepairsO<strong>the</strong>rs2004-05 31757.52 16157.24 5494.14 3375.93 387.16 3411.77 3488.242005-06 30022.00 16844.32 9785.43 2486.93 275.72 2241.73 2054.502006-07 33810.59 20667.59 10679.88 1948.05 2816.32 4038.34 1184.002007-08 52058.05 11120.20 5668.75 2001.47 288.83 2153.17 1008.00Total 147648.16 64789.35 31628.20 9812.38 3768.03 11845.01 7734.74(30.5%) (14.9%) (4.6%) (1.8%) (5.6%) (3.6%)200
Report No. 10 <strong>of</strong> 2010-11<strong>Annexure</strong> XXXI(Referred to in para 8.7.5.1)Details <strong>of</strong> accidents and ‘near miss’ reportsAccident ReportRig nameYear2004-05 2005-06 2006-07 2007-08S/Gaurav 5 Mn 1P 2 Mn 4 MnS/Samrat -- 1P -- --CE Thornton 2 Mn 1Mn, 1 Sr -- --Badrinath 2 Mn -- -- 1 SrKedarnath1 Mn2 Sr2 Mj -- --D S Matdrill -- -- 1 Sr 2 SrFrontier Ice--2 Mn 1 Mn,1Sr --S/Ratna1 Mj--4 Mn,1 Sr --S/Jyoti 2 Mn 3 Mn 1 Sr1 Mn2 MnS/Bhushan1 Mn, 5 Mn1 Sr 1 Sr.1Mj1 Sr.Total Mn 13Mj 04Mn 11Mj 0P 02Sr 02Mn 09Mj 0Sr 05Mn-Minor Injury, Mj- Major Injury, Sr - Serious Injury, P- Property DamageMn 5Mj 0Sr 6Near Miss reportRig nameYear2004-05 2005-06 2006-07 2007-08S/GauravNotreported 11 10 13S/Samrat 8 -- --CEThornton 4 -- 04Badrinath -- -- --Kedarnath -- -- 01D S Matdrill -- -- --Frontier Ice 18 1 04S/Ratna -- 6 09S/Jyoti -- -- 07S/Bhushan 17 10 16Total: 58 27 54201
Report No. 10 <strong>of</strong> 2010-11<strong>Annexure</strong> – XXXIICompanyHindustanShipyardCochinShipyard(Referred to in Paragraph 9.1.1)Details <strong>of</strong> facilities available at respective shipyardsFacilities available• One dry dock to carry out underwater repairs <strong>of</strong> ships upto 70000 DWT• One wet basin to carry out afloat repairs• Lifting capacity in <strong>the</strong> <strong>for</strong>m <strong>of</strong> cranes <strong>of</strong> <strong>the</strong> capacity <strong>of</strong>• 40 tons – 2 nos• 20 tons – 1 no• 10 tons – 3 nos• o<strong>the</strong>r associated basic workshop facilities <strong>for</strong> blasting and painting, steelrenewals, electrical, rigging etc.• One dry-dock capable <strong>of</strong> accommodating ships up to 125000 DWT• Two quays (280 metre length with 15 ton cranage and 208 metre lengthwith 5-10 ton cranage)• An engine and machine shop with allied tools and machineries.<strong>Annexure</strong>-XXXIII(Referred to in Paragraph 9.7.1)Statement showing <strong>the</strong> ship repair turnover <strong>of</strong> Indian Yards duing 2004-05 to 2008-09Shipyard 2004-05 2005-06 2006-07 2007-08 2008-09amount % age amount % age amount % age amount % age amount % age1 Cochin 148.02 38.55 151.27 47.86 241.53 57.62 252.14 63.88 270.06 55.07Shipyard2 Hindustan 135.12 35.19 87.90 27.81 92.14 21.98 108.46 27.48 144.13 29.39Shipyard3 MDL 17.20 4.48 6.51 2.06 0.14 0.03 0.00 0.00 0.00 0.004 GSL 10.84 2.82 15.19 4.81 22.78 5.43 5.47 1.39 2.25 0.465 GRSE 6.90 1.80 0.60 0.19 0.00 0.00 6.30 1.60 0.93 0.196 HDPE 6.00 1.56 1.50 0.47 3.50 0.83 0.00 0.007 WISL 42.00 10.94 42.70 13.51 45.00 10.73 15.80 4.00 72.15 14.718 ABG 15.50 4.04 6.60 2.09 12.00 2.869 Vipul 0.80 0.21 1.20 0.38 1.50 0.366.51 1.65 0.86 0.1810 NN Ship 0.90 0.23 0.60 0.19 0.10 0.02builders11 Geeta engg. 0.70 0.18 2.00 0.63 0.50 0.12Totals 383.98 100.00 316.07 100.00 419.19 100.00 394.68 100.00 490.38 100.00Source:- Annual accounts in respect Sl. No. 1 to 5 <strong>for</strong> <strong>the</strong> five years.- Report <strong>of</strong> Working Group on Eleventh FYP in respect <strong>of</strong> Sl. No.6 to 10 <strong>for</strong> threeyears from 2004-05 to 2006-07.- Websites and in<strong>for</strong>mation furnished by <strong>the</strong> Company Secretary <strong>of</strong> Cochin Shipyardin respect <strong>of</strong> Sl. No.7 and 8 <strong>for</strong> <strong>the</strong> years 2007-08 and 2008-09.202


