Visual Acuity Assessment with Snellen and ETDRS Charts
Visual Acuity Assessment with Snellen and ETDRS Charts
Visual Acuity Assessment with Snellen and ETDRS Charts
- No tags were found...
Create successful ePaper yourself
Turn your PDF publications into a flip-book with our unique Google optimized e-Paper software.
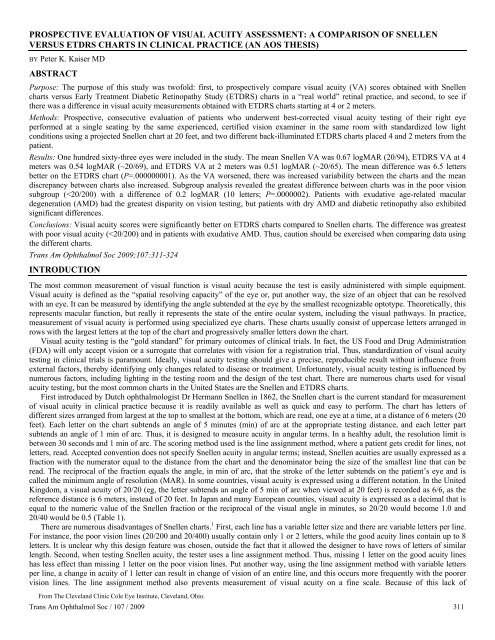
PROSPECTIVE EVALUATION OF VISUAL ACUITY ASSESSMENT: A COMPARISON OF SNELLENVERSUS <strong>ETDRS</strong> CHARTS IN CLINICAL PRACTICE (AN AOS THESIS)BY Peter K. Kaiser MDABSTRACTPurpose: The purpose of this study was twofold: first, to prospectively compare visual acuity (VA) scores obtained <strong>with</strong> <strong>Snellen</strong>charts versus Early Treatment Diabetic Retinopathy Study (<strong>ETDRS</strong>) charts in a “real world” retinal practice, <strong>and</strong> second, to see ifthere was a difference in visual acuity measurements obtained <strong>with</strong> <strong>ETDRS</strong> charts starting at 4 or 2 meters.Methods: Prospective, consecutive evaluation of patients who underwent best-corrected visual acuity testing of their right eyeperformed at a single seating by the same experienced, certified vision examiner in the same room <strong>with</strong> st<strong>and</strong>ardized low lightconditions using a projected <strong>Snellen</strong> chart at 20 feet, <strong>and</strong> two different back-illuminated <strong>ETDRS</strong> charts placed 4 <strong>and</strong> 2 meters from thepatient.Results: One hundred sixty-three eyes were included in the study. The mean <strong>Snellen</strong> VA was 0.67 logMAR (20/94), <strong>ETDRS</strong> VA at 4meters was 0.54 logMAR (~20/69), <strong>and</strong> <strong>ETDRS</strong> VA at 2 meters was 0.51 logMAR (~20/65). The mean difference was 6.5 lettersbetter on the <strong>ETDRS</strong> chart (P=.000000001). As the VA worsened, there was increased variability between the charts <strong>and</strong> the me<strong>and</strong>iscrepancy between charts also increased. Subgroup analysis revealed the greatest difference between charts was in the poor visionsubgroup (
<strong>Visual</strong> <strong>Acuity</strong> <strong>Assessment</strong> <strong>with</strong> <strong>Snellen</strong> <strong>and</strong> <strong>ETDRS</strong> <strong>Charts</strong>st<strong>and</strong>ardized progression between lines, <strong>Snellen</strong> visual acuity is difficult to assess statistically. Parametric analysis cannot beperformed <strong>with</strong> this decimal progression sequence, even if converted to another form. Third, there is an irregular <strong>and</strong> arbitraryprogression of letter sizes between lines. This introduces considerable error when changing the viewing distance of the chart <strong>and</strong> leadsto overestimation of vision at the lower end of acuities. Moreover, a loss or gain in a line of vision does not have the same meaning indifferent parts of the chart. Fourth, the letters on a <strong>Snellen</strong> chart are not always the same legibility. Some letters (eg, C, D, E, G, O) areeasier to read than others (eg, A, J, L). 1-3 Fifth, the distance between letters <strong>and</strong> rows is not st<strong>and</strong>ardized. Studies have shown thatwhen letters are spaced too closely, there is an effect from the adjacent contours called a crowding phenomenon, that diminishesacuity. 4 Contour interactions vary throughout the <strong>Snellen</strong> chart. For example, the poor vision lines have minimal crowding, whereasthe good acuity lines have greater crowding. Except for the size of the letters, the testing of any given line should present anessentially equivalent task to the patient; however, having different numbers of letters <strong>and</strong> different spacing prevents this fromoccurring. Thus, patients <strong>with</strong> poor central vision who can read single letters more easily than a row of letters may not be able to reada line because of this phenomenon, <strong>and</strong> not because of an inability to see the letters. Finally, the term “<strong>Snellen</strong> chart” has never beenst<strong>and</strong>ardized, so the criteria to label a chart design as “<strong>Snellen</strong>” are not defined. <strong>Snellen</strong> charts from different manufacturers may usedifferent fonts, different letters, <strong>and</strong> different spacing ratios, <strong>and</strong> they may be illuminated or projected differently. 5 When projected,mirrors can be used to simulate the 20-foot optical testing distance. This is useful in clinical lanes shorter than 20 feet.TABLE 1. CONVERSION OF SNELLEN ACUITYINTO LOGMAR, DECIMAL, AND METRIC UNITSlogMAR SNELLEN DECIMAL SNELLEN(METRIC)1.5 20/640 0.03 6/1921.4 20/500 0.04 6/1521.3 20/400 0.05 6/1201.2 20/320 0.063 6/961.1 20/250 0.08 6/761.0 20/200 0.10 6/600.9 20/160 0.125 6/480.8 20/125 0.16 6/380.7 20/100 0.20 6/300.6 20/80 0.25 6/240.5 20/63 0.32 6/200.4 20/50 0.40 6/150.3 20/40 0.50 6/120.2 20/32 0.63 6/100.1 20/25 0.80 6/7.50.0 20/20 1.00 6/6-0.1 20/16 1.25 6/5-0.2 20/12.5 1.60 6/3.75-0.3 20/10 2.00 6/3logMAR, logarithm of the minimum angle of resolution.Theoretically, if visual acuity is tested multiple times on a particular chart, the expected difference should be zero. However, inreality, even in the absence of any clinical change, there is a distribution of scores that reflects the underlying variability in the chartmeasurement. This is called test-retest variability (TRV). The ability to detect true change in vision decreases as the TRV increases.Owing to the deficiencies of the <strong>Snellen</strong> chart, its TRV between visits is very large, varying from ±5 to 16.5 letters in normal subjects,<strong>and</strong> up to 3.3 lines in cataractous, pseudophakic, or early stage glaucoma patients. 6,7 Thus, a person can have up to a 3.5-line change invision <strong>and</strong> this may not even represent true change, but chance. Others have shown that up to 13% of patients can display a 2-linediscrepancy in vision on repeated testing <strong>with</strong> a <strong>Snellen</strong> chart. 8,9 In clinical practice, this may be acceptable; however, in clinicalresearch it is not. The visual outcomes after an intervention should ideally be independent of the chart used. With a <strong>Snellen</strong> chart thismay not be the case.To overcome the deficiencies of the <strong>Snellen</strong> chart, several suggestions have been made to improve chart design <strong>and</strong> measure visualacuity more accurately. The most popular redesign was first proposed by Drs Ian Bailey <strong>and</strong> Jan Lovie in 1976. 1 The Bailey-Loviechart had the following design features: (1) The letters had almost equal legibility. While not the ideal legibility as the “L<strong>and</strong>olt C” orTrans Am Ophthalmol Soc / 107 / 2009 312
PATIENTS AND METHODS<strong>Visual</strong> <strong>Acuity</strong> <strong>Assessment</strong> <strong>with</strong> <strong>Snellen</strong> <strong>and</strong> <strong>ETDRS</strong> <strong>Charts</strong>After Institutional Review Board approval was obtained, a prospective, consecutive, case series was performed between October 2003<strong>and</strong> February 2004 of patients who met the following inclusion criteria: ability to give informed consent, visual acuity better thancounting fingers in their study eye, ability to read English letters, ability to underst<strong>and</strong> <strong>and</strong> comply <strong>with</strong> the vision testing protocols,not enrolled in any current clinical trial, <strong>and</strong> willing to give written informed consent. Patients <strong>with</strong> visual acuity in their right eye ofcounting fingers or worse, or who could not complete the visual testing, were excluded from the study. Because the study wasperformed before registration of clinical trials was routinely required, it was not registered on www.clinicaltrials.gov. Patients werenot screened for ocular pathology before entry into the study. The vision of the right eye of each patient was assessed.VISUAL ACUITY TESTINGThe visual acuity testing was performed at a single seating by the same experienced, certified vision examiner in the same room <strong>with</strong>st<strong>and</strong>ardized low light conditions (approximately 10 cd/m 2 ). Since daily clinical testing in a retina practice does not usually includest<strong>and</strong>ardized visual acuity testing, to reduce variability of these measurements only one experienced, certified visual examiner wasused throughout the study. The vision examiner was certified in the <strong>ETDRS</strong> protocol for multiple, phase III clinical trials, includingthe Treatment of Age-Related Macular Degeneration With Photodynamic Therapy (TAP) Study, Submacular Surgery Trials (SST),<strong>and</strong> the VIP Study, <strong>and</strong> has taught vision examination courses to other vision examiners for their individual study certificationrequirements. Breaks during the testing were allowed as needed. Patients were seated comfortably <strong>with</strong> the charts placed at eye level<strong>and</strong> were told not to lean forward. Testing proceeded slowly at the pace set by the patient.Before visual acuity testing, the certified vision examiner performed a manifest refraction of the right eye (study eye for all patients),<strong>with</strong> the left eye covered, using the <strong>ETDRS</strong> Chart R (catalog No. 2123; Precision Vision, La Salle, Illinois); a description of chartlighting follows. Once the best-corrected manifest refraction was completed, visual acuity testing on the study eye was carried out, onetest immediately after the other, <strong>with</strong> the chart <strong>and</strong> testing method used first, alternating between patients (eg, one patient started <strong>with</strong><strong>Snellen</strong> testing, the next started <strong>with</strong> <strong>ETDRS</strong> chart testing). <strong>Visual</strong> acuity was tested <strong>with</strong> the patients’ pupils in their natural state.<strong>Snellen</strong> Chart TestingUsing the best correction in a trial frame, the <strong>Snellen</strong> chart was presented <strong>with</strong> a projector (Nikon Chart Projector NP-3S; Nikon Inc,Melville, New York) <strong>with</strong> a new halogen bulb (6 volt, 20 watt, 480 lumens; Osram-Sylvania Inc, Danvers, Massachusetts) insertedbefore the study was initiated. A distance of 20 feet was used for testing, <strong>and</strong> the size of the projected letters was compared to theNikon test scale sheet before initiating the study to ensure correct focus <strong>and</strong> magnification of the projector. The vision testing started<strong>with</strong> the top of the chart <strong>and</strong> continued until a line was reached where more than half the letters (eg, 2 of 4, 3 of 5) were readincorrectly or the patient read all letters on the chart. The actual projections consisted of 5 charts: (1) 20/400 line; (2) 20/200 line; (3)20/100, 20/80, <strong>and</strong> 20/70 lines; (4) 20/60, 20/50, <strong>and</strong> 20/40 lines; (5) 20/30, 20/25, <strong>and</strong> 20/20 lines (Figure 1).FIGURE 1<strong>Snellen</strong> projection charts used by the Nikon Chart Projector NP-3S.Only the <strong>Snellen</strong> chart projections were used, <strong>and</strong> the additional features of the projector, including “illiterate E” charts (charts 10, 11,<strong>and</strong> 12), vertical masking, horizontal line masking, <strong>and</strong> single letter isolation, were not used. The luminance of the projected chart wasmeasured by a digital light meter (Sper Scientific, Scottsdale, Arizona) <strong>and</strong> found to be 71 cd/m 2 . Patients were encouraged to guess ifthey were not sure of the letter. If patients could not see the top letter of the chart (20/400), they were presented <strong>with</strong> a single printedletter “E” (20/200) on a card held precisely 10 feet from their head, which was progressively moved forward at 1-foot intervals untilthe patient could correctly identify the direction of the letter. Patients were allowed only a single reading of the chart. The visualacuity was scored using line assignment scoring, <strong>with</strong> the value of the lowest line, where at least half the letters (eg, 2 of 4, 3 of 5)were correctly identified scored as the patient’s visual acuity plus/minus any additional letters seen/not seen on next/previous line (eg,if all letters on the 20/30 line <strong>and</strong> 2 letters were seen on the 20/25 line, the vision was scored as 20/30 +2 ).Trans Am Ophthalmol Soc / 107 / 2009 314
RESULTS<strong>Visual</strong> <strong>Acuity</strong> <strong>Assessment</strong> <strong>with</strong> <strong>Snellen</strong> <strong>and</strong> <strong>ETDRS</strong> <strong>Charts</strong>One hundred sixty-three eyes of 163 patients were included in the study <strong>and</strong> completed visual acuity testing <strong>with</strong> both charts. Therewere 43 men <strong>and</strong> 120 women ranging in age from 18 to 93 years <strong>with</strong> a mean age of 65.6 ± 18.9 years. The age distribution for allpatients is shown in Figure 3. The spherical components of refractive error ranged from +3.50 D to -6.50 D <strong>with</strong> astigmatism up to -2.00 D.FIGURE 3Frequency distribution of ages for all patients in the clinical study.The visual acuity scores for all patients are listed in Table 2. The mean <strong>Snellen</strong> visual acuity was 0.67 ± 0.52 logMAR (range, 0 to2.3; 20/94), <strong>ETDRS</strong> at 4 meters was 0.54 ± 0.48 logMAR (range, 0 to 1.7; <strong>Snellen</strong> equivalent of 20/69), <strong>and</strong> <strong>ETDRS</strong> at 2 meters was0.51 ± 0.47 logMAR (range, 0 to 1.7; <strong>Snellen</strong> equivalent of 20/65). The distribution of visual acuity scores for all patients is shown inFigure 4. The average difference between <strong>Snellen</strong> <strong>and</strong> <strong>ETDRS</strong> charts for all tested eyes was 0.13 ± 0.18 logMAR or 6.5 letters betteron the <strong>ETDRS</strong> chart at 4 meters (P = .000000001) <strong>and</strong> 0.16 ± 0.18 logMAR or 8 letters better on the <strong>ETDRS</strong> chart at 2 meters (P =.000000001). The relationship between measurements of visual acuity score on <strong>ETDRS</strong> charts starting at 4 meters vs 2 meters (Figure5) was very strong (R 2 = 0.9909), <strong>and</strong> the regression slope was significantly different from 1.0 (P < .00001) due to the differences seenin eyes <strong>with</strong> poor acuity. However, since only the <strong>ETDRS</strong> vision starting at 4 meters is accepted by the FDA, all additional analysiswas performed only on the <strong>ETDRS</strong> chart at the 4 meters testing distance.TABLE 2. COMPARISON OF LOGMAR VISUAL ACUITY SCORES FOR SNELLEN AND <strong>ETDRS</strong> CHARTSGROUP* N AGE (yr) SNELLEN† <strong>ETDRS</strong>† DIFFERENCE‡ P VALUEAll eyes 163 65.6±18.9 0.67±0.52 (0 to 2.3) 0.54±0.48 (0 to 1.7) 0.13±0.18 .000000001Good VA 69 64.8±19.9 0.20±0.13 (0 to 0.40) 0.12±0.11 (0 to 0.54) 0.08±0.10 .000000001Intermediate VA 38 52.0±19.1 0.59±0.09 (0.46 to 0.74) 0.49±0.13 (0.14 to 0.7) 0.10±0.15 .00026Poor VA 56 75.4±10.1 1.29±0.31 (0.96 to 2.3) 1.10±0.33 (0.42 to 1.7) 0.20±0.25 .0000002<strong>ETDRS</strong>, Early Treatment Diabetic Retinopathy Study; logMAR, logarithm of the minimum angle of resolution; N, number of eyes;VA, visual acuity.*Good VA is 20/20 to 20/50; intermediate VA is
KaiserVISION SUBGROUPSSince it has been suggested that patients <strong>with</strong> worse visual acuity may have greater visual acuity differences when measured on<strong>Snellen</strong> vs <strong>ETDRS</strong> charts, the patients were retrospectively split into subgroups based on their <strong>Snellen</strong> vision score: good vision(20/20 to 20/50), intermediate vision (
<strong>Visual</strong> <strong>Acuity</strong> <strong>Assessment</strong> <strong>with</strong> <strong>Snellen</strong> <strong>and</strong> <strong>ETDRS</strong> <strong>Charts</strong>The relationship between visual acuity <strong>and</strong> age is shown in Figure 8. As patient age increased, the visual acuity scores worsenedon both charts. To evaluate the effects of age, gender, <strong>and</strong> refraction on the differences seen between the charts, a multivariateANCOVA was performed, which showed that none of the differences were due to these factors.FIGURE 8Logarithm of the minimum angle of resolution (logMAR) visual acuity scores by age for <strong>Snellen</strong><strong>and</strong> Early Treatment Diabetic Retinopathy Study (<strong>ETDRS</strong>) charts. The lines represent theregression line for <strong>Snellen</strong> <strong>and</strong> <strong>ETDRS</strong> charts.DISCUSSIONVision is one of our most important senses. The measurement of vision is the primary outcome of most clinical trials <strong>and</strong> all FDAregistration trials, <strong>and</strong> plays a vital role in our ability to perform daily tasks such as driving. Yet, for all its importance, ourmeasurement of visual acuity is relatively crude. This is important since visual acuity is used to measure both disease <strong>and</strong> change. Notinfrequently, we proudly announce to patients that their vision has improved by 1 or 2 <strong>Snellen</strong> lines, but what does that mean <strong>and</strong> isthis change clinically relevant? Is this difference even real or simply variability inherent to the testing method? <strong>Visual</strong> acuity isessential for clinical trials to measure treatment response. Accurately ascertaining vision is influenced by several factors, includinglight intensity; number, size, contrast, <strong>and</strong> shape of the optotypes; <strong>and</strong> the design of the test chart. The choice of chart ideally shouldnot influence the outcome of the vision measurement. The <strong>Snellen</strong> chart has historically been the most popular visual acuity testingmeasure, but it has considerable flaws. To reduce the variability <strong>and</strong> enhance the precision of vision testing, newer charts have beenproposed. The <strong>ETDRS</strong> chart based on the Bailey-Lovie chart <strong>and</strong> tested using the <strong>ETDRS</strong> protocol, which added a st<strong>and</strong>ardizedadministration <strong>and</strong> scoring of vision, is the current “gold st<strong>and</strong>ard” for vision testing in clinical trials.This is one of the first studies to directly evaluate the difference in visual acuity between the <strong>Snellen</strong> <strong>and</strong> <strong>ETDRS</strong> charts in a “realworld” retina practice <strong>with</strong> a variety of retinal pathologies using the established testing protocols for each chart. Overall, the <strong>ETDRS</strong>chart yielded significantly better visual acuity scores than the <strong>Snellen</strong> chart (P = .000000001). The mean difference was 6.5 letters or1.3 lines. The regression analysis revealed a significant correlation between the visual acuity scores on the 2 charts (R 2 = 0.8839) <strong>with</strong>a slope significantly different from 1 (P < .0001). A similar finding was reported by Falkenstein <strong>and</strong> colleagues, 17 who noted that onaverage the difference between the charts was 2.5 lines. However, there were several important differences between our study <strong>and</strong>theirs.First, Falkenstein <strong>and</strong> colleagues evaluated only older patients <strong>with</strong> AMD, whereas this study evaluated patients of all ages <strong>with</strong>the most common retinal pathologies, including AMD, diabetic retinopathy, <strong>and</strong> macular pathology such as epiretinal membranes. Inthe nonexudative AMD subgroup there was a 6.5 letter difference, <strong>and</strong> in the exudative AMD subgroup, the mean difference wasslightly greater, at 8.5 letters or 1.7 lines. Falkenstein <strong>and</strong> colleagues did not analyze their data based on level of AMD.Second, Falkenstein <strong>and</strong> colleagues used different termination rules than this study. Different termination rules can affect thevariance between visual acuity measures. 22 In this study, the termination rules for the <strong>ETDRS</strong> charts were based on a forced-choiceparadigm where testing continued until the patient made a complete line of errors, or read all the letters on the chart. In contrast,Falkenstein <strong>and</strong> colleagues terminated the test when the patient made >2 errors for lines <strong>with</strong> ≥5 letters, more than 1 error for the lines<strong>with</strong> 3 or 4 letters, or any errors for a line <strong>with</strong> ≤2 letters on the <strong>Snellen</strong> chart or >2 letters on a line on the <strong>ETDRS</strong> chart. This isTrans Am Ophthalmol Soc / 107 / 2009 320
Kaiserdifferent from the <strong>ETDRS</strong> protocol <strong>and</strong> could have led to an artificially larger difference between the charts. Falkenstein <strong>and</strong>colleagues tested only at 2 meters, whereas we tested the <strong>ETDRS</strong> charts at both 4-meter <strong>and</strong> 2-meter starting points. Thus, our studymimics the testing protocol in registration studies (<strong>ETDRS</strong> protocol) <strong>and</strong> may be more representative of the true difference betweenthe two charts.Third, Falkenstein <strong>and</strong> colleagues used the line assignment scoring for both the <strong>Snellen</strong> <strong>and</strong> <strong>ETDRS</strong> charts. The line assignmentmethod is considerably faster than the forced-choice paradigm required by the <strong>ETDRS</strong> protocol. 6 In the line assignment method, thetest is terminated when half or more of the letters are misread on a line, unlike the forced-choice paradigm, where testing continuesuntil an entire line is incorrect. Using the line assignment method increases the TRV. A higher TRV has implications for clinical trialdesign, since increased TRV will necessitate an increased sample size to demonstrate a true clinical change. For the <strong>ETDRS</strong> chart, theTRV is ±0.18 logMAR. 7,21,26 Thus, a change of at least 0.2 logMAR or 10 letters is necessary to exceed the test’s measurement error<strong>and</strong> be deemed a real change. 26 In contrast, the TRV of a <strong>Snellen</strong> chart is ±0.29 to 0.33 logMAR. 6,7 Moreover, the scaling problem ofthe <strong>Snellen</strong> chart means that the minimum clinically significant change, while almost 50% greater than the <strong>ETDRS</strong> chart, cannot bedefined in terms of a consistent number of letters or lines. In this study, we used the single letter forced-choice paradigm for the<strong>ETDRS</strong> charts, which likely made the differences between the two charts lower. More important, by following the <strong>ETDRS</strong> protocol,the differences reported in this study can be used to guide clinicians in interpreting their clinical results on <strong>Snellen</strong> charts, especiallywhen comparing them to published clinical trials.For patients <strong>with</strong> good visual acuity (>20/50), the difference between the <strong>Snellen</strong> <strong>and</strong> <strong>ETDRS</strong> charts was less than 1 line. Whenlooking at the average discrepancy, the differences ranged from 1.5 to 9 letters. This is similar to what Falkenstein <strong>and</strong> colleaguesreported in patients ≥20/30 (3.5 letters). 17 Thus, to answer one question posed in the “Introduction” section of this study, in patients<strong>with</strong> <strong>Snellen</strong> acuities of 20/50 to 20/70, it would be reasonable to consider laser photocoagulation for macular edema due to a branchvein occlusion, since the <strong>ETDRS</strong> protocol cutoff was 20/50 in the BVOS. 25 For clinical trials that call for patients <strong>with</strong> good vision, itis reasonable to assume that the <strong>ETDRS</strong> vision will roughly be <strong>with</strong>in 1 line of the <strong>Snellen</strong> acuity measured in one’s office. The onefactor that may skew these results is the fact that patients in this study were very motivated <strong>and</strong> pushed to obtain the best <strong>Snellen</strong>acuity possible, whereas in clinical practice this is not always the case. Thus, the variability may be slightly greater in clinical practice.On the other end of the scale, there was a greater variation in the visual acuity scores in eyes <strong>with</strong> poor visual acuity. In patients<strong>with</strong> poor acuity (≤20/200), the difference between the two charts was 2 lines. However, in patients who could not read the big “E”(20/400) on the <strong>Snellen</strong> chart, the variability was huge—up to 5 lines. Falkenstein 17 noted a similar discrepancy of 4 lines, <strong>and</strong> DrGary Abram 27 has suggested 3 to 4 lines in exudative AMD patients. The large difference between charts underscores the fact that the<strong>Snellen</strong> chart is unsuitable for patients who have severe vision loss or when evaluating low vision patients. The fact that the greatestdifferences in our study were seen in patients <strong>with</strong> poor visual acuity is not surprising, since the <strong>ETDRS</strong> chart can accurately measurelow visual acuities, whereas on the <strong>Snellen</strong> chart a 1- or 2-letter difference can be huge. The implication of this finding is thatpublished case series <strong>with</strong> low vision patients that use the <strong>Snellen</strong> chart must show at least a 5-line difference for any treatment tohave a clinically meaningful result.Unlike in other studies, patients of all ages were included in this study. As the patients’ age increased, the visual acuities worsened;however, the differences between the charts were not significantly different based on age. This is a known fact, as others have reportedthat logMAR visual acuity testing improves <strong>with</strong> age up to 29 years; thereafter, there is a loss of 0.029 logMAR per decade. 28 Othershave reported similar decay curves <strong>with</strong> age. 29Another goal of this study was to evaluate if there truly was a difference in the visual acuities measured on the <strong>ETDRS</strong> charts thatstart testing at either 4 or 2 meters. This is not an issue for most clinicians in practice but has tremendous importance in registrationtrials, as the FDA now requires all studies to use the 4 meter st<strong>and</strong>ard. In the past, 2 meters could be used, which saved time forpatients <strong>with</strong> poorer vision, since they would not see many letters at 4 meters anyhow. The regression analysis revealed a significantcorrelation between the visual acuity scores between 4 <strong>and</strong> 2 meters (R 2 = 0.9909); however, the slope was significantly different from1.0, indicating that there is a difference between the measurements at 4 <strong>and</strong> 2 meters (P < .0001). In fact, as visual acuity worsened,the differences between the testing distances increased <strong>with</strong> the 2 meter distance having better acuities. Others have noted nodifference in visual acuity scores on <strong>ETDRS</strong> charts as the testing distance was varied. 30 One explanation for the differences seen at 4<strong>and</strong> 2 meters is that patients get tired, incorrectly identifying letters on the 4 meter chart before it is moved to 2 meters, <strong>and</strong> thus theydo not try as hard at 2 meters. In any case, by requiring all studies to be performed at 4 meters, the FDA may have made the ability tosee real change marginally more difficult.Why is all this important? With the increasing reliance on evidenced-based medicine to guide treatment decisions, it is imperativeto be able to compare clinical studies to our own practice. Unfortunately, the measurement of visual acuity in terms of chart type <strong>and</strong>testing method can bias outcomes in clinical studies. For example, most phase III clinical studies rely on <strong>ETDRS</strong> charts <strong>and</strong> protocolacuity examinations, whereas most published case series rely on <strong>Snellen</strong> charts <strong>and</strong> variable vision testing protocols. 22,31 For example,in 128 reports using vision as an outcome in the 5 major ophthalmology journals in 2005, only 58.6% gave the chart design <strong>and</strong>, ofthese, 44% used the <strong>Snellen</strong> chart. 22 Another study found that <strong>Snellen</strong> vision was used in 118 (74%) of 160 studies in the US <strong>and</strong>United Kingdom literature. 31 It is important to remember that one cannot describe <strong>Snellen</strong> visual results in numbers of lines orfractions of lines, yet this is done routinely in the ophthalmic literature. In many of the reports evaluated in these studies, the methodsto determine visual acuity were so poorly described that replication of the studies could not be performed. 22 Some reports converted<strong>and</strong> discussed the results in logMAR format, while others converted <strong>and</strong> discussed the results in decimal format, which is even moreconfusing given the use of logMAR in most reports. Thus, one cannot easily compare the visual outcomes between these studies.An example of where this issue may affect clinical practice is in the field of retina, where numerous studies of bevacizumabTrans Am Ophthalmol Soc / 107 / 2009 321
<strong>Visual</strong> <strong>Acuity</strong> <strong>Assessment</strong> <strong>with</strong> <strong>Snellen</strong> <strong>and</strong> <strong>ETDRS</strong> <strong>Charts</strong>(Avastin; Genentech, South San Francisco, California) have touted similar visual results as the published phase III ranibizumab(Lucentis; Genentech) studies. 32-36 Many Medicare payers have offered to pay for the off-label use of bevacizumab in diagnoses suchas AMD, diabetic retinopathy, <strong>and</strong> vein occlusions based on these small case series. The thinking is that since the drug is very similarto ranibizumab, the phase III ranibizumab results <strong>with</strong> significant improvements in <strong>ETDRS</strong> protocol vision are proof that bevacizumabalso works. In contrast, the case series <strong>with</strong> bevacizumab were largely performed <strong>with</strong> <strong>Snellen</strong> charts. This study indicates that onecannot compare the results of the bevacizumab literature <strong>with</strong> <strong>Snellen</strong> acuity <strong>and</strong> ranibizumab trials measured <strong>with</strong> <strong>ETDRS</strong> protocolvision. Moreover, Falkenstein has suggested that <strong>Snellen</strong> charts are not as sensitive at detecting visual change after treatment <strong>with</strong>anti−vascular endothelial growth factor agents as <strong>ETDRS</strong> charts. 17 Thus, while the drugs may indeed be similar, until we have studiesthat measure acuity <strong>with</strong> <strong>ETDRS</strong> charts, Medicare’s decision may be premature. A 3-line improvement in vision on a <strong>Snellen</strong> chartmay be real or may be due to the variability of the chart, especially for small case series in patients <strong>with</strong> poor baseline vision, <strong>and</strong>cannot be compared to a 3-line improvement in vision in a registration trial or a National Institutes of Health study such as the<strong>ETDRS</strong>. Another example is the numerous reports touting the greater proportion of patients gaining 3 lines of vision after intravitrealtriamcinolone acetonide measured on <strong>Snellen</strong> charts vs the visual acuity results in the <strong>ETDRS</strong> when laser was used. 37-39 Whenintravitreal triamcinolone acetonide was directly compared to laser photocoagulation using <strong>ETDRS</strong> protocol vision in the DiabeticRetinopathy Clinical Research Network study, the results showed that laser worked significantly better. 40 The significant differencesbetween vision measured on the <strong>ETDRS</strong> <strong>and</strong> <strong>Snellen</strong> charts in this study should help clinicians incorporate clinical trial data into theirclinical practice <strong>and</strong> compare case series <strong>with</strong> <strong>Snellen</strong> to large r<strong>and</strong>omized studies <strong>with</strong> <strong>ETDRS</strong> protocol visual acuities. It alsounderscores the importance of critically evaluating the published literature before incorporating therapies into one’s practice.<strong>Snellen</strong> visual acuity has historically been used to evaluate medicolegal decisions, including legal blindness <strong>and</strong> the ability to drivea car. 5 In most states, 20/50 <strong>Snellen</strong> vision in at least one eye is the required st<strong>and</strong>ard for driving; however; when measured on a<strong>Snellen</strong> chart, this cutoff encompasses a wide variety of acuities, some of which could prevent a patient from safely driving a car. 41The visual acuity variability of <strong>Snellen</strong> charts is exceedingly high when patients have poor vision (20/200 <strong>and</strong> 20/400). This isnoteworthy because 20/200 is the legal limit for blindness <strong>and</strong> many statutes rely on demonstrating better or worse vision than thisst<strong>and</strong>ard. Compounding this problem is that low vision patients exhibit a large variability in acuity differences. 42,43 Although we didnot analyze TRV, patients <strong>with</strong> poor vision in this study were significantly more likely to have better vision on the <strong>ETDRS</strong> chartcompared to <strong>Snellen</strong> charts. Thus, to improve the accuracy of determination of legal blindness or whether a patient can drive, we maywant to consider a switch to <strong>ETDRS</strong> charts.This study has several limitations, including the fact that the tests were performed only once, so TRV could not be evaluated. Sincethis study was designed to evaluate vision testing using <strong>Snellen</strong> vs <strong>ETDRS</strong> charts <strong>and</strong> not TRV, repeatability <strong>and</strong> sensitivity could alsonot be tested in this study. The same examiner took all measurements in a short period of time under identical conditions using theinterpolated scoring method to hopefully reduce the variability as much as possible. Unfortunately, since only one examiner was used,we could not evaluate interobserver variation. Another limitation was that in my clinical practice, there are mainly older patients, <strong>and</strong>all patients had retinal problems. Thus, evaluation of visual acuity in patients <strong>with</strong> other ophthalmic problems could not be evaluatedin this study, <strong>and</strong> no children were included in the analysis. Owing to the nature of <strong>Snellen</strong> acuity testing, there were inexact <strong>Snellen</strong>measurements beyond 20/400 when a letter “E” card was used to test vision. Certainly, another option would have been to move thepatient closer to the <strong>Snellen</strong> chart, but since the progression is not linear, the patient would have to be continuously moved as he or sheread down the chart, <strong>and</strong> correlating the final vision would have been impractical. The <strong>Snellen</strong> acuity testing was performed as it isdone in clinical practice using the line assignment, not the single letter method (forced-choice). Some reports have shown that <strong>Snellen</strong>acuity obtained using the single letter method may have a better correlation <strong>with</strong> <strong>ETDRS</strong> testing. Unfortunately, this method is slow<strong>and</strong> impractical, <strong>and</strong> we wanted to mirror “real world” clinical practice <strong>with</strong> our <strong>Snellen</strong> chart testing. The analysis was performedusing the logMAR scores instead of comparing the <strong>Snellen</strong> line assignment scores <strong>with</strong> the <strong>ETDRS</strong> chart data rescored using the lineassignment method. We did this because some investigators have shown that <strong>ETDRS</strong> charts scored in this manner are not as reliable. 2<strong>Visual</strong> acuity relies on psychological <strong>and</strong> physiologic factors that cannot be controlled. For example, a patient’s level of attention,fatigue, underlying competitiveness, <strong>and</strong> determination play an important role in measuring visual acuity. To avoid introducing biasfrom these factors, all patients were given st<strong>and</strong>ardized encouragement during vision testing, <strong>and</strong> the order of charts was changed <strong>with</strong>each patient to hopefully equalize the chance for bias.The <strong>Snellen</strong> chart is the universally accepted method in clinical practice to assess visual acuity despite its known deficiencies,including unreliability <strong>and</strong> poor reproducibility. It is clearly useful to measure general visual acuity in clinical practice. Unfortunately,<strong>Snellen</strong> charts are also the “st<strong>and</strong>ard” in most retrospective case series <strong>and</strong> medicolegal decisions. In these areas, the shortcomings ofthe <strong>Snellen</strong> chart do not allow appropriate quantification of vision. In contrast, the features of the <strong>ETDRS</strong> charts allow precisequantification of vision <strong>and</strong> reliable measures of vision change. As such, it has become the “gold st<strong>and</strong>ard” in clinical research <strong>and</strong> forFDA registration trials in the United States. There are numerous reasons why we have not adopted the <strong>ETDRS</strong> for clinical practice,including the large size of the chart, the unfamiliarity <strong>with</strong> the testing <strong>and</strong> scoring protocol, the time it takes to perform, <strong>and</strong> thenumber of letters on the chart. This study was designed to explore the practical differences between visual acuity scores measured on<strong>Snellen</strong> vs <strong>ETDRS</strong> charts. It demonstrated that there were significant differences in acuity scores obtained between the two charts in a“real world” academic retina practice. This mirrors what other investigators have found. Why, then, do we continue to use the <strong>Snellen</strong>chart in practice <strong>and</strong>, in particular, for most published clinical studies? This is a question that truly perplexes me as a clinicalresearcher. Time <strong>and</strong> convenience should not be relevant when testing visual acuity in ways that may guide clinical practice. Precision<strong>and</strong> accuracy are paramount in this situation, especially when reporting data for public consumption.After this study was completed, we instituted a system-wide initiative to prospectively follow all our surgical <strong>and</strong> refractive laserTrans Am Ophthalmol Soc / 107 / 2009 322
Kaiserpatients’ outcomes <strong>with</strong> <strong>ETDRS</strong> protocol visions. This will allow us to precisely evaluate our own clinical outcomes, improve ouroutcomes over time, <strong>and</strong> benchmark them against other institutions <strong>and</strong> the published literature. Moreover, it will hopefully set ast<strong>and</strong>ard that others will follow. We hope to exp<strong>and</strong> this initiative in the future to all procedures, in particular intravitreal injections<strong>and</strong> retinal <strong>and</strong> glaucoma laser procedures. This is only one institution, <strong>and</strong> a small start, but hopefully it will begin turning the wheelslowly in the right direction to finally move toward a better measure of visual acuity when we describe outcomes of clinical research.ACKNOWLEDGMENTSFunding/Support: None.Financial Disclosures: None.Conformity With Author Information: This study was approved by the Clevel<strong>and</strong> Clinic Institutional Review Board.REFERENCES1. Bailey IL, Lovie JE. New design principles for visual acuity letter charts. Am J Optometry Physiol Opt 1976;53:740-745.2. McMonnies CW. Chart construction <strong>and</strong> letter legibility/readability. Ophthalmic Physiol Opt 1999;19:498-506.3. McMonnies CW, Ho A. Letter legibility <strong>and</strong> chart equivalence. Ophthalmic Physiol Opt 2000;20:142-152.4. Flom MC, Heath G, Takahashi E. Contour interaction <strong>and</strong> visual resolution: contralateral effect. Science 1963;142:979-980.5. Leinonen J, Laakkonen E, Laatikainen L. R<strong>and</strong>om measurement error in visual acuity measurement in clinical settings. ActaOphthalmol Sc<strong>and</strong> 2005;83:328-332.6. Laidlaw DA, Abbott A, Rosser DA. Development of a clinically feasible logMAR alternative to the <strong>Snellen</strong> chart: performanceof the “compact reduced logMAR” visual acuity chart in amblyopic children. Br J Ophthalmol 2003;87:1232-1234.7. Rosser DA, Laidlaw DA, Murdoch IE. The development of a “reduced logMAR” visual acuity chart for use in routine clinicalpractice. Br J Ophthalmol 2001;85:432-436.8. Knudsen LL. <strong>Visual</strong> acuity testing in diabetic subjects: the decimal progression chart versus the Freiburg visual acuity test.Graefes Arch Clin Exp Ophthalmol 2003;241:615-618.9. Gibson SA, S<strong>and</strong>erson HF. Observer variation in ophthalmology. Br J Ophthalmol 1980;64:457-460.10. Sloan LL, Rowl<strong>and</strong> WM, Altman A. Comparison of three types of test target for the measurement of visual acuity. Q RevOphthalmol 1952;8:4-16.11. Raasch TW, Bailey IL, Bullimore MA. Repeatability of visual acuity measurement. Optom Vis Sci 1998;75:342-348.12. Siderov J, Tiu AL. Variability of measurements of visual acuity in a large eye clinic. Acta Ophthalmol Sc<strong>and</strong> 1999;77:673-676.13. Ferris FL, Bailey I. St<strong>and</strong>ardizing the measurement of visual acuity for clinical research studies. Ophthalmology 1996;103:181-182.14. Ferris FL, Kassoff A, Bresnick GH, Bailey I. New visual acuity charts for clinical research. Am J Ophthalmol 1982;94:91-96.15. Ferris FL, Sperduto RD. St<strong>and</strong>ardized illumination for visual acuity testing in clinical research. Am J Ophthalmol 1982;94:97-98.16. Cotter SA, Chu RH, Ch<strong>and</strong>ler DL, et al. Reliability of the electronic Early Treatment Diabetic Retinopathy Study testingprotocol in children 7 to
<strong>Visual</strong> <strong>Acuity</strong> <strong>Assessment</strong> <strong>with</strong> <strong>Snellen</strong> <strong>and</strong> <strong>ETDRS</strong> <strong>Charts</strong>28. Elliott DB, Yang KC, Whitaker D. <strong>Visual</strong> acuity changes throughout adulthood in normal, healthy eyes: seeing beyond 6/6.Optom Vis Sci 1995;72:186-191.29. Wood J, Bullimore M. Changes in the lower displacement limit for motion <strong>with</strong> age. Ophthalmic Physiol Opt 1995;15:31-36.30. Pieh S, Kellner C, Hanselmayer G, et al. Comparison of visual acuities at different distances <strong>and</strong> defocus curves. J CataractRefract Surg 2002;28:1964-1967.31. Moutray TN, Williams MA, Jackson AJ. Change of visual acuity recording methods in clinical studies across the years.Ophthalmologica 2008;222:173-177.32. Bashshur ZF, Haddad ZA, Schakal A, Jaafar RF, Saab M, Noureddin BN. Intravitreal bevacizumab for treatment of neovascularage-related macular degeneration: a one-year prospective study. Am J Ophthalmol 2008;145:249-256.33. Brown DM, Kaiser PK, Michels M, et al. Ranibizumab versus verteporfin for neovascular age-related macular degeneration. NEngl J Med 2006;355:1432-1444.34. Pedersen R, Soliman W, Lund-Andersen H, Larsen M. Treatment of choroidal neovascularization using intravitrealbevacizumab. Acta Ophthalmol Sc<strong>and</strong> 2007;85:526-533.35. Rosenfeld PJ, Brown DM, Heier JS, et al. Ranibizumab for neovascular age-related macular degeneration. N Engl J Med2006;355:1419-1431.36. Rosenfeld PJ, Rich RM, Lalwani GA. Ranibizumab: Phase III clinical trial results. Ophthalmol Clin North Am 2006;19:361-372.37. Early Treatment Diabetic Retinopathy Study Research Group. Photocoagulation for diabetic macular edema. Early treatmentDiabetic Retinopathy Study report number 1. Arch Ophthalmol 1985;103:1796-1806.38. Karacorlu M, Ozdemir H, Karacorlu S, Alacali N, Mudun B, Burumcek E. Intravitreal triamcinolone as a primary therapy indiabetic macular oedema. Eye 2005;19:382-386.39. Er H, Yilmaz H. Intravitreal cortisone injection for refractory diffuse diabetic macular edema. Ophthalmologica 2005;219:394-400.40. Diabetic Retinopathy Clinical Research Network. A r<strong>and</strong>omized trial comparing intravitreal triamcinolone acetonide <strong>and</strong>focal/grid photocoagulation for diabetic macular edema. Ophthalmology 2008;115:1447-1449.e1-10.41. Currie Z, Bhan A, Pepper I. Reliability of <strong>Snellen</strong> charts for testing visual acuity for driving: prospective study <strong>and</strong> postalquestionnaire. BMJ 2000;321:990-992.42. Kiser AK, Mladenovich D, Eshraghi F, Bourdeau D, Dagnelie G. Reliability <strong>and</strong> consistency of visual acuity <strong>and</strong> contrastsensitivity measures in advanced eye disease. Optom Vis Sci 2005;82:946-954.43. Blackhurst DW, Maguire MG. Reproducibility of refraction <strong>and</strong> visual acuity measurement under a st<strong>and</strong>ard protocol. Retina1989;9:163-169.Trans Am Ophthalmol Soc / 107 / 2009 324


