Visual Acuity Assessment with Snellen and ETDRS Charts
Visual Acuity Assessment with Snellen and ETDRS Charts
Visual Acuity Assessment with Snellen and ETDRS Charts
- No tags were found...

You also want an ePaper? Increase the reach of your titles
YUMPU automatically turns print PDFs into web optimized ePapers that Google loves.
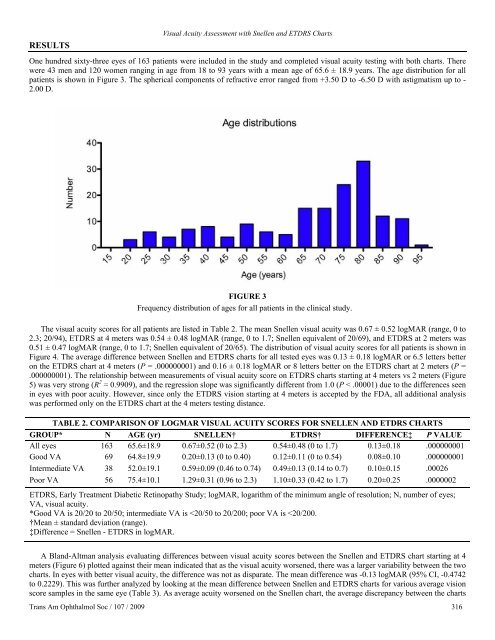
RESULTS<strong>Visual</strong> <strong>Acuity</strong> <strong>Assessment</strong> <strong>with</strong> <strong>Snellen</strong> <strong>and</strong> <strong>ETDRS</strong> <strong>Charts</strong>One hundred sixty-three eyes of 163 patients were included in the study <strong>and</strong> completed visual acuity testing <strong>with</strong> both charts. Therewere 43 men <strong>and</strong> 120 women ranging in age from 18 to 93 years <strong>with</strong> a mean age of 65.6 ± 18.9 years. The age distribution for allpatients is shown in Figure 3. The spherical components of refractive error ranged from +3.50 D to -6.50 D <strong>with</strong> astigmatism up to -2.00 D.FIGURE 3Frequency distribution of ages for all patients in the clinical study.The visual acuity scores for all patients are listed in Table 2. The mean <strong>Snellen</strong> visual acuity was 0.67 ± 0.52 logMAR (range, 0 to2.3; 20/94), <strong>ETDRS</strong> at 4 meters was 0.54 ± 0.48 logMAR (range, 0 to 1.7; <strong>Snellen</strong> equivalent of 20/69), <strong>and</strong> <strong>ETDRS</strong> at 2 meters was0.51 ± 0.47 logMAR (range, 0 to 1.7; <strong>Snellen</strong> equivalent of 20/65). The distribution of visual acuity scores for all patients is shown inFigure 4. The average difference between <strong>Snellen</strong> <strong>and</strong> <strong>ETDRS</strong> charts for all tested eyes was 0.13 ± 0.18 logMAR or 6.5 letters betteron the <strong>ETDRS</strong> chart at 4 meters (P = .000000001) <strong>and</strong> 0.16 ± 0.18 logMAR or 8 letters better on the <strong>ETDRS</strong> chart at 2 meters (P =.000000001). The relationship between measurements of visual acuity score on <strong>ETDRS</strong> charts starting at 4 meters vs 2 meters (Figure5) was very strong (R 2 = 0.9909), <strong>and</strong> the regression slope was significantly different from 1.0 (P < .00001) due to the differences seenin eyes <strong>with</strong> poor acuity. However, since only the <strong>ETDRS</strong> vision starting at 4 meters is accepted by the FDA, all additional analysiswas performed only on the <strong>ETDRS</strong> chart at the 4 meters testing distance.TABLE 2. COMPARISON OF LOGMAR VISUAL ACUITY SCORES FOR SNELLEN AND <strong>ETDRS</strong> CHARTSGROUP* N AGE (yr) SNELLEN† <strong>ETDRS</strong>† DIFFERENCE‡ P VALUEAll eyes 163 65.6±18.9 0.67±0.52 (0 to 2.3) 0.54±0.48 (0 to 1.7) 0.13±0.18 .000000001Good VA 69 64.8±19.9 0.20±0.13 (0 to 0.40) 0.12±0.11 (0 to 0.54) 0.08±0.10 .000000001Intermediate VA 38 52.0±19.1 0.59±0.09 (0.46 to 0.74) 0.49±0.13 (0.14 to 0.7) 0.10±0.15 .00026Poor VA 56 75.4±10.1 1.29±0.31 (0.96 to 2.3) 1.10±0.33 (0.42 to 1.7) 0.20±0.25 .0000002<strong>ETDRS</strong>, Early Treatment Diabetic Retinopathy Study; logMAR, logarithm of the minimum angle of resolution; N, number of eyes;VA, visual acuity.*Good VA is 20/20 to 20/50; intermediate VA is