Appendix Table - Harvard Medical School - Health Care Policy
Appendix Table - Harvard Medical School - Health Care Policy
Appendix Table - Harvard Medical School - Health Care Policy

You also want an ePaper? Increase the reach of your titles
YUMPU automatically turns print PDFs into web optimized ePapers that Google loves.
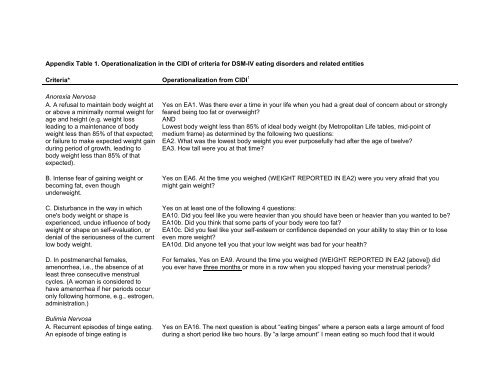
year longer than the period encompassed by anorexia nervosa.Binge Eating DisorderA. Same as criterion A for bulimianervosa (see above)B. Binge eating episodes areassociated with three or more of thefollowing:(1) Eating much more rapidly thannormal(2) Eating until feeling uncomfortablyfull(3) Eating large amounts of food whennot physically hungry(4) Eating alone because of beingembarrassed by how much one iseating(5) Feeling disgusted with oneself,depressed, or very guilty afterovereatingC. Marked distress regarding bingeeating is presentD. Binge eating occurs, on average, atleast 2 days a week for six monthsE. The binge eating is not associatedwith the regular use of inappropriatecompensatory behavior (i.e. purging,excessive exercise, etc.) and does notoccur exclusively during the course ofbulimia nervosa or anorexia nervosa.Same as that corresponding to criterion A for bulimia nervosa (see above)Yes on at least three of the following five questions:EA17. During the binges did you usually eat much more quickly than usual?EA17a. Did you usually eat until you felt uncomfortably full?EA17b. Did you usually continue to eat even when you didn’t feel hungry?EA17c. Did you usually eat alone because you were embarrassed by how much you ate?EA17d. Did you feel guilty, very upset with yourself, or depressed after you binged?Yes on at least one of the following four questions indicative of distress:EA17d. Did you feel guilty, very upset with yourself, or depressed after you binged?EA17e. Around the time you were binge eating, were you very afraid that you would gain weight?EA17g. Did you worry about the long term effects of binging on your health, on your weight, or on yourbody shape?EA17h. Did you often get upset both during and after binges that your eating was out of your control?Acknowledging that binge eating occurred at least two times a week for at least three months, asreflected by providing of age of onset in EA19a or EA19b. 3In cases that met criteria for anorexia nervosa or bulimia nervosa, as defined above, there was evidencethat binge eating was present at times when anorexia nervosa and bulimia nervosa were absent, asevidenced by:1. Onset of binge eating twice weekly or more at least one year prior to onset of anorexia nervosa ofbulimia nervosa;2. Most recent binge eating twice weekly or more at least one year after most recent episode of anorexianervosa or bulimia nervosa; or
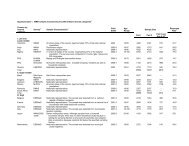
<strong>Appendix</strong> table 3. Cross-sectional socio-demographic profile of respondents with lifetime DSM-IV eating disorders and related entities 1AnorexiaNervosaBulimia Nervosa Binge EatingDisorderSubthreshold BingeEating DisorderAny BingeEatingOR (95% CI) OR (95% CI) OR (95% CI) OR (95% CI) OR (95% CI)Race-ethnicityNon-Hispanic White 1.0 -- 1.0 -- 1.0 -- 1.0 -- 1.0 --Non-Hispanic Black 0.8 (0.3-2.2) 0.7 (0.4-1.4) 1.9 (0.5-7.1) 0.9 (0.4-1.7)Hispanic 0.1* 2 (0.0-0.7) 2.0 (0.4-11.1) 1.0 (0.3-3.3) 1.0 (0.2-5.2) 1.0 (0.6-2.1)Other 0.5 (0.1-3.6) 2.4 (0.9-6.0) 0.5 (0.1-2.4) 0.8 (0.2-3.2) 0.7 (0.3-1.8) 2 3 (p-value) 6.0 (0.050) 4.5 (0.214) 1.7 (0.639) 1.3 (.739) 0.8 (.839)EducationLess than high school 0.2 (0.0-2.4) 1.3 (0.4-4.1) 2.0 (0.7-5.3) 1.9 (0.4-10.0) 1.8 (1.0-3.4)High school graduate 0.9 (0.4-1.8) 0.4* (0.2-1.0) 0.8 (0.3-2.1) 1.7 (0.5-6.7) 0.9 (0.5-1.6)Some post-HS education 1.0 (0.3-3.7) 1.3 (0.6-2.7) 1.6 (0.8-3.5) 2.2 (0.7-7.0) 1.5 (0.9-2.4)College graduate 1.0 -- 1.0 -- 1.0 -- 1.0 -- 1.0 -- 2 3 (p-value) 2.1 (0.554) 8.0* (0.047) 12.7* (0.005) 2.1 (.561) 17.4* (.001)Marital statusPreviously married 0.8 (0.2-4.1) 1.8 (0.8-3.9) 0.9 (0.5-1.6) 0.8 (0.3-1.7) 1.0 (0.7-1.6)Never married 0.2* (0.0-0.8) 0.2* (0.1-0.5) 0.9 (0.6-1.4) 0.6 (0.3-1.2) 0.7* (0.5-0.9)Married-cohabitating 1.0 -- 1.0 -- 1.0 -- 1.0 -- 1.0 -- 2 2 (p-value) 6.6* (0.038) 14.8* (0.001) 0.3 (0.841) 2.1 (.347) 7.2* (.027)Employment statusEmployed 1.0 -- 1.0 -- 1.0 -- 1.0 -- 1.0 --Student 6.9* (1.1-44.2) 0.6 (0.1-5.3) 1.2 (0.3-5.6) 4.2 (0.7-24.6) 2.0 (0.9-4.3)Homemaker 4.3* (1.5-12.9) 1.0 (0.4-2.2) 0.5 (0.1-1.7) 0.7 (0.1-3.2) 0.7 (0.3-1.3)Retired 7.6 (0.4-143.3) 1.8 (0.2-15.9) 0.2* (0.0-0.7) 0.8 (0.2-3.6)Other 0.7 3 (0.1-7.6) 2.5* (1.1-5.7) 1.7 (0.8-3.6) 2.1 (0.6-7.5) 2.1* (1.4-3.2) 2 4 (p-value) 16.6* (0.001) 6.9 (0.141) 4.5 (0.338) 9.7* (.046) 19.9* (.001)Abbreviations: CI, confidence interval; OR, odds ratio.*Significant at the .05 level, 2-sided test1 Controlling for age and sex in every model2 Non-Hispanic Blacks and Hispanics were collapsed in this equation because of sparse data.3 Variables Retired and Other were collapsed in this equation because of sparse data.
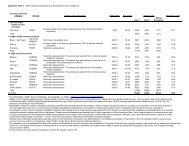
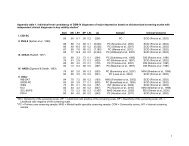
<strong>Appendix</strong> table 4. Lifetime prevalence estimates of DSM-IV eating disorders and related entities by age and sexAnorexia Bulimia Binge EatingSubthresholdBinge EatingAny BingeEatingNervosa Nervosa Disorder Disorder% (se) % (se) % (se) % (se) % (se) (n)A. Males18-29 0.0 -- 0.1 0.1 1.4 0.7 2.7 (1.0) 4.1 (1.2) (288)30-44 0.6 0.4 0.1 0.1 2.5 0.8 2.1 (1.0) 4.6 (1.3) (403)45-59 0.0 -- 1.3 0.9 2.6 1.2 1.6 (0.8) 4.4 (1.6) (339)60+ 0.0 -- 0.3 0.3 0.9 0.5 1.1 (0.9) 2.3 (1.0) (190)Total 0.2 0.1 0.5 0.2 1.9 0.5 1.9 (0.5) 4.0 (0.7) (1220) 2 3 (age) -- 5.2 3.6 1.4 1.9B. Females18-29 0.9 0.4 2.2 0.5 3.8 0.7 0.8 (0.4) 6.2 (0.9) (417)30-44 0.9 0.5 2.0 0.6 3.5 1.0 0.8 (0.3) 5.9 (1.2) (564)45-59 0.6 0.3 1.6 0.5 2.7 0.7 0.4 (0.2) 4.4 (0.9) (462)60+ 0.8 0.8 0.0 -- 2.4 1.1 0.5 (0.3) 2.9 (1.1) (317)Total 0.8 0.3 1.5 0.3 3.1 0.5 0.6 (0.1) 4.9 (0.6) (1760) 2 3 (age) 0.5 6.9* 1 1.1 1.3 3.3C. Total18-29 0.5 0.2 1.2 0.3 2.7 0.5 1.7 (0.5) 5.2 (0.7) (705)30-44 0.8 0.3 1.1 0.3 3.0 0.7 1.4 (0.5) 5.3 (0.9) (967)45-59 0.3 0.2 1.4 0.5 2.6 0.5 0.9 (0.4) 4.4 (0.8) (801)60+ 0.5 0.5 0.1 0.1 1.7 0.7 0.8 (0.4) 2.7 (0.7) (507)Total 0.5 0.2 1.0 0.2 2.6 0.3 1.2 (0.2) 4.5 (0.4) (2980) 2 3 (age) 1.9 5.1 1.6 2.2 5.2Abbreviations: SE, standard error.*Significant age difference based on a .05 level, 2 3 test.degrees of freedom = 2
<strong>Appendix</strong> table 5. Twelve-month prevalence estimates of DSM-IV eating disorders and related entities by age and sexBulimiaNervosaBinge EatingDisorderSubthreshold BingeEating DisorderAny BingeEating% (se) % (se) % (se) % (se) (n)A. Males18-29 0.0 -- 0.1 (0.1) 0.6 (0.4) 0.7 (0.4) (288)30-44 0.0 -- 0.9 (0.4) 0.9 (0.4) 1.8 (0.6) (403)45-59 0.0 -- 1.6 (1.1) 0.9 (0.7) 2.6 (1.3) (339)60+ 0.3 (0.3) 0.4 (0.4) 0.8 (0.8) 1.5 (0.9) (190)Total 0.1 (0.1) 0.8 (0.3) 0.8 (0.3) 1.7 (0.4) (1220) 2 3 (age) -- 5.7 0.9 4.9B. Females18-29 0.6 (0.3) 2.4 (0.7) 0.6 (0.4) 3.6 (0.7) (417)30-44 0.7 (0.3) 1.3 (0.4) 0.4 (0.2) 2.5 (0.6) (564)45-59 0.7 (0.4) 1.5 (0.6) 0.1 (0.1) 2.3 (0.7) (462)60+ 0.0 -- 1.2 (0.6) 0.3 (0.2) 1.5 (0.6) (317)Total 0.5 (0.2) 1.6 (0.2) 0.4 (0.1) 2.5 (0.3) (1760) 2 3 (age) 1.1 1 3.1 1.8 4.0C. Total18-29 0.3 (0.2) 1.4 (0.4) 0.6 (0.3) 2.3 (0.4) (705)30-44 0.4 (0.2) 1.1 (0.3) 0.6 (0.2) 2.2 (0.4) (967)45-59 0.4 (0.2) 1.5 (0.3) 0.5 (0.4) 2.4 (0.5) (801)60+ 0.1 (0.1) 0.8 (0.4) 0.5 (0.4) 1.5 (0.5) (507)Total 0.3 (0.1) 1.2 (0.2) 0.6 (0.2) 2.1 (0.2) (2980) 2 3 (age) 0.9 1.6 0.1 1.7Abbreviations: SE, standard error.*Significant age difference based on a .05 level, 2 3 test.Degrees of freedom = 2
<strong>Appendix</strong> <strong>Table</strong> 6. Age-of-onset priority of DSM-IV eating disorders and related entities with comorbid DSM-IV disordersPercent where eating disorders or behavior are temporally primary*SubthresholdAnorexia Nervosa Bulimia Nervosa Binge EatingDisorderBinge EatingDisorderAny BingeEating% (se) (n) % (se) (n) % (se) (n) % (se) (n) % (se) (n)Anxiety disorders 11.0 (10.6) (13) 19.7 (9.2) (41) 7.2 (2.6) (71) 4.0 (3.8) (27) 13.0 (3.8) (127)Mood disorders 70.1 (14.8) (14) 70.8 (9.2) (36) 33.5 (8.6) (51) 39.6 (13.5) (20) 48.9 (5.9) (100)Impulse-control disorders 0.0 -- (6) 0.0 -- (21) 5.3 (3.6) (34) 12.5 (7.6) (15) 5.8 (2.3) (75)Substance use disorders 61.8 (16.9) (9) 71.0 (12.1) (18) 26.3 (8.2) (29) 50.0 (14.7) (17) 52.7 (8.2) (62)Abbreviations: SE, standard error.*Based on comparison of retrospective age-of-onset reports for eating disorders and the earliest comorbid disorder in the category; percent isamong individuals who had both an eating disorder and the comorbid other disorder under consideration.
<strong>Appendix</strong> <strong>Table</strong> 7. Estimated age of onset and persistence of DSM-IV eating disorders by lifetime treatment statusAnorexia Nervosa Bulimia Nervosa Binge Eating DisorderI. Means Mean (se) Mean (se) Mean (se)A. TreatedAge of onset 17.8 (1.3) 20.0 (1.1) 25.2 (1.1)Years with episode 5.0 (2.6) 16.2* (1.4) 16.7* (1.7)B. UntreatedAge of onset 19.7 (0.9) 17.8 (1.0) 25.7 (1.2)Years with episode 2.2 (0.4) 12.1* (2.1) 7.8* (0.8)C. TotalAge of onset 19.1 (0.4) 18.8 (1.0) 25.5 (0.9)Years with episode 3.1 (0.1) 13.9* (1.5) 11.5* (1.1)II. Medians Median (IQR) Median (IQR) Median (IQR)A. TreatedAge of onset 15.8 (13.7-21.0) 17.4* (15.2-22.8) 20.7* (15.0-29.8)Years with episode 1.0 (1.0-2.0) 17.9* (1.8-25.5) 10.5* (2.6-29.4)B. UntreatedAge of onset 19.7 (16.0-21.4) 16.6* (11.1-19.4) 20.2* (17.0-33.6)Years with episode 1.0 (1.0-1.0) 7.8* (2.9-21.7) 2.8* (0.0-13.3)C. TotalAge of onset 19.2 (15.2-21.3) 16.9 (13.8-20.0) 20.7 (16.6-33.2)Years with episode 1.0 (1.0-1.1) 10.4* (2.6-23.8) 6.3* (0.4-16.6)(n) (21) (52) (104)Abbreviations: SE, standard error.*Significantly different from anorexia nervosa based on a .05 level, 2-sided test.
<strong>Appendix</strong> table 8. Lifetime and 12-month treatment of DSM-IV eating disorders – FEMALEAnorexia Nervosa Bulimia Nervosa Binge Eating Disorder% (se) % (se) % (se)I. Lifetime treatment of emotional problem among lifetime casesGeneral medical 47.6 (15.2) 49.4 (10.8) 40.8 (7.1)Mental health specialty 44.9 (14.1) 66.1 (9.0) 58.0 (7.5)Human services 15.7 (9.7) 16.3 (6.5) 22.7 (6.8)Complementary-alternative medicine 21.5 (10.8) 24.8 (6.9) 25.2 (6.0)Any 69.8 (12.2) 74.5 (9.1) 78.3 (5.9)(n) 18 45 74II. Twelve-month treatment of emotional problems among 12-month casesGeneral medical 28.2 (15.1) 26.6 (7.8)Mental health 9.7 (5.8) 24.9 (8.3)Human services 14.5 (10.8) 8.5 (6.7)Complementary-alternative medicine 0.0 (0.0) 16.8 (7.6)Any 37.0 (16.5) 50.1 (8.5)(n) 15 38III. Treatment of eating disorderLifetime among lifetime cases 32.0 (13.5) 47.0 (8.5) 49.0 (8.0)Twelve-month among 12-month cases 11.0 (5.4) 10.0 (4.3)
<strong>Appendix</strong> table 9. Lifetime and 12-month treatment of DSM-IV eating disorders – MALEAnorexia Nervosa Bulimia Nervosa Binge Eating Disorder% (se) % (se) % (se)I. Lifetime treatment of emotional problem among lifetime casesGeneral medical 67.8 (26.7) 22.9 (15.8) 22.8 (7.5)Mental health specialty 100.0 (0.0) 75.8 (17.0) 56.3 (12.3)Human services 0.0 (0.0) 9.6 (10.1) 17.4 (7.0)Complementary-alternative medicine 31.8 (26.6) 9.6 (10.1) 10.3 (5.6)Any 100.0 (0.0) 82.5 (14.5) 74.4 (9.9)(n) 3 7 30II. Twelve-month treatment of emotional problems among 12-month casesGeneral medical 0.0 (0.0) 11.4 (8.8)Mental health 0.0 (0.0) 26.8 (15.2)Human services 0.0 (0.0) 5.0 (5.1)Complementary-alternative medicine 0.0 (0.0) 11.8 (8.5)Any 0.0 (0.0) 38.2 (16.7)(n) 1 13III. Treatment of eating disorderLifetime among lifetime cases 31.8 (26.6) 29.1 (19.3) 27.5 (9.5)Twelve-month among 12-month cases 0.0 (0.0) 0.0 (0.0)
<strong>Appendix</strong> <strong>Table</strong> 10. Current body mass index (BMI) among respondents with versus without DSM-IV/CIDI bulimia nervosa (BN) and bingeeating disorder (BED) in the NCSR surveyBN BEDNo eatingdisorderLifetime 12-month Lifetime 12-month% (se) % (se) % (se) % (se) % (se)I. Distribution of BMI< 18.5 (underweight) 3.4 (2.5) -- -- -- -- -- -- 2.0 (0.4)18.5-24.9 (normal) 31.8 (5.6) 15.3* (9.5) 21.1* (5.0) 19.0* (4.4) 36.7 (1.5)25 – 29.9 (overweight) 34.4 (9.1) 42.2 (13.4) 39.2 (7.6) 35.7 (10.2) 36.2 (1.2)30 – 34.9 (obese class I) 10.2 (4.4) 3.5*,** (3.5) 21.4 (6.4) 25.6 (7.4) 15.1 (1.2)35 – 39.9 (obese class II) 10.1 (4.7) 20.3 (13.4) 4.5 (1.9) 3.6 (1.9) 6.2 (0.7)40+ (obese class III) 10.0 (4.9) 18.7 (11.4) 13.9* (4.5) 16.2 (7.6) 3.8 (0.5)35+ (obese class II-III) 20.2 (5.5) 39.0* (14.0) 18.4 (4.5) 19.8 (7.6) 10.0 (0.8)30+ (total obese) 30.3 (7.4) 42.4 (14.3) 39.8 (7.4) 45.4 (10.5) 25.1 (1.5)II. Logistic regression of BN or BED (vs. No lifetime eating disorder) on BMI 1OR (95% CI) OR (95% CI) OR (95% CI) OR (95% CI)< 18.5 (underweight) 2.0 (0.4-9.3) -- -- -- -- -- --18.5-24.9 (normal) 1.0 -- 1.0 -- 1.0 -- 1.0 --25 – 29.9 (overweight) 1.1 (0.5-2.5) 2.8 (0.6-13.3) 1.9 (0.9-4.0) 1.9 (0.8-4.4)30 – 34.9 (obese class I) 0.8 (0.3-1.8) 0.6 (0.0-7.2) 2.5* (1.1-5.7) 3.3* (1.4-7.5)35 – 39.9 (obese class II) 1.9 (0.6-6.0) 7.8 (0.9-65.4) 1.3 (0.4-3.8) 1.1 (0.3-3.8)40+ (obese class III) 3.1* (1.1-8.9) 11.8* (1.7-81.3) 6.4* (3.0-13.9) 8.3* (2.9-23.7) 2 5 9.4 36.8* 45.9* 49.1*(n) (52) (16) (104) (51) (2,819)*Significant difference from respondents who had no lifetime eating disorder at the .05 level, two-sided test.**Significant difference between BN and BED at the .05 level, two-sided test1Based on a series of logistic regression models, each one comparing respondents with the eating disorder defined by the column headingwith respondents without a history of eating disorders