Strategies for Reducing the Climate Impacts of Red Meat ... - WWF UK
Strategies for Reducing the Climate Impacts of Red Meat ... - WWF UK
Strategies for Reducing the Climate Impacts of Red Meat ... - WWF UK

Create successful ePaper yourself
Turn your PDF publications into a flip-book with our unique Google optimized e-Paper software.
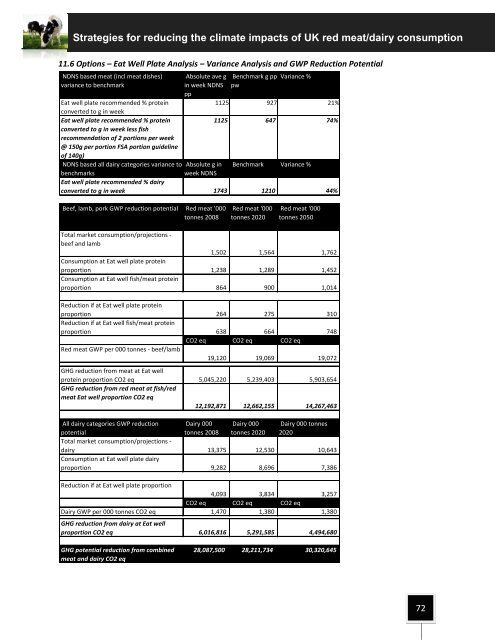
<strong>Strategies</strong> <strong>for</strong> reducing <strong>the</strong> climate impacts <strong>of</strong> <strong>UK</strong> red meat/dairy consumption11.6 Options – Eat Well Plate Analysis – Variance Analysis and GWP <strong>Red</strong>uction PotentialNDNS based meat (incl meat dishes)variance to benchmarkAbsolute ave gin week NDNSppBenchmark g pppwVariance %Eat well plate recommended % protein1125 927 21%converted to g in weekEat well plate recommended % protein1125 647 74%converted to g in week less fishrecommendation <strong>of</strong> 2 portions per week@ 150g per portion FSA portion guideline<strong>of</strong> 140g)NDNS based all dairy categories variance to Absolute g in Benchmark Variance %benchmarksweek NDNSEat well plate recommended % dairyconverted to g in week 1743 1210 44%Beef, lamb, pork GWP reduction potential <strong>Red</strong> meat '000tonnes 2008<strong>Red</strong> meat '000tonnes 2020<strong>Red</strong> meat '000tonnes 2050Total market consumption/projections -beef and lamb1,502 1,564 1,762Consumption at Eat well plate proteinproportion 1,238 1,289 1,452Consumption at Eat well fish/meat proteinproportion 864 900 1,014<strong>Red</strong>uction if at Eat well plate proteinproportion 264 275 310<strong>Red</strong>uction if at Eat well fish/meat proteinproportion 638 664 748CO2 eq CO2 eq CO2 eq<strong>Red</strong> meat GWP per 000 tonnes - beef/lamb19,120 19,069 19,072GHG reduction from meat at Eat wellprotein proportion CO2 eq 5,045,220 5,239,403 5,903,654GHG reduction from red meat at fish/redmeat Eat well proportion CO2 eq12,192,871 12,662,155 14,267,463All dairy categories GWP reductionpotentialDairy 000tonnes 2008Dairy 000tonnes 2020Dairy 000 tonnes2020Total market consumption/projections -dairy 13,375 12,530 10,643Consumption at Eat well plate dairyproportion 9,282 8,696 7,386<strong>Red</strong>uction if at Eat well plate proportion4,093 3,834 3,257CO2 eq CO2 eq CO2 eqDairy GWP per 000 tonnes CO2 eq 1,470 1,380 1,380GHG reduction from dairy at Eat wellproportion CO2 eq 6,016,816 5,291,585 4,494,680GHG potential reduction from combinedmeat and dairy CO2 eq28,087,500 28,211,734 30,320,64572