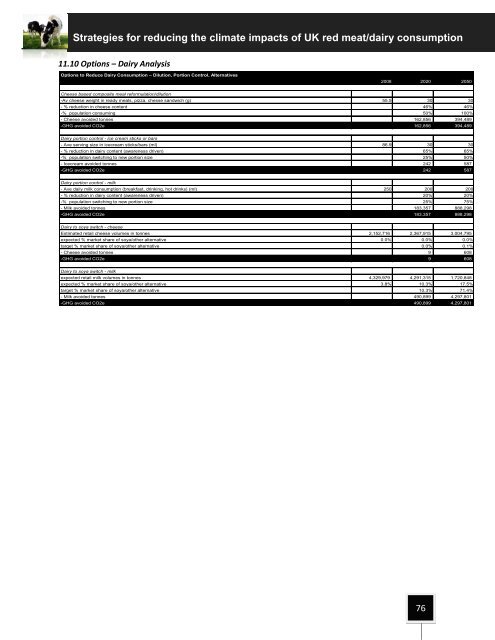
<strong>Strategies</strong> <strong>for</strong> reducing <strong>the</strong> climate impacts <strong>of</strong> <strong>UK</strong> red meat/dairy consumption11.10 Options – Dairy AnalysisOptions to <strong>Red</strong>uce Dairy Consumption – Dilution, Portion Control, Alternatives2008 2020 2050Cheese based composite meal re<strong>for</strong>mulation/dilution-Av cheese weight in ready meals, pizza, chesse sandwich (g) 55.5 30 30- % reduction in cheese content 46% 46%-% population consuming 50% 100%- Cheese avoided tonnes 162,856 394,489-GHG avoided CO2e 162,856 394,489Dairy portion control - ice cream sticks or bars- Ave serving size in icecream sticks/bars (ml) 86.9 30 30- % reduction in dairy content (awareness driven) 65% 65%-% population switching to new portion size 25% 50%- Icecream avoided tonnes 242 587-GHG avoided CO2e 242 587Dairy portion control - milk- Ave daily milk consumption (breakfast, drinking, hot drinks) (ml) 250 200 200- % reduction in dairy content (awareness driven) 20% 20%-% population switching to new portion size 25% 75%- Milk avoided tonnes 183,357 888,298-GHG avoided CO2e 183,357 888,298Dairy to soya switch - cheeseEstimated retail cheese volumes in tonnes 2,152,716 2,367,915 3,004,795expected % market share <strong>of</strong> soya/o<strong>the</strong>r alternative 0.0% 0.0% 0.0%target % market share <strong>of</strong> soya/o<strong>the</strong>r alternative 0.0% 0.1%- Cheese avoided tonnes 9 608-GHG avoided CO2e 9 608Dairy to soya switch - milkexpected retail milk volumes in tonnes 4,329,979 4,291,315 1,720,848expected % market share <strong>of</strong> soya/o<strong>the</strong>r alternative 3.8% 10.3% 17.5%target % market share <strong>of</strong> soya/o<strong>the</strong>r alternative 10.3% 71.4%- Milk avoided tonnes 490,899 4,297,801-GHG avoided CO2e 490,899 4,297,80176
<strong>Strategies</strong> <strong>for</strong> reducing <strong>the</strong> climate impacts <strong>of</strong> <strong>UK</strong> red meat/dairy consumption11.11 Options – Dairy Analysis AssumptionsDairy reduction and dilution - Assumptions and ReferencesCheese based composite meal re<strong>for</strong>mulation/dilutionWe assume a projected population <strong>of</strong> 61.4m in 2008, 66.3m in 2020 and 80.3m in 2050, based on 2005 ONS population data (Office <strong>of</strong>National Statistics, 2005, http://www.statistics.gov.uk/cci/nugget.asp?id=1352, viewed 03.03.09)76% <strong>of</strong> people eat cheese sandwiches, on average 3 times per week (Lunchtime Eating Habits, Mintel Leisure Intelligence, 2005)70% <strong>of</strong> <strong>the</strong> population eat ready meals, on average twice a week (Chilled Ready Meals, Mintel Market Intelligence, 2004)66% <strong>of</strong> people eat pizza, once a week (Pizza, Mintel Market Intelligence, 2005)We assume <strong>the</strong> average portion sizes <strong>of</strong> cheese occasions as; 42.5g in a cheese sandwich, 46.2g in a ready meal and 68.2g in a pizza.These assumptions are drawn from <strong>the</strong> average cheese contained in a range <strong>of</strong> pre-prepared foods.We assume consumers maintain current eating patterns in number and frequency <strong>of</strong> ready meals, pizzas and cheese sandwichesbetween 2008 and 2050We assume that <strong>the</strong> portion size <strong>of</strong> cheese in ready meals, pre-prepared sandwiches and pizzas is reduced to 30g by 2020, in line with<strong>of</strong>ficial guidelines from <strong>the</strong> Eat Well plate.We assume 50% <strong>of</strong> consumers will choose to purchase products that contain smaller portions <strong>of</strong> cheese by 2020, <strong>for</strong> health reasonsWe assume 100% <strong>of</strong> consumers choose to purchase products that contain smaller portions <strong>of</strong> cheese by 2050, <strong>for</strong> health reasonsDairy portion control - ice cream sticks or barsWe assume a projected population <strong>of</strong> 61.4m in 2008, 66.3m in 2020 and 80.3m in 2050, based on 2005 ONS population data (Office <strong>of</strong>National Statistics, 2005, http://www.statistics.gov.uk/cci/nugget.asp?id=1352, viewed 03.03.09)Single serve ice cream sticks/bars were used in <strong>the</strong> working because <strong>the</strong> portion size could not be accurately determined <strong>for</strong> tubs/largercontainers59.8% <strong>of</strong> people consume ice cream in <strong>the</strong> <strong>for</strong>m <strong>of</strong> sticks or bars and consume on average one ice cream stick per week (it is recognisedthis is a seasonal pattern) (Ice Creams and Frozen Desserts, Keynote 2007)We assume <strong>the</strong> average portion sizes <strong>of</strong> ice cream bars/sticks is 79ml. This assumption is drawn from <strong>the</strong> average portion size <strong>of</strong> a range<strong>of</strong> individual serve ice cream productsWe assume manufacturers reduce individual portion size <strong>of</strong> ice cream sticks and bars to 30g, in line with Eat Well plate FSA guidelinesWe assume <strong>the</strong> consumers continue to eat <strong>the</strong> same number and frequency <strong>of</strong> ice cream sticks or bars between 2008 and 2050We assume 25% <strong>of</strong> consumers choose to purchase ice cream products with smaller serving size by 2020, <strong>for</strong> health reasonsWe assume 50% <strong>of</strong> consumers choose to purchase ice cream products with smaller serving size by 2050, <strong>for</strong> health reasonsSingle serve ice cream sticks/bars were used in <strong>the</strong> working because <strong>the</strong> portion size could not be accurately determined <strong>for</strong> tubs/largercontainersDairy portion control – milkWe assume a projected population <strong>of</strong> 61.4m in 2008, 66.3m in 2020 and 80.3m in 2050, based on 2005 ONS population data (Office <strong>of</strong>National Statistics, 2005, http://www.statistics.gov.uk/cci/nugget.asp?id=1352, viewed 03.03.09)85.2% <strong>of</strong> people consume ready to eat (RTE) cereals, on average 4 times per week and 47.7% <strong>of</strong> people consume hot cereals onaverage twice a week (Breakfast Cereals, Keynote 2007)We assume 30% <strong>of</strong> <strong>the</strong> population consume a glass <strong>of</strong> milk, on average 4 times per week70% <strong>of</strong> <strong>the</strong> population drink tea/c<strong>of</strong>fee, on average three times per day ('How do you drink yours?', Times Online, 28 January 2008,http://www.timesonline.co.uk/tol/life_and_style/health/article3260043.ece (viewed 03.03.09)We assume an average portion size <strong>of</strong> 119ml <strong>for</strong> RTE cereal, 243ml <strong>for</strong> hot cereal, 20ml <strong>for</strong> tea/c<strong>of</strong>fee and 200ml serving size <strong>for</strong> a glass<strong>of</strong> milk. Average volume <strong>of</strong> servings derived from a selection <strong>of</strong> existing convenience foods and from preparation guidelines on packaging<strong>of</strong> complementary products where in<strong>for</strong>mation was availableWe assume consumers eat a bowl or hot or cold cereal or a glass <strong>of</strong> milk and three cups <strong>of</strong> tea/c<strong>of</strong>fee per day, to give an estimatedaverage daily intake <strong>of</strong> 250ml <strong>of</strong> milkWe assume that consumers maintain current eating patterns <strong>of</strong> cereal, tea/c<strong>of</strong>fee and milk snacks between 2008 and 2050We assume <strong>the</strong> government launches high pr<strong>of</strong>ile campaign in 2015 to encourage consumers to reduce total daily milk consumption to200ml, in line with Eat Well plate guidelinesWe assume 25% <strong>of</strong> consumers choose to reduce daily milk intake in line with guidelines by 2020, due to need <strong>for</strong> behavioural change andallowing <strong>for</strong> consumer autonomy in consumptionWe assume 75% <strong>of</strong> consumers choose to reduce in line with guidelines by 2050.Dairy to soya switch – cheeseCheese consumption will increase from 3,794,000 tonnes in 2008 at a CAGR <strong>of</strong> 0.8% between 2008 and 2050 with no intervention(Agriculture in <strong>the</strong> <strong>UK</strong> 2007, Defra. URL: https://statistics.defra.gov.uk/esg/publications/auk/2007/Table%205-17.xls)We assume that 56.7% <strong>of</strong> total cheese in volume is sold through retail channelsWe assume <strong>the</strong>re is currently no soya/o<strong>the</strong>r alternative to cheese available in multiple retailersWe assume manufacturers can produce an adequate soya/o<strong>the</strong>r cheese substituteWe assume that cheese alternatives could achieve a CAGR <strong>of</strong> 20.3% between 2008 and 2020 and 15% between 2020 and 2050, basedon <strong>the</strong> assumption that cheese alternatives could build on previous CAGR realised <strong>for</strong> soya milk products with high pr<strong>of</strong>ile promotion byretailers (Euromonitor International Health and Wellness – packaged food – <strong>UK</strong> February 2008)We assume that in response to a growth in consumption <strong>of</strong> soya/o<strong>the</strong>r alternatives to cheese, <strong>the</strong> conventional cheese market wouldreduce by -3% between 2020 and 2050Dairy to soya switch - milkMilk consumption will increase from 6,637,000 tonnes in 2008, at a CAGR <strong>of</strong> -0.07% between 2008 and 2050 with no intervention(Agriculture in <strong>the</strong> <strong>UK</strong> 2007, Defra. URL: https://statistics.defra.gov.uk/esg/publications/auk/2007/Table%205-17.xls)We assume that 65.2% <strong>of</strong> total liquid milk in volume is sold through retail channelsThe value <strong>of</strong> soya milk market represented 3.9% <strong>of</strong> <strong>the</strong> value <strong>of</strong> <strong>the</strong> conventional milk market in 2006 (Euromonitor International Healthand Wellness – packaged food – <strong>UK</strong> February 2008). We assume <strong>the</strong> volume ratio <strong>of</strong> 3.9% is equivalent to <strong>the</strong> value ratio, to give anestimated 261,000 tonnes <strong>of</strong> soya milk consumed in 2008.We assume <strong>the</strong> soya milk market is expected to grow at a CAGR <strong>of</strong> 9.3% between 2008 and 2020 and 2% between 2020 and 2050 as <strong>the</strong>market matures to account <strong>for</strong> 17% <strong>of</strong> <strong>the</strong> total 'milk' consumption. (Euromonitor International Health and Wellness – packaged food – <strong>UK</strong>February 2008). This is in line with <strong>the</strong> c. 17% <strong>of</strong> people that are ei<strong>the</strong>r lactose allergic or believe <strong>the</strong>y are lactose intolerant (FSA (2007)Omnibus Research Report Prepared <strong>for</strong> FSA by COI, April 2007)We assume that high pr<strong>of</strong>ile promotion <strong>of</strong> soya milk by retailers could maintain a higher CAGR between 2020 and 2050 <strong>of</strong> 8% and that as<strong>the</strong> market grew <strong>the</strong> conventional milk market would reduce during this period by -3%77