The Centennial Resilience Index: Expanding Its Coverage and ...
The Centennial Resilience Index: Expanding Its Coverage and ...
The Centennial Resilience Index: Expanding Its Coverage and ...

You also want an ePaper? Increase the reach of your titles
YUMPU automatically turns print PDFs into web optimized ePapers that Google loves.
THE CENTENNIAL RESILIENCE INDEX: EXPANDING ITS COVERAGE AND TESTING ITS PREDICTIVE POWERhave been made to the measurement of private sectordebt <strong>and</strong> other variables.Second, the addition of the more advancedcountries allows a new base of comparison betweenthe resilience scores for those countries <strong>and</strong> thescores for EMCs. One fascinating result is the almostcontinuous - <strong>and</strong> significant - decline in the resiliencescore of the advanced countries since the start ofthe calculation period in 1997. This contrasts sharplywith the steadily increasing resilience of the EMCsuntil the crisis that began in 2007 / 2008 in the UnitedStates. 2 As the charts for the underlying factorsshow, the decline in the resilience of the advancedeconomies before the crisis was driven by the rapidaccumulation of both public <strong>and</strong> private debt in manycountries, <strong>and</strong> the decline in external robustness. 3<strong>The</strong> contrasting improvement in the resilience of theEMCs over that same period derived from a widevariety of factors: most importantly by stronger fiscal<strong>and</strong> monetary policies; increasing export diversity <strong>and</strong>international reserves; <strong>and</strong> — beginning around 2001— a strengthening of their banking systems.<strong>The</strong> resilience of both country groupings hasdeclined sharply in the wake of the global crisis. Inthe advanced countries, this has been driven primarilyby fiscal weaknesses <strong>and</strong> a severe initial declinein banking soundness. In the EMCs, the decline hasresulted from fiscal weakness - partly the result ofappropriately stimulative policies <strong>and</strong> the impact ofslower growth on revenue, <strong>and</strong> an increase in privatedebt. <strong>The</strong> decline in the resilience of the advancedeconomies has been greater than that in the EMCs.Moreover, there are many EMCs, including Israel,Korea, Singapore, Peru, <strong>and</strong> others for which the2 <strong>The</strong> latest WEO from the IMF confirms - with certain caveats - what it callsthe “rising resilience” of the emerging market <strong>and</strong> developing economies. SeeIMF Survey, September 27, 2012.3 See Box 1 for the definition of the elements included in each of thesefactors.<strong>Resilience</strong> Indices have actually strengthened in thewake of the crisis.Third, the results for the countries in Europethat have been worst affected by the crisis there aredramatic. For more than a decade before the globalcrisis in 2007 / 2008, with the exception of a brief periodaround 2001 <strong>and</strong> 2002, each of those countries(Greece, Spain, Portugal, Italy, <strong>and</strong> Irel<strong>and</strong>) have seenan almost continuous, <strong>and</strong> uniquely sharp, decline intheir resilience. <strong>The</strong> key elements responsible for thisdecline have been fiscal policy <strong>and</strong> banking sectorsoundness.<strong>The</strong> global crisis itself helped to further weakenthe resilience of these countries. <strong>The</strong> initial measurestaken to deal with their own crises since 2010, <strong>and</strong>the resulting severe recessions in most of them, havealso contributed to that decline. This is, not least,partly a reflection of the way in which the crisis inEurope has been h<strong>and</strong>led.Fourth, looking forward, the resilience of the largestcountries (the United States, the United Kingdom,the Euro-zone countries other than the crisiscountries, <strong>and</strong> Japan) has stabilized after the sharpdeclines associated with the global crisis. In Europe<strong>and</strong> Japan, resilience has begun to increase. Someregions <strong>and</strong> individual countries of the developing<strong>and</strong> emerging world, with the exception of emergingEurope <strong>and</strong> Sub Saharan Africa, have been able toretain or even strengthen somewhat their overall resilience.Latin America is pulled down by Venezuela, Argentina,<strong>and</strong> – to a lesser extent — Brazil, but overall,the region has retained most of its earlier resilience.Asia, as well as the Middle East <strong>and</strong> North Africa havemanaged to increase their resilience somewhat sincethe onset of the global crisis. In all regions, as would
e expected, there is a diversity of performanceacross countries.What conclusions can be drawn from this work?<strong>The</strong> first is that the index appears to have the powerboth to identify economies that are heading fortrouble, 4 <strong>and</strong> to isolate the specific policy areas ofweakness that lie behind their increasing vulnerability. 5<strong>The</strong> second conclusion is the more troubling.<strong>The</strong>re was an obvious failure by the various surveillancemechanisms in the global system to fully <strong>and</strong>accurately identify the major vulnerabilities that wereemerging in so many countries. It is not that none ofthese emerging problems was seen. Obviously theywere, including the housing bubbles in a number ofcountries - <strong>and</strong> the associated explosion in privatesector debt; the fiscal problems in the U.S. <strong>and</strong> insome other countries; <strong>and</strong>, at least at the BIS, someof the problems developing in the global financialsystem, including those in some of the major financialcenters. But in many instances, those analyses wereeither rejected or “the dots were not connected”, i.e.,the implications of some of the vulnerabilities werenot sufficiently explored. Many things were eithermissed, such as the depth of the perverse incentivesthat had developed in housing finance <strong>and</strong> inthe securitization process in the U.S. Beyond that,some widely held beliefs about how to deal with assetbubbles <strong>and</strong> the power of private sector markets toself-correct appears to have blinded many to the risksthat were being run.At the same time, even some of the emergingproblems that were identified were left uncorrected.Partly, this reflected the existing consensus aroundthe “Great Moderation”. In addition, the surveillancesystems that are relied upon to induce corrective policiesby countries at risk - the G7, the G20, WorkingParty 3 at the OECD, <strong>and</strong>, perhaps most importantly,the IMF - proved incapable of playing an effectiverole. <strong>The</strong>se processes “lacked the teeth” necessaryto encourage - or to force - corrective policy actionswhere needed. As the saying goes, peer protection inthese forums took the place of effective peer pressure.6<strong>The</strong> <strong>Resilience</strong> index can add to the tools of thesurveillance process - at least as a device to helpinsure that vulnerabilities are surfaced, <strong>and</strong> deeperanalysis is conducted to asses those vulnerabilities<strong>and</strong> suggest corrective policies. But that alone wouldstill be insufficient. <strong>The</strong> recent report of the PalaisRoyal Initiative concludes, bluntly, that “Surveillanceover countries’ economic <strong>and</strong> financial policies isinadequate”. 7 <strong>The</strong> report makes a number of suggestionsto improve that process including the adoptionof “norms” <strong>and</strong> remedial measures on countries thatbreach such norms. 8<strong>The</strong> <strong>Resilience</strong> <strong>Index</strong> shows clearly that emergingweaknesses in many economies were evident wellbefore the global crisis <strong>and</strong> well before the crisis inEurope. What that implies, more than anything else,4 See the regressions results given in <strong>The</strong> New <strong>Resilience</strong> of EmergingMarket Countries: Weathering the Recent Crisis in the Global Economy, byJack Boorman, Jose Fajgenbaum, Manu Bhaskaran, Harpaul Alberto Kohli<strong>and</strong> Drew Arnold, ADB Regional Forum: Impact of the Global Crisis on Asia:Lessons Learned, Policy Insights, <strong>and</strong> Outlook, November 2010.5 <strong>The</strong> index relies on factor analysis to calculate the resilience scores foreach country. <strong>The</strong>re are no a priori constraints put on the analysis other thanthe choice of specific variables to include. Factor analysis permits the datasets to speak for themselves.6 See the Report of the IMF Independent Evaluation Office: “IMF Performancein the Run-Up to the Financial <strong>and</strong> Economic Crisis: IMF Surveillancein 2004-07”, February 9, 2011.7 Palais Royal Initiative - Reform of the International Monetary System: ACooperative Approach for the 21st Century, in Reform of the InternationalMonetary System, Edited by Jack Boorman <strong>and</strong> Andre Icard, Sage Publications<strong>and</strong> Emerging Markets Forum, 2011, page 13.8 <strong>The</strong>se could be similar to the measures that may be adopted under theproposed “Fiscal Pact among the euro-area countries.
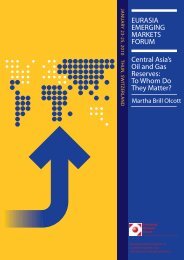
THE CENTENNIAL RESILIENCE INDEX: EXPANDING ITS COVERAGE AND TESTING ITS PREDICTIVE POWERis the need to pursue more actively many of the ideasthat have been put on the table to improve surveillanceprocesses - <strong>and</strong>, particularly, those of the IMF.IntroductionIn a paper discussed at the 2010 EmergingMarket Forum, 9 it was argued that there had been nodecoupling of the EMCs from the advanced countries<strong>and</strong> that, to the contrary, all countries were becomingmore inter-connected. That reality alone wouldhave suggested a serious negative spillover to theEMCs from the 2007/2008 crisis that originated inthe advanced countries. And we saw this happeningthrough the adverse impact of the crisis on exports,tourism, remittances, capital flows, <strong>and</strong> the like.However, this negative impact was countered by thepolicy response of the EMCs that was made possibleby the resilience that many of these countrieshad built through important reforms undertaken in theaftermath of their own crises during the mid-1990s<strong>and</strong> early 2000s (Figures 1 <strong>and</strong> 2). <strong>The</strong>se reformsprovided many of these countries with a capacity torespond to the crisis with stabilizing <strong>and</strong> stimulatingpolicy measures that helped them either absorb theshock with limited adverse effects <strong>and</strong>/or to reboundstrongly after a severe initial impact.While the crisis affected individual EMCs in varyingdegrees, the ability of many of those countries toabsorb the negative spillover effects of the crisis <strong>and</strong>to recover quickly was impressive. In an attempt tounderst<strong>and</strong> this newfound policy capacity of EMCs,we developed a <strong>Resilience</strong> <strong>Index</strong>. This index is intendedto identify factors that have increased the abilityof many EMCs to absorb external shocks <strong>and</strong> torespond effectively. <strong>The</strong> index is composed of a largenumber of key factors that help explain why the moreresilient countries would be able to absorb negativeshocks, respond effectively, <strong>and</strong> recover faster thanother countries. In addition to the typical economic<strong>and</strong> financial fundamentals, the <strong>Resilience</strong> <strong>Index</strong>includes structural <strong>and</strong> institutional aspects of theeconomies that provide the capacity <strong>and</strong> space thatpolicy makers need to design a policy response tothe crisis, the confidence to implement that response,<strong>and</strong> the credibility regarding the effectiveness of theresponse (Box 1).<strong>The</strong> attractiveness of the <strong>Index</strong> resides in its comprehensiveview of the factors that help determinethe resilience of the economy, <strong>and</strong> on its ability togive policy makers clearer insight into the sources oftheir country’s resilience <strong>and</strong> the specific areas wherefurther strengthening is needed. Such strengtheningis critical in view of the ever-growing <strong>and</strong> morecomplex interconnectedness between developmentsin the advanced countries <strong>and</strong> in the EMCs that hasbecome evident in recent years.<strong>The</strong> purpose of this paper is to assess the relevanceof the <strong>Resilience</strong> <strong>Index</strong> — in terms of providingwarning signals — in the lead up to the sovereigndebt <strong>and</strong> private credit crises in the Euro-zone, aswell as the continued sluggishness of the U.S. <strong>and</strong>Japanese economies. 10In addition, if Europe <strong>and</strong> the US were to have adouble dip recession, will the EMCs be able to playthe role they played in the aftermath of the globalfinancial crisis of 2007/08? Put differently, have thestabilizing <strong>and</strong> supportive efforts of the EMCs in respondingto the global crisis affected those countries’9 See: <strong>The</strong> New <strong>Resilience</strong> of Emerging Market Countries: Weathering theRecent Crisis in the Global Economy, by Jack Boorman, Jose Fajgenbaum,Manu Bhaskaran, Harpaul Alberto Kohli <strong>and</strong> Drew Arnold, Emerging MarketForum, October 2010.10 Please note that this paper exp<strong>and</strong>s the sample of EMCs to 72 countries,from about 37 in the 2010 paper referred to above. In addition, it includes25 advanced countries. <strong>The</strong> countries included in the sample are listed inAppendix 2.
Figure1Annual GDP Growth (In percent)108GDP growth (%)6420-22001 2002 2003 2004 2005 2006 2007 2008 2009 2010 2011 2012WorldEmerging <strong>and</strong> developing economiesSource: IMF World Economic Outlook.Figure2Quarterly GDP Growth (In percent)Source: IMF International Financial Statistics
THE CENTENNIAL RESILIENCE INDEX: EXPANDING ITS COVERAGE AND TESTING ITS PREDICTIVE POWERBox 1<strong>The</strong> <strong>Centennial</strong> <strong>Resilience</strong> <strong>Index</strong> <strong>and</strong> the Rationale for Each Element<strong>The</strong> <strong>Centennial</strong> <strong>Resilience</strong> <strong>Index</strong> provides a measure of the capacity of an economy to cope with <strong>and</strong> bounce back after havingbeen hit by an external shock.<strong>The</strong> index groups its 56 input component variables into ten element, as specified in Appendix 1. <strong>The</strong> rationale for each of itselements <strong>and</strong> components is briefly described below:Fiscal Policy SoundnessThis represents the space policy makers have to adopt fiscal measures. <strong>Its</strong> components are the stock of public debt in relationto GDP as well as the rate (<strong>and</strong> direction) of change of this variable as a measure of the overall deficit. A higher debt ratio or overalldeficit decreases the space.Monetary Policy Soundness<strong>The</strong> greater the credibility the central bank has built up – for example, by such actions as controlling inflation — the moreroom the central bank has to ease monetary policy in a slowdown, thereby supporting activity in the economy. <strong>Its</strong> components arethe difference between domestic inflation <strong>and</strong> G-7 inflation, whether an inflation targeting framework is in place (as it is typicallyassociated with increased credibility), <strong>and</strong> a measure of the unpredictability of inflation, estimated by its historical st<strong>and</strong>ard deviation.Government Effectiveness<strong>The</strong> stronger the capacity of government officials to react <strong>and</strong> design policies, the better <strong>and</strong> faster will be the implementationof these policies <strong>and</strong> thus the response of the economy. <strong>The</strong> greater the capacity of the government to follow through with its plans,the more likely the private sector will respond positively to stimulus measures, <strong>and</strong> thus the higher the country’s resilience. <strong>Its</strong>components are the quality of the bureaucracy <strong>and</strong> the ability to consistently implement forward-looking policies.Overall GovernanceGood governance is generally seen as a necessary underpinning to an efficient economy, with reliable <strong>and</strong> independentinstitutions, adherence to the rule of law (confidence in contracts, property rights, etc.), transparency, limits to corruption, pressfreedom, required bank <strong>and</strong> credit ratings, accounting disclosure, shareholder rights, <strong>and</strong> availability of both private- <strong>and</strong> publicsectorst<strong>and</strong>ardized data. <strong>Its</strong> components are indices of corporate governance, legal system, <strong>and</strong> policy transparency, <strong>and</strong> are takenfrom the <strong>Index</strong> of Financial Development <strong>and</strong> Strength developed by <strong>Centennial</strong> Group International (see methodology).Bank SoundnessA sounder financial system with less risk of default, a strong capital base, well-provisioned assets, non-volatile income sources,<strong>and</strong> high profitability is less likely to amplify an external shock <strong>and</strong> thus makes the economy more resilient. Although this elementrepresents predominantly banks, it also includes some non-bank financial institutions, <strong>and</strong> therefore measures the broader financialsector. <strong>Its</strong> components—all derived from the IMF’s Financial Soundness Indicators Compilation Guide — are indices asset quality,capital base, <strong>and</strong> income risk, <strong>and</strong> are also taken from the <strong>Index</strong> of Financial Development <strong>and</strong> Strength developed by <strong>Centennial</strong>Group International.Export Diversity<strong>The</strong> more diversified the export base, the more resilient the economy is likely to be. <strong>Its</strong> components measure export diversity bydestination <strong>and</strong> product.Export Independence<strong>The</strong> greater the dependence on exports, the less resilient to an external shock an economy is likely to be. <strong>Its</strong> component is theratio of exports to GDP.External Robustness<strong>The</strong> stronger the external sector, the more resilient an economy is likely to be. <strong>Its</strong> components are the current account balanceas a proportion of GDP, the ratio of international reserves to short term debt, the stock of reserves in terms of months of imports, <strong>and</strong>a classification of the exchange rate regime.Private Debt<strong>The</strong> private debt element includes components measuring both external debt <strong>and</strong> domestic debt. Much domestic debt consistsof bank credit to the private sector, <strong>and</strong> its excessive growth leads to destabilizing asset bubbles. Regarding external debt, thefaster the expansion of externally financed credit to the private sector, the less resilient an economy is likely to be to a sudden stopin capital flows. (Externally financed credit should not be seen as financial deepening, which involves credit growth mainly financedby domestic financial savings.) <strong>Its</strong> components are the ratio of private credit by deposit money banks to GDP, the change over threeyears of this ratio, the change in the ratio of loans from foreign banks to private credit by domestic banks, the ratio of claims on the
Box 1<strong>The</strong> <strong>Centennial</strong> <strong>Resilience</strong> <strong>Index</strong> <strong>and</strong> the Rationale for Each Elementcountry’s residents by foreign banks to GDP, <strong>and</strong> the change in this ratio. It would have been helpful <strong>and</strong> appropriate to includecurrency composition of private sector debt, but the relevant data was not available.International Reserves <strong>and</strong> Net International InvestmentAt least up to some limit, the higher the reserve holdings the stronger the self-insurance they offer; in addition, a high stock ofreserves provides policy makers with room for maneuver <strong>and</strong> confidence to adopt expansionary policies in a downturn. Thus, a highstock of reserves constitutes a buffer against external shocks. While it would appear that the higher the stock of reserves, the betteroff the country is, there are important costs in such an approach. Moreover, a recent IMF study shows that the self-insurance aspecttapers off after a certain level of reserves. A positive international investment position also indicates room for maneuver for both theprivate <strong>and</strong> public sectors. <strong>The</strong> components of this element of the resilience index are the ratio of international reserves to GDP <strong>and</strong>the ratio of the net international investment position to GDP.resilience <strong>and</strong> their capacity to counter further negativeforces emanating from the industrial countries?An equally important objective is to explore whatthe <strong>Resilience</strong> <strong>Index</strong> may be signaling about thecapacity of certain EMCs <strong>and</strong> regions to respond tocontinued sluggishness in the U.S. economy <strong>and</strong>recession in Europe<strong>The</strong> continued effects of the Global FinancialCrisis <strong>and</strong> of the Euro-zone crisis on theEMCs 11In contrast to the sudden shock caused by theglobal financial crisis of 2007/08 manifest in the seizingup of global credit markets, recent difficulties inthe advanced countries reflect the protracted <strong>and</strong> stillongoing effects of that crisis — including, most importantly,the de-leveraging necessitated by the earliercredit excesses <strong>and</strong> asset price bubbles. Moreover,the protracted nature of this adjustment has been accompaniedby high volatility, arising from large swingsin market perceptions about the adequacy, or lackthereof, of the measures adopted by the advancedcountries to address their difficulties. As was the case11 <strong>The</strong> rationale for reviewing again developments that followed the onsetof the global financial crisis is three-fold: to update the previous paper, to setthe stage for using the revised index (see below) to test its capacity to see—before their crises—the worsening situation in the peripheral Euro-zonecountries, <strong>and</strong> to predict which countries/regions now look at risk.with the impact of the global financial crisis of 2008,the effects of these more recent developments onthe EMCs also vary significantly among countries <strong>and</strong>regions.While the transmission of developments in theadvanced countries to the EMCs is coming througha number of channels — including on expectations<strong>and</strong> confidence — we focus on the financial <strong>and</strong> realactivity channels.1. <strong>The</strong> financial channelThis section examines the impact of globalshocks on the EMCs as a result of their exposure tofinancial flows. <strong>The</strong> financial channel impacts EMCsthrough portfolio allocation, foreign direct investment(FDI), <strong>and</strong> cross-border lending. Additional shockscould materialize from the slowdown in Europe, thecontinued sluggish recovery in the U.S., <strong>and</strong>, potentially,further decreased growth rates in China, India,<strong>and</strong> Brazil. A major feature of linkages between advancedeconomies <strong>and</strong> EMCs over the recent periodhas been the repeated risk-on/risk-off behavior ofcapital flows, alternating between inflow surges duringoptimistic periods <strong>and</strong> sudden stops or reversals
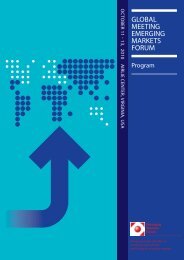
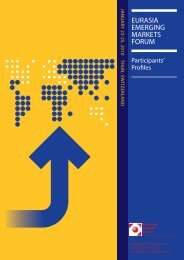
THE CENTENNIAL RESILIENCE INDEX: EXPANDING ITS COVERAGE AND TESTING ITS PREDICTIVE POWERFigure3Net Capital inflows to Emerging Market Economies (% of GDP)Source: World Bank.as optimism waned, adding an extra challenge toEMCs’ policy makers.Net Capital Inflows to EMCsAfter a steady run-up in the period leading tothe global financial crisis, capital inflows in EMCshave caused serious disruptions as the deleveragingprocess in the advanced economies has led to significantcutbacks, only temporarily reversed in 2010(Figure 3). <strong>The</strong> steady worsening of the Europeansituation has induced another round of risk aversion<strong>and</strong> total flows are now lower than at the beginning ofthe observed period (2004).This adds up to a picture of lower <strong>and</strong>, asimportantly, highly volatile inflows, complicating theadoption of a cohesive policy response by EMCs.Policy adjustments have been able to accommodateinflows by accumulating international reserves, helpingalleviate excessive currency appreciation. <strong>The</strong>yhave also helped manage potentially bubble-inducingincreases in liquidity. However, EMCs’ policy makershave found it difficult or cumbersome to manage theunwelcome sources of volatility associated with thesudden stops/inflows linked to the risk-on/risk-off behaviorsof the capital markets <strong>and</strong> to monetary policyinitiatives in the U.S. Asset prices <strong>and</strong> exchange rateswere strongly impacted by the volatility of inflows, asillustrated in the following charts.Volatility is the key word. As Figure 4 shows,starting in early 2009, a run-up in portfolio flows toEMCs was triggered by the steep decline in the levelof interest rates in advanced economies <strong>and</strong> theensuing quest for yield. By early 2011, net portfolioflows (equity <strong>and</strong> debt instruments) to EMCs hadmore than doubled compared to their level before theadvent of the crisis. In stark contrast, there has beena marked decline more recently, as shown in the followingfigure, as risk appetite <strong>and</strong> exposure to EMCs,in particular from European investors, plummeted.
Figure4Portfolio flows <strong>and</strong> their impact on asset pricesSource: EPFR, MSCI, IMF, ECB http://www.ecb.europa.eu/pub/fsr/html/summary201106.en.html<strong>The</strong> recurring flare up of the Euro-zone crisis sharplycurtailed global investors’ risk appetite.In the aftermath of the global financial crisis,changes in international capital flows, together withthe fall in exports, tourist arrivals, <strong>and</strong> remittances(see below) led to considerable currency depreciations,in some cases, <strong>and</strong> to significant losses ininternational reserves in those countries that usedtheir foreign exchange holdings to buffer the externalshocks. <strong>The</strong> following table illustrates these losses fora selected group of Asian countries.Subsequently, the currency depreciations <strong>and</strong>reserve losses were reversed in most countries, insome cases by the resumption of strong portfoliocapital inflows as shown in Figure 4.Foreign Direct InvestmentSensitivity to FDI flows can constitute an importantchallenge for EMCs, especially for the lower incomeones. Looking across regions, exposure to FDIvaries significantly. Within regions — <strong>and</strong> individualcountries — FDI also varies significantly over time, asshown in Figure 5.East Asia <strong>and</strong> Pacific (EAP), already a strong recipientbefore the crisis, is now the main FDI destinationas Europe <strong>and</strong> Central Asia as well as South Asiahave experienced significantly reduced inflows whileEAP now benefits from higher inflows than before2008. However, EAP could be especially exposed toreduced Chinese investments. South/South FDI (from
Figure6Average inward FDI flows by geographical regions (US$ million), 2005–10Source: UNCTAD, UNCTADstat database.China, India, South Africa <strong>and</strong> Malaysia) has provento be a major equilibrating factor as they picked upthe slack created by advanced countries’ deleveraging.China, in particular, has become a major playeras regards FDI, as Chinese FDI to all emerging <strong>and</strong>developing countries increased more than 10-foldbetween 2005 <strong>and</strong> 2010, increasing the impact of apotential Chinese slowdown.Such a slowdown is also likely to impact EMCs intwo other ways: first, by reducing Chinese dem<strong>and</strong>for commodities as the scale of its investment-ledstimulus of 2009 may be difficult to be repeated; <strong>and</strong>second, through lower Chinese growth induced by aslowdown of exports, particularly to Europe.In parallel, reduced outward European FDI mayimpact emerging <strong>and</strong> developing countries, as Europeaninvestors account for the largest share of FDI tothese countries, at 20-30% of the total, according toUNCTAD. While a decline in FDI could be problematicfor the EMCs, the major source of potential inflowvolatility due to the European crisis is linked to crossborder<strong>and</strong> local-market banking activity.Cross-border <strong>and</strong> local-market banking activityEuropean banking activity in EMCs grew steadilyuntil 2008, before experiencing a sharp contractionupon the onset of the crisis (Figure 6).European bank lending to developing countriespicked up fairly rapidly after the initial credit squeezein 2008 <strong>and</strong> early 2009 (Figure 7). 12 However, sincethe worsening of the Euro-zone crisis (second half of2011), borrowers in EMCs have felt a deteriorationof funding conditions explicitly linked to the Europeansituation, as indicated in global lending surveysby the Institute of International Finance (IIF). This12 Quoted in: <strong>The</strong> euro zone crisis <strong>and</strong> developing countries;Isabella Massa, Jodie Keane <strong>and</strong> Jane Kennan
THE CENTENNIAL RESILIENCE INDEX: EXPANDING ITS COVERAGE AND TESTING ITS PREDICTIVE POWERFigure7Cross-border bank lending from European banks (US$ million), March 2005–September 2011Source: BIS Consolidated Banking Statistics. Quoted in <strong>The</strong> euro zone crisis <strong>and</strong> developing countries;Isabella Massa, Jodie Keane <strong>and</strong> Jane KennanNote: Consolidated foreign claims of reporting banks, by nationality of reporting banks, immediate borrower basis. Developing countries data onsecondary axis.has particularly affected countries where Europeanfinancial institutions comm<strong>and</strong> a large share of thedomestic banking systems, such as in Central <strong>and</strong>Eastern Europe, as well as in some African countries.In some of these countries, European financial institutionshold more than 50 percent of banking assets.As the European banking system is highly leveraged(assets represent 16 to 18 times the capital basecompared to about 12 times globally), the process ofbalance sheet shrinking is likely to require both capitalincreases <strong>and</strong> asset disposals, the latter possibly affectingEMCs access to funding.<strong>The</strong> impact on EMCs of this deleveraging hasremained contained thus far, at somewhere between€10 <strong>and</strong> €20 billion, equivalent to only 1 to 2 percentof total EMC credit extended by European banks(€1.35 trillion). Scenarios have tried to assess the ultimateimpact of the planned deleveraging, with numbersvarying greatly, depending on the assumptionson the respective shares of deleveraging achievedthrough capital increases <strong>and</strong> asset disposals, as wellas the share of disposals affecting the loan book. 13 Inthe most likely scenario, where banks would increasetheir capital base by 20% <strong>and</strong> allocate only half ofasset disposals to loans, EMCs’ credit would drop byabout 20 percent or as much as $338 billion. Whilethis could be offset in part by other investors, a netfall in European funding to EMCs may constitute asignificant threat to growth in the coming period.This prospect makes a positive resolution to current13 Bank deleveraging: Causes, channels <strong>and</strong> consequencesfor Emerging Markets <strong>and</strong> Developing Countries. Erik FeyenKatie Kibuuka İnci Okter-Robe
Figure9CRB commodity index (equally weighted index of 17 commodities)Source: CRBaffected commodity prices. As commodities havebecome an asset class in their own right over the lastdecade, their prices reflect not only final dem<strong>and</strong> fromthe real sector but also investment dem<strong>and</strong>. This lastcomponent is heavily impacted by future price expectations,which add to the volatility linked to the businesscycle. Moreover, the extended seesawing of aTable3Remittances to Emerging <strong>and</strong> Developing Countries (in US$ billion)Remittances(US$ billion)2006 2007 2008 2009 2010 2011 2012(f)East Asia <strong>and</strong>Pacific 58 71 85 86 95 107 115Europe <strong>and</strong>Central Asia 97 51 45 36 37 41 45Latin America<strong>and</strong> Caribbean 59 63 64 57 57 62 66Middle East<strong>and</strong> NorthAfrica 26 31 36 34 40 42 45South Asia 43 54 72 75 82 97 104Sub-SaharanAfrica 13 19 22 20 21 22 24Source: IMF SDDS, BIS Working paper 382: Risk-on/risk-off, capital flows, leverage <strong>and</strong> safe assets; Robert McCauley, July 2012
THE CENTENNIAL RESILIENCE INDEX: EXPANDING ITS COVERAGE AND TESTING ITS PREDICTIVE POWERmajor source of EMCs’ income is an added challengefor policy makers in resource-dependent economies.Remittances <strong>and</strong> tourism flows to EMCs wereconsiderably affected by the global financial crisis,although with a lag in the case of the former. <strong>The</strong>magnitude of the decline in remittance receipts appearsto have been closely linked to the fall in activityin the countries of origin. For instance, remittancesfrom the U.S. to Mexico experienced an exceptionaldrop. Remittances to East Asia, however, wentrelatively unscathed (Table 3). Following a recovery in2010, remittances to all developing regions continuedto grow <strong>and</strong> have now surpassed their pre-crisislevels. A similar development seems to have affectedtourism, with tourist arrivals in Asia <strong>and</strong> the Pacific, aswell as in the Americas, falling considerably in early2009, but subsequently recovering.Inflation in many EMCs rose considerably in2007 <strong>and</strong> early 2008, owing to increases in commodityprices, particularly for food <strong>and</strong> fuel, as well asbooming credit <strong>and</strong> monetary expansion (Figure 9).However, that pattern was reversed in late 2008, asprice pressures receded with the collapse in globaldem<strong>and</strong>. Following an initial pickup in economicgrowth, mainly associated with relatively expansionarymacroeconomic policies, inflationary pressuresresumed in many EMCs in 2011, along with the rise incommodity prices. While many advanced economiescontinued to implement expansionary monetary policies,a number of EMCs, particularly in Asia, begantightening monetary policy with a view to reduceinflationary pressures. However, global growth hasFigure10Inflation rate (In percent)Source: IMF World Economic Outlook
since weakened, bringing down growth <strong>and</strong> inflationin EMCs. This, in the context of slow domestic<strong>and</strong> foreign dem<strong>and</strong> <strong>and</strong> low external interest rates,allowed policy makers to relax or reverse the tighteningof monetary policies. In contrast to 2011, whenmonetary policy was contractionary in EMCs <strong>and</strong>expansionary in advanced economies, monetarypolicy is now once again largely expansionary aroundthe world, as it was in 2009 (Figure 9).In recent years, public finances of many advancedcountries have worsened dramatically, owing primarilyto the decline in revenue caused by sluggisheconomic activity, especially in the U.S. <strong>and</strong> Europe.Fiscal stimulus packages also contributed somewhatto that worsening. For some countries with largestocks of debt outst<strong>and</strong>ing before the crisis, higherborrowing costs have also affected their fiscal situations.<strong>The</strong> uncertainty associated with these debtissues has since contributed to lower dem<strong>and</strong> in theadvanced countries, which in turn has hurt the recoveriesof the EMCs through all channels.Moreover, the protracted difficulties faced bythe advanced countries <strong>and</strong> their associated sluggishrecovery, together with constraints in the EMCsthemselves, limited the ability of EMC policy makersto unwind more rapidly the stimulus measuresthey had implemented in the aftermath of the globalfinancial crisis. In these circumstances, relative to2008, public finances have weakened in most EMCs,monetary policies have remained relatively expansionary—leadingto asset bubbles in some countries(Brazil, China)—<strong>and</strong> the soundness of financial systemshas deteriorated. This, in turn, has reduced theroom EMC policy makers have to respond to externaldevelopments.III. <strong>The</strong> <strong>Resilience</strong> <strong>Index</strong>As noted above, by the time of the global financialcrisis, EMCs had clearly increased, in varyingdegrees, their ability to absorb <strong>and</strong> recover froman external shock. In an attempt to underst<strong>and</strong>this increased ability or resilience, we developed a<strong>Resilience</strong> <strong>Index</strong>. “In contrast to the traditional vulnerabilityelements, which can explain the susceptibilityto shocks, the <strong>Resilience</strong> <strong>Index</strong> intends to identifythe factors that have increased the capacity of manyEMCs to absorb external shocks <strong>and</strong> to respondeffectively. Put differently, while individual EMCs maybe confronted with similar external shocks, the moreresilient ones will be expected to be able to absorbthe shock, respond effectively, <strong>and</strong> recover fasterthan the others.” 14<strong>The</strong> <strong>Resilience</strong> <strong>Index</strong> includes the macroeconomicpolicy <strong>and</strong> financial soundness elements of typicalvulnerability exercises as well as important structural<strong>and</strong> institutional aspects of the economy, such as thequality of the civil service, governance, export dependency<strong>and</strong> diversity, externally financed private debt,<strong>and</strong> the relative size of reserves (see Box 1). Whilethe first group of elements provides a measure of thecapacity <strong>and</strong> space for policy makers to adopt correctivepolicies, the second group provides a sense ofthe capacity or flexibility of the economy to respondeffectively to such policies. <strong>The</strong> combination of thesetwo groups of elements gives a comprehensive viewof the resilience of an economy. For instance, for twocountries with roughly the same fundamentals, the14 See: <strong>The</strong> New <strong>Resilience</strong> of Emerging Market Countries:Weathering the Recent Crisis in the Global Economy, by JackBoorman, Jose Fajgenbaum, Manu Bhaskaran, Harpaul AlbertoKohli <strong>and</strong> Drew Arnold, Emerging Market Forum, October 2010.Page 12.
THE CENTENNIAL RESILIENCE INDEX: EXPANDING ITS COVERAGE AND TESTING ITS PREDICTIVE POWERFigure11115110105100Elements of the resilience index by groups of countries9590Government effectiveness115110Advanced 105economies100EMCs95All90GovernanceAdvancedeconomiesEMCsAll8519971998199920002001200220032004200520062007200820092010201185199719981999200020012002200320042005200620072008200920102011Monetary policyExport diversity1151151101101051009590AdvancedeconomiesEMCsAll1051009590AdvancedeconomiesEMCsAll8519971998199920002001200220032004200520062007200820092010201185199719981999200020012002200320042005200620072008200920102011Export independenceExternal robustness115115110110105100AdvancedeconomiesEMCs105100AdvancedeconomiesEMCs9590All9590All8585199719981999200020012002200320042005200620072008200920102011199719981999200020012002200320042005200620072008200920102011Source: <strong>Centennial</strong> Group International, <strong>Resilience</strong> <strong>Index</strong>.
Figure11Elements of the resilience index by groups of countriesPrivate debtReserves115115110110105100AdvancedeconomiesEMCs105100AdvancedeconomiesEMCs9590All9590All8585199719981999200020012002200320042005200620072008200920102011199719981999200020012002200320042005200620072008200920102011Banking soundness1151101051009590AdvancedeconomiesEMCsAll85199719981999200020012002200320042005200620072008200920102011Source: <strong>Centennial</strong> Group International, <strong>Resilience</strong> <strong>Index</strong>.one with the stronger structural features will likely bemore resilient.As indicated earlier, the number of EMCs forwhich the <strong>Index</strong> is calculated has increased fromabout 30 to 72. 15 In addition, Euro-zone countries<strong>and</strong> other advanced countries (25 countries in total)have been added in an attempt to assess, inter alia,whether the <strong>Resilience</strong> <strong>Index</strong> could have predicted15 Appendix 2 includes a list of the countries covered in thispaper.the difficulties affecting some of the countries of thezone. 1616 While the causes of the difficulties of these countries aredomestic, i.e., the asset bubbles (particularly Irel<strong>and</strong> <strong>and</strong> Spain)<strong>and</strong> subsequent bail out of the banking system by the governments,<strong>and</strong> the large sovereign debts <strong>and</strong> weak fiscal policies(Greece, Italy, <strong>and</strong> Portugal), they were triggered or compoundedby the global financial crisis. <strong>The</strong> inclusion of other advancedcountries in addition to the Euro-zone countries reflects theneed to provide the factor analysis model a balanced <strong>and</strong>comprehensive data set for the factor analysis to identify positive<strong>and</strong> negative associations between component variables inorder to distinguish between good <strong>and</strong> bad. If the only observationsused to generate it are from only the poor performers, itwill not be possible to properly distinguish good from bad.
Figure14Fiscal Policy Score for selected groups of countries11511010510095AdvancedeconomiesEMCsAll9085199719981999200020012002200320042005200620072008200920102011Source: <strong>Centennial</strong> Group International, <strong>Resilience</strong> <strong>Index</strong>.the private sector <strong>and</strong> its rate of change have beenadded to have a more comprehensive measure ofprivate credit expansion <strong>and</strong> its possible effects onasset bubbles.IV. Results of the update<strong>The</strong> updated—though preliminary—estimates ofthe <strong>Resilience</strong> <strong>Index</strong> for EMCs <strong>and</strong> new calculationsfor the advanced countries are summarized in Figure11. <strong>The</strong>y confirm that many EMCs had significantlystrengthened their resilience to external shocks priorto the global financial crisis. <strong>The</strong>y also show a considerablesteady deterioration in the <strong>Resilience</strong> <strong>Index</strong>of the advanced countries, particularly since 2003(Figure 12 <strong>and</strong> 13).Not surprisingly, the major decline in the FiscalPolicy element since the global crisis st<strong>and</strong>s out for allgroups of countries (Figure 14). This decline reflectsthe revenue weakness associated with the recession<strong>and</strong> continued sluggishness of economic activity aswell as the impact of the fiscal stimulus packagesadopted by a great number of countries. <strong>The</strong> revenuedeclines, in particular, have led to large increasesin public debt, a key input for this element. In manycases, these increases have resulted in considerablepublic finance difficulties, which are leading to, orthreatening to lead to, major crises in certain countries.It should be noted, however, that policy makersof many EMCs slowed the anticipated unwinding ofthe fiscal stimulus packages in the face of weak economicgrowth resulting from the continued sluggishnessin the dem<strong>and</strong> for their exports.Turning to the EMCs, Figure 15 presents the<strong>Resilience</strong> Indices for a number of selected countriesthat had strengthened their resilience significantly
THE CENTENNIAL RESILIENCE INDEX: EXPANDING ITS COVERAGE AND TESTING ITS PREDICTIVE POWERFigure15Selected EMCs with strong resilience scores before the crisis12512011511010510095908580EMCsChinaBrazilIndonesiaPhilippinesRussiaUg<strong>and</strong>a751997199819992000200120022003200420052006200720082009201020111251201151101051009590858075199719981999200020012002200320042005200620072008200920102011EMCsIsraelTurkeyColombiaMoroccoPeruThail<strong>and</strong>MalaysiaSource: <strong>Centennial</strong> Group International, <strong>Resilience</strong> <strong>Index</strong>.
Figure16Selected EMCs with strengthening resilience scores after the crisis1251201151101051009590858075199719981999200020012002200320042005200620072008200920102011EMCsChinaIndonesiaIsraelLebanonPhilippinesKoreaSource: <strong>Centennial</strong> Group International, <strong>Resilience</strong> <strong>Index</strong>.Figure17Selected EMCs with weakening resilience scores after the crisis12512011511010510095908580751997 1999 2001 2003 2005 2007 2009 2011EMCsBrazilColombiaEcuadorSlovak RepublicSloveniaTanzaniaUg<strong>and</strong>aSource: <strong>Centennial</strong> Group International, <strong>Resilience</strong> <strong>Index</strong>.
THE CENTENNIAL RESILIENCE INDEX: EXPANDING ITS COVERAGE AND TESTING ITS PREDICTIVE POWERFigure18Selected EMCs with significant deterioration in resilience scores125115Advanced economiesexcluding peripheralcountriesGreece105Spain95Portugal85Italy75199719981999200020012002200320042005200620072008200920102011Irel<strong>and</strong>125115105958575199719981999200020012002200320042005200620072008200920102011Advanced economiesUnited StatesUnited KingdomEurozone (excludingperipheral eurozonecountries)JapanEurozone peripheralcountriesSource: <strong>Centennial</strong> Group International, <strong>Resilience</strong> <strong>Index</strong>.
above the average for this group of countries in theperiod prior to the global financial crisis.Importantly, a significant number of these countrieshave further strengthened their resilience inrecent years (Figure 16). This was achieved byreinforcing the elements that underlie their scores forMonetary Policy, Bank Soundness, External Robustness,<strong>and</strong>, in some cases, Reserves, while reducingvulnerabilities, such as excessive Private Debtincreases.However, the resilience of many EMCs has beeneroded since the onset of the global crisis (Figure17 shows a sample of these countries), reflecting aconsiderable weakening in the Fiscal Policy elementin most cases, as well as a deterioration in the BankSoundness <strong>and</strong> Export Independence elements.Moreover a significant number of EMCs appear to beat risk from low resilience, in the face of the currentweaknesses in the global environment. This suggeststhat policy makers need to strengthen the frail elementsof their countries’ <strong>Resilience</strong> <strong>Index</strong>.But what is most interesting is the abovementionedconsiderable <strong>and</strong> steady decline in theresilience of the sample of advanced countries since2003. 17 This decline reflects a generalized weakeningin the Fiscal Policy <strong>and</strong> Bank Soundness elements(Figure 18), offset in part by improvements in theExternal Robustness element that had weakenedconsiderably in earlier years. Similarly, some counties(Icel<strong>and</strong>, Norway) show an increase in the ExportIndependence element in recent years. A number ofadvanced countries, particularly those that had experiencedasset bubbles <strong>and</strong>/or are having sovereigndebt difficulties, show a strengthening of the Private17 It should be noted, however, that Denmark <strong>and</strong> Norway have shownsteady improvements in their <strong>Resilience</strong> <strong>Index</strong> during the period under review,while the Netherl<strong>and</strong>s, New Zeal<strong>and</strong>, <strong>and</strong> Sweden show improvements since2007 <strong>and</strong> Icel<strong>and</strong> shows a significant turn around since 2010.Debt element, which had greatly deteriorated prior to2008, reflecting the effects of deleveraging.Of course, the aggregate masks the severedeterioration in the <strong>Resilience</strong> <strong>Index</strong> of a relativelysmall group of countries. Not surprisingly, the groupincludes Greece, Irel<strong>and</strong>, Italy, Portugal, <strong>and</strong> Spain(see Figure 18). While still at or above the averageresilience indices for advanced economies, the UK,<strong>and</strong> to a lesser extent the US <strong>and</strong> Japan, have showna considerable weakening of their resilience. <strong>The</strong> keyelements responsible for this deterioration have beenFiscal Policy <strong>and</strong> Bank Soundness while ExternalRobustness has helped strengthen resilience (exceptin the case of Portugal). Similarly, reductions in PrivateCredit expansion since 2007– 08 (associated with deleveraging<strong>and</strong> loan defaults) appear as having helpedstrengthen resilience.V. Conclusion<strong>The</strong> resilience of a country is a function of manyfactors. <strong>The</strong>se include the quality of the government,<strong>and</strong> governance in general; the strength of its institutions,especially the economic <strong>and</strong> financial policymakinginstitutions in the country ; the soundnessof its banking sector—<strong>and</strong> the financial sector morebroadly; the structure of the economy—includingsuch things as its export dependency <strong>and</strong> diversity,its openness to global financial markets, <strong>and</strong> othersuch factors; <strong>and</strong> its policy-making space at anygiven time, particularly in the areas of fiscal, monetary<strong>and</strong> reserves policies.In this paper, we report on the first results of effortsto improve the index <strong>and</strong> to exp<strong>and</strong> its countrycoverage. Five things have been done: (1) some ofthe underlying variables that were included in theoriginal index have been modified; (2) the numberof countries for which the index is calculated hasbeen significantly increased, including coverage of
THE CENTENNIAL RESILIENCE INDEX: EXPANDING ITS COVERAGE AND TESTING ITS PREDICTIVE POWERmany advanced economies; (3) the capacity of theindex to have identified the risks that were emergingin the advanced countries before the crisis in2007/2008 is tested. Similarly, the index is used toexplore whether it would have had predictive powerto identify those countries in Europe worst affected bythe euro-area crisis <strong>and</strong> to highlight the major areasof vulnerability in those countries; (4) the impact oncountries’ resilience from the global crisis that beganin 2007/2008—<strong>and</strong> their responses to it, is examined;(5) the index is used to look forward, to identifycountries <strong>and</strong> regions that appear to be at risk fromlow resilience in the face of current weak- nesses inthe global system.What conclusions can be drawn from this work?<strong>The</strong> first is that the index appears to have the powerboth to identify economies that are heading fortrouble <strong>and</strong> to isolate the specific policy areas ofweakness that lie behind their increasing vulnerability.<strong>The</strong> second conclusion is the more troubling.<strong>The</strong>re was an obvious failure by the various surveillancemechanisms in the global system to fully <strong>and</strong>accurately identify the major vulnerabilities that wereemerging in so many countries. It is not that nothingof these emerging problems was seen. Obviouslythey were, including the housing bubbles in a numberof countries—<strong>and</strong> the associated explosion in privatesector debt; the fiscal problems in the U.S. <strong>and</strong> insome other countries; <strong>and</strong>, at least at the BIS, someof the problems developing in the global financialsystem, including those in some of the major financialcenters, but the implications of some of the vulnerabilitieswere not sufficiently explored.<strong>The</strong> <strong>Resilience</strong> <strong>Index</strong> shows clearly that emergingweaknesses in many economies were evidentwell before the global crisis <strong>and</strong> well before the crisisin Europe. <strong>The</strong> <strong>Resilience</strong> index can add to the toolsof the surveillance process—at least as a device tohelp insure that vulnerabilities are surfaced, <strong>and</strong> thatdeeper analysis is conducted to asses those vulnerabilities<strong>and</strong> suggest corrective policies.
Appendix 1As shown in the diagram, the <strong>Resilience</strong> indexis calculated by aggregating ten subindices, each ofwhich aggregates underlying variables. <strong>The</strong> numberin parentheses states how many underlying variablesare used to compute that element (where there is nonumber in parentheses, that element equals the averageof the sub-elements beneath it, which have beennormalized).Unless there is only one variable in an element,factor analysis is used to generate the score. <strong>The</strong>data sample for which scores are calculated <strong>and</strong> lateranalyzed (97 countries from 1997–2011) is the sameas the sample used to generate the factors. We usethe principal-component factor method to identifythe unobserved latent variables, with the constraintthat the factor analysis should not use more than twosuch factors. <strong>The</strong>n, except in the case of income risk,we perform a varimax rotation. drop the second factor<strong>and</strong> take the first factor to be the element score.We also generate st<strong>and</strong>ard errors for each measurementso that users may identify which differencesin scores are meaningful <strong>and</strong> which are not. For all ofthese, we use a maximum-likelihood factor analysis,a varimax rotation, <strong>and</strong> a bordered informationmatrix with analytic derivatives. <strong>The</strong>se st<strong>and</strong>ard errorsincorporate two uncertainties: <strong>The</strong> first reflects ourimperfect estimates to fill in missing data. <strong>The</strong> secondreflects how well the factor model fits the indicators:this derives from the intrinsic problem, even withperfect data, of measuring such difficult-to-pin-downconcepts as resilience on a single numerical scalewith necessarily imperfect indicators.For a more detailed explanation of the statisticalmethodology <strong>and</strong> coding, see the <strong>Centennial</strong> <strong>Index</strong>Structure of the <strong>Resilience</strong> <strong>Index</strong>(Numbers in parentheses indicate how many variables(components) of raw data go into each element.)of Financial Development <strong>and</strong> Strength, from whichthese are taken. 1818 Sundararajan, V. S., H. A. Kohli, C. Loser, H. Kohli, & A. Goldstein. (2008). “<strong>Centennial</strong>Group <strong>and</strong> Emerging Markets present <strong>The</strong> 2008 FDS <strong>Index</strong>: <strong>Index</strong> of FinancialDevelopment <strong>and</strong> Stability.” Emerging Markets Newspaper, Euromoney, 2008/10/10.Kohli, H. (2009). “<strong>Centennial</strong> Group & Emerging Markets present <strong>The</strong> 2009 FDS<strong>Index</strong>: <strong>Index</strong> of financial development & strength.” Emerging Markets Newspaper,Euromoney, 2009/10/06.
THE CENTENNIAL RESILIENCE INDEX: EXPANDING ITS COVERAGE AND TESTING ITS PREDICTIVE POWER<strong>Resilience</strong> <strong>Index</strong> Variables <strong>and</strong> Sources (Sorted by Element)Abbreviations for data sourcesBISBIS Quarterly ReviewBKSCBankscopeCBICentral Bank of Icel<strong>and</strong>: “New Inflation Targeting Countries”CIRICingranelli Richards Human Rights DatabaseDBDoing BusinessDOTIMF’s Direction of Trade StatisticsEIUEconomist Intelligence UnitERF Economic Research Forum: Working Paper 395EST<strong>Centennial</strong> EstimateEVEconviewsFHFPFreedom House’s Freedom of the PressFIEFWFraser Institute’s’s Economic Freedom of the WorldFSDWorld Bank’s “A New Database on Financial Development <strong>and</strong> Structure”GFSRIMF’s Global Financial Stability ReportGIBRGlobal Insight Business Risk <strong>and</strong> ConditionsHBSBHarvard Business School Case: “Brazil 2003: Inflation Targeting & Debt Dynamics”HFHeritage Foundation’s <strong>Index</strong> of Economic FreedomIAERTR International Advances in Economic Research: “Taylor Rule in Practice: Evidence from Turkey ” (2008)IFSIMF’s International Financial StatisticsIMFDSBBIMF’s Dissemination St<strong>and</strong>ards Bulletin BoardIMFFXIMF’s Classification of Exchange Rate Arrangements <strong>and</strong> Monetary FrameworksIMF267 IMF’s Occasional Paper 267IMFSIMF Survey MagazineIRAE International Review of Applied Economics: J. Jim (2008)ITKYangu: Inflation Targeting in Kenya?JMIBJournal of Money, Investment, & Banking 2009: “Is Nigeria Ready for Inflation Targeting?”PACPackard 2007: “Monetary Policy in Viet Nam”PRSPolitical Risk ServicesRJEF Romanian Journal of Economic Forecasting: Daianu & Kallai (2008)ROURoubini Global EconomicsSGSiregar & Goo 2008: “Inflation Targeting Policy”UNCUNCTADstatTITransparency InternationalWBBRWorld Bank’s Banking Regulation SurveyWDIWorld Bank’s World Development IndicatorsWEO IMF’s World Economic Outlook (April 2010)WGIWorldwide Governance Indicators* / ** indicates that a log transformation was applied to the variable: * represents log 10(1+x) <strong>and</strong> ** represents log 10(x)Fiscal Policy Soundness• WEO, EIU, IFS, WDI, & EST: Public debt to GDP*• WEO, EIU, IFS, WDI, & EST: Change in Ratio of Public debt to GDP (Average over past 3 years)*Government Effectiveness• PRS: Score for Bureaucratic Quality, as calculated by the WGI for their Government Effectiveness subindex• GIBR: Average of 2 scores: Policy Consistency/Forward Planning <strong>and</strong> Bureaucracy, as calculated by the WGI, as aboveMonetary Policy• WEO & EV: Inflation (Year-End CPI) minus the Average Inflation in G7 Countries*• WEO & EV: St<strong>and</strong>ard Deviation of Inflation (Year-End CPI) over past 3 years*• IMFS, IMF267, ITK, CBI, HBSB, PAC, IRAE, SG, RJEF, ROU, ERF, IAERTR, IMFFX, & EST: Is the country inflation targeting?Corporate Governance• WBBR: Sum of 2 questions: Must Banks Disclose <strong>The</strong>ir Risk Management Procedures or Off-Balance Sheet Items to the Public?
<strong>Resilience</strong> <strong>Index</strong> Variables <strong>and</strong> Sources (Sorted by Element)• WBBR: Do Regulations Require Credit Ratings for Commercial Banks?• DB: Credit Depth of Information <strong>Index</strong>• FHFP: Sum of two Press Freedom Indicators: Economic Environment <strong>and</strong> Political Environment• WBBR: Are the Following Bank Activities Rated? Bonds Issuance, Commercial Paper Issuance, Other activity (Certificates ofDeposit, Pension & Mutual Funds, Insurance Companies, Financial Guarantees, etc)Legal• GIBR: Red Tape & Bureaucratic Corruption score, as calculated by WGI for their Corruption sub-index• GIBR: Average of 2 scores: Business Legislation & Tax Effectiveness, as calculated by WGI for their Regulatory Quality subindex• GIBR: Average of 2 scores: Judicial Independence & Business Crime Risk, as calculated by WGI for their Rule of Law sub-index• CIRI: Independence of Judiciary• DB: Legal Rights of Borrowers <strong>and</strong> Lenders <strong>Index</strong>• HF: Property Rights• FIEFW: Legal Structure <strong>and</strong> Security of Property Rights• DB: Sum of two Doing Business Indicators: Shareholder Suits & Director LiabilityPolicy Transparency• TI: Corruption Perceptions <strong>Index</strong>• FHFP: Laws & Regulations Influence on Media Content• IMFDSBB: Does the country subscribe to the IMF’s Special or General Data Dissemination St<strong>and</strong>ardsAsset Quality• BKSC, GFSR, & WDI: Bank Nonperforming Loans to Total Loans*• BKSC: Impaired Loans to Equity*• BKSC, GFSR, & WDI: Bank Nonperforming Loans Net of Provisions to Total Loans* (floor set at -20%)Capital Base• WBBR: Does accrued, though unpaid, interest/principal enter the income statement while the loan is still non-performing?• BKSC: Equity to Total Assets*• BKSC: Equity to Net Loans*• BKSC: Equity to Liabilities*• BKSC: Equity to Deposits <strong>and</strong> Short-Term Funding*• BKSC: Tier One Ratio (Aggregate)*Income Risk• FSD, GFSR, & BKSC: Bank Return on Assets• BKSC: Pre-Tax Operating Income to Average Assets*• BKSC: Other Operating Income to Average Assets*• BKSC: Net Interest Revenue to Average Assets*• BKSC: Interest Margin to Gross Income*• FSD & BKSC: Net Interest Margin (Accounting value of bank’s net interest revenue as a share of its interest-bearing assets)*Export Diversity• DOT & EST: Coefficient of Variation of Export Shares by Destination**• UNC: Merch<strong>and</strong>ise Exports: Concentration <strong>Index</strong>Export Independence:• IFS & WEO: Exports to GDP*External Robustness• WEO: Current Account Balance to GDP*• BIS, IFS, & EST: Reserves to Short-Term Debt**• IFS & EIU: Import Cover: Total Reserves Minus Gold to Months of Imports**• IMFFX, WEO: Measure of Exchange Rate Regime’s Ability to Weather Crisis (Exchange Rate Regime adjusted for Reserves)
THE CENTENNIAL RESILIENCE INDEX: EXPANDING ITS COVERAGE AND TESTING ITS PREDICTIVE POWER<strong>Resilience</strong> <strong>Index</strong> Variables <strong>and</strong> Sources (Sorted by Element)Private Debt• BIS & WEO: Change Over 3 Years in the Ratio of Total Foreign Claims of BIS-Reporting Banks to GDP* (floor set at -20%)• BIS & WEO: Total Foreign Claims of BIS-Reporting Banks to GDP*• BIS, IFS, & EST: Change Over 2 Years in the Ratio of Loans from BIS-Reporting Banks to Private Credit by Domestic DepositMoney Banks* (floor of -20%)• IFS, WEO, & EST: Private Credit by Deposit Money Banks to GDP*• IFS, WEO, & EST: Change over 3 years of the Ratio of Private Credit by Deposit Money Banks to GDP*Reserves• IFS, WEO, & EIU: Total Reserves Minus Gold to GDP*• IFS & WEO: Net International Investment Position to GDP*Note: A two-year moving average was applied to all Asset Quality, Capital Base, <strong>and</strong> Income Risk variables.A three-year movingaverage was applied to the first <strong>and</strong> third Private External Debt variables.Note: <strong>The</strong> types of financial firms included in the Bankscope search criteria used for for all Bankscope data are Commerical Banks,Savings Banks, Cooperative Banks, Real Estate <strong>and</strong> Mortgage Banks, Islamic Banks, Other Non-Banking Credit Institutions, Micro-Financing Institutions, <strong>and</strong> Credit Card, Factoring, <strong>and</strong> Leasing Finance Companies.
Appendix 2List of CountriesAdvanced countries: Australia, Austria, Belgium, Canada, Cyprus, Czech Republic, Denmark, Finl<strong>and</strong>, France, Germany, Greece,Hong Kong, Icel<strong>and</strong>, Irel<strong>and</strong>, Israel, Italy, Japan, Korea, Luxembourg, Netherl<strong>and</strong>s, New Zeal<strong>and</strong>, Norway, Portugal, Singapore,Slovak Republic, Slovenia, Spain, Sweden, Switzerl<strong>and</strong>, United Kingdom, United StatesCentral & Eastern Europe: Albania, Bosnia & Herzegovina, Croatia, Estonia, Hungary, Latvia, Lithuania, Pol<strong>and</strong>, Romania, TurkeyCommonwealth of Independent States: Armenia, Azerbaijan, Belarus, Georgia, Kazakhstan, Moldova, Russia, UkraineDeveloping Asia: Bangladesh, Cambodia, China, India, Indonesia, Malaysia, Pakistan, Philippines, Sri Lanka, Thail<strong>and</strong>, VietnamMiddle East <strong>and</strong> North Africa: Algeria, Bahrain, Egypt, Jordan, Lebanon, Morocco, Saudi Arabia, Tunisia, United Arab EmiratesSub-Saharan Africa: Botswana, Côte d’Ivoire, Ethiopia, Ghana, Kenya, Mauritius, Mozambique, Nigeria, Senegal, South Africa,Tanzania, Ug<strong>and</strong>a, ZambiaWestern Hemisphere: Argentina, Bolivia, Brazil, Chile, Colombia, Costa Rica, Dominican Republic, El Salvador, Guatemala,Mexico, Panama, Peru, Trinidad <strong>and</strong> Tobago, Uruguay, Venezuela
THE CENTENNIAL RESILIENCE INDEX: EXPANDING ITS COVERAGE AND TESTING ITS PREDICTIVE POWER<strong>Resilience</strong> <strong>Index</strong> <strong>and</strong> ElementScores by Country over TimeAlbaniaAlgeriaArgentinaArmeniaAustralia
AustriaAzerbaijanBahrainBangladeshBelarusBelgium
THE CENTENNIAL RESILIENCE INDEX: EXPANDING ITS COVERAGE AND TESTING ITS PREDICTIVE POWERBoliviaBosnia & HerzegovinaBotswanaBrazilCambodiaCanada
ChileColombiaCôte d’IvoireChinaCosta RicaCroatia7580859095100105110115120125199719981999200020012002200320042005200620072008200920102011 75808590951001051101151201251997199819992000200120022003200420052006200720082009201020117580859095100105110115120125199719981999200020012002200320042005200620072008200920102011758085909510010511011512012519971998199920002001200220032004200520062007200820092010201175808590951001051101151201251997199819992000200120022003200420052006200720082009201020117580859095100105110115120125199719981999200020012002200320042005200620072008200920102011
THE CENTENNIAL RESILIENCE INDEX: EXPANDING ITS COVERAGE AND TESTING ITS PREDICTIVE POWERCyprusCzech RepublicDenmarkDominican RepublicEgyptEl Salvador
EstoniaFinl<strong>and</strong>GeorgiaEthiopiaFranceGermany758085909510010511011512012519971998199920002001200220032004200520062007200820092010201175808590951001051101151201251997199819992000200120022003200420052006200720082009201020117580859095100105110115120125199719981999200020012002200320042005200620072008200920102011758085909510010511011512012519971998199920002001200220032004200520062007200820092010201175808590951001051101151201251997199819992000200120022003200420052006200720082009201020117580859095100105110115120125199719981999200020012002200320042005200620072008200920102011
THE CENTENNIAL RESILIENCE INDEX: EXPANDING ITS COVERAGE AND TESTING ITS PREDICTIVE POWER1251201151101051009590858075Ghana1997199819992000200120022003200420052006200720082009201020111251201151101051009590858075Greece199719981999200020012002200320042005200620072008200920102011GuatemalaHong Kong, China12512512012011511511011010510510095908580751997199819992000200120022003200420052006200720082009201020111009590858075199719981999200020012002200320042005200620072008200920102011HungaryIcel<strong>and</strong>12512011511010510095908580751997199819992000200120022003200420052006200720082009201020111251201151101051009590858075199719981999200020012002200320042005200620072008200920102011
IndiaIrel<strong>and</strong>ItalyIndonesiaIsraelJapan758085909510010511011512012519971998199920002001200220032004200520062007200820092010201175808590951001051101151201251997199819992000200120022003200420052006200720082009201020117580859095100105110115120125199719981999200020012002200320042005200620072008200920102011758085909510010511011512012519971998199920002001200220032004200520062007200820092010201175808590951001051101151201251997199819992000200120022003200420052006200720082009201020117580859095100105110115120125199719981999200020012002200320042005200620072008200920102011
THE CENTENNIAL RESILIENCE INDEX: EXPANDING ITS COVERAGE AND TESTING ITS PREDICTIVE POWER1251201151101051009590858075Jordan1997199819992000200120022003200420052006200720082009201020111251201151101051009590858075Kazakhstan199719981999200020012002200320042005200620072008200920102011KenyaKorea12512512012011511511011010510510095908580751997199819992000200120022003200420052006200720082009201020111009590858075199719981999200020012002200320042005200620072008200920102011LatviaLebanon12512011511010510095908580751997199819992000200120022003200420052006200720082009201020111251201151101051009590858075199719981999200020012002200320042005200620072008200920102011
CilY OF SHAWNEEPUBLIC HEARING NOTICECASE #P04-13Notice is hereby given that the City of Shawnee, Oklahoma, will conduct a public hearing on aproposed Rezone of property located within the City of Shawnee.<strong>The</strong> property requesting rezoning is described as follows :A tract of l<strong>and</strong> ~ltuated wlthln a portion of the NtirthQast Quarter (NE/4) of SBdion Eight (S),Townahlp Te n. (10) Notth 1 "ange rour (4) ~a~t of thf.! Indian M~ridian~ Pottawatomle cout~ty,OLI . - ~a . h01n: -""'a . ~ b. .ij_ · I no-- ·Q!l •O r ~;~p a"'*l _ ,~c ularl .: y d .. e$c rib. . . e -.d· as - f o ll o .. w"' ~: \.;lo"'"'~n"' ,.. ............. -"ind · ll!~h ~ th"'. 1\:iN .O•Leas .... h -t"" '"o· rn· er .of $aid Northeast
THE CENTENNIAL RESILIENCE INDEX: EXPANDING ITS COVERAGE AND TESTING ITS PREDICTIVE POWER1251201151101051009590858075Morocco1997199819992000200120022003200420052006200720082009201020111251201151101051009590858075Mozambique199719981999200020012002200320042005200620072008200920102011Netherl<strong>and</strong>sNew Zeal<strong>and</strong>12512512012011511511011010510510095908580751997199819992000200120022003200420052006200720082009201020111009590858075199719981999200020012002200320042005200620072008200920102011NigeriaNorway12512011511010510095908580751997199819992000200120022003200420052006200720082009201020111251201151101051009590858075199719981999200020012002200320042005200620072008200920102011
PakistanPeruPol<strong>and</strong>PanamaPhilippinesPortugal758085909510010511011512012519971998199920002001200220032004200520062007200820092010201175808590951001051101151201251997199819992000200120022003200420052006200720082009201020117580859095100105110115120125199719981999200020012002200320042005200620072008200920102011758085909510010511011512012519971998199920002001200220032004200520062007200820092010201175808590951001051101151201251997199819992000200120022003200420052006200720082009201020117580859095100105110115120125199719981999200020012002200320042005200620072008200920102011
THE CENTENNIAL RESILIENCE INDEX: EXPANDING ITS COVERAGE AND TESTING ITS PREDICTIVE POWER1251201151101051009590858075Romania1997199819992000200120022003200420052006200720082009201020111251201151101051009590858075Russia199719981999200020012002200320042005200620072008200920102011Saudi ArabiaSenegal12512512012011511511011010510510095908580751997199819992000200120022003200420052006200720082009201020111009590858075199719981999200020012002200320042005200620072008200920102011SingaporeSlovak Republic12512011511010510095908580751997199819992000200120022003200420052006200720082009201020111251201151101051009590858075199719981999200020012002200320042005200620072008200920102011
SloveniaSpainSwedenSouth AfricaSri LankaSwitzerl<strong>and</strong>758085909510010511011512012519971998199920002001200220032004200520062007200820092010201175808590951001051101151201251997199819992000200120022003200420052006200720082009201020117580859095100105110115120125199719981999200020012002200320042005200620072008200920102011758085909510010511011512012519971998199920002001200220032004200520062007200820092010201175808590951001051101151201251997199819992000200120022003200420052006200720082009201020117580859095100105110115120125199719981999200020012002200320042005200620072008200920102011
THE CENTENNIAL RESILIENCE INDEX: EXPANDING ITS COVERAGE AND TESTING ITS PREDICTIVE POWER1251201151101051009590858075Tanzania1997199819992000200120022003200420052006200720082009201020111251201151101051009590858075Thail<strong>and</strong>199719981999200020012002200320042005200620072008200920102011Trinidad <strong>and</strong> TobagoTunisia12512512012011511511011010510510095908580751997199819992000200120022003200420052006200720082009201020111009590858075199719981999200020012002200320042005200620072008200920102011TurkeyUg<strong>and</strong>a12512011511010510095908580751997199819992000200120022003200420052006200720082009201020111251201151101051009590858075199719981999200020012002200320042005200620072008200920102011
UkraineUnited KingdomUruguayUnited Arab EmiratesUnited StatesVenezuela758085909510010511011512012519971998199920002001200220032004200520062007200820092010201175808590951001051101151201251997199819992000200120022003200420052006200720082009201020117580859095100105110115120125199719981999200020012002200320042005200620072008200920102011758085909510010511011512012519971998199920002001200220032004200520062007200820092010201175808590951001051101151201251997199819992000200120022003200420052006200720082009201020117580859095100105110115120125199719981999200020012002200320042005200620072008200920102011
THE CENTENNIAL RESILIENCE INDEX: EXPANDING ITS COVERAGE AND TESTING ITS PREDICTIVE POWER1251201151101051009590858075Vietnam199719981999200020012002200320042005200620072008200920102011Zambia1251201151101051009590858075199719981999200020012002200320042005200620072008200920102011
<strong>The</strong> Emerging Markets Forum was created by the <strong>Centennial</strong> Group as a not-for-profitinitiative to bring together high-level government <strong>and</strong> corporate leaders from around theworld to engage in dialogue on the key economic, financial <strong>and</strong> social issues facingemerging market countries (EMCs). <strong>The</strong> Forum was granted the coveted 501(c) status by theU.S. Internal Revenue Service.<strong>The</strong> Forum is focused on some 70 emerging market economies in East <strong>and</strong> South Asia,Eurasia, Latin America <strong>and</strong> Africa that share prospects of superior economic performance,already have or seek to create a conducive business environment <strong>and</strong> are of near-terminterest to private investors, both domestic <strong>and</strong> international. We expect our current list ofEMCs to evolve over time, as countries’ policies <strong>and</strong> prospects change.Further details on the Forum <strong>and</strong> its meetings may be seen on our website at http://www.emergingmarketsforum.org<strong>The</strong> Watergate Office Building, 2600 Virginia Avenue, NW, Suite 201Washington, DC 20037, USA. Tel:(1) 202 393 6663 Fax: (1) 202 393 6556Email: info@emergingmarketsforum.org