Tsutomu Oohashi, Emi Nishina, Manabu Honda, Yoshiharu
Tsutomu Oohashi, Emi Nishina, Manabu Honda, Yoshiharu
Tsutomu Oohashi, Emi Nishina, Manabu Honda, Yoshiharu
- No tags were found...

You also want an ePaper? Increase the reach of your titles
YUMPU automatically turns print PDFs into web optimized ePapers that Google loves.
<strong>Tsutomu</strong> <strong>Oohashi</strong>, <strong>Emi</strong> <strong>Nishina</strong>, <strong>Manabu</strong> <strong>Honda</strong>, <strong>Yoshiharu</strong> Yonekura, YoshitakaFuwamoto, Norie Kawai, Tadao Maekawa, Satoshi Nakamura, HidenaoFukuyama and Hiroshi ShibasakiJ Neurophysiol 83:3548-3558, 2000.You might find this additional information useful...This article cites 30 articles, 4 of which you can access free at:http://jn.physiology.org/cgi/content/full/83/6/3548#BIBLMedline items on this article's topics can be found at http://highwire.stanford.edu/lists/artbytopic.dtlon the following topics:Veterinary Science .. ThalamusPhysiology .. Cerebrovascular CirculationPhysiology .. ElectroencephalographyMedicine .. Behavioral and Psychosocial IssuesMedicine .. <strong>Emi</strong>ssion-Computed Tomography (Positron <strong>Emi</strong>ssion Tomography)Physiology .. HumansUpdated information and services including high-resolution figures, can be found at:http://jn.physiology.org/cgi/content/full/83/6/3548Additional material and information about Journal of Neurophysiologyhttp://www.the-aps.org/publications/jnThis information is current as of July 2, 2007 .can be found at:Downloaded from jn.physiology.org on July 2, 2007Journal of Neurophysiology publishes original articles on the function of the nervous system. It is published 12 times a year(monthly) by the American Physiological Society, 9650 Rockville Pike, Bethesda MD 20814-3991. Copyright © 2005 by theAmerican Physiological Society. ISSN: 0022-3077, ESSN: 1522-1598. Visit our website at http://www.the-aps.org/.
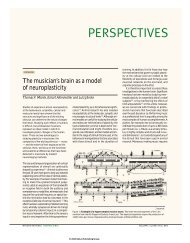
BIOLOGICAL EFFECT OF INAUDIBLE HIGH-FREQUENCY SOUNDS3549rate of 96 kHz (Theiss and Hawksford 1997; Yamamoto 1996;Yoshikawa et al. 1995, 1997), none of these studies has convincinglyexplained the biological mechanism of the phenomenon.This may reflect in part the limitations of the conventionalaudio engineering approach for determining soundquality, which is solely based on a subjective evaluation obtainedvia questionnaires.There are two factors that may have some bearing on thisissue. First, it has been suggested that infrasonic exposure maypossibly have an adverse effect on human health (Danielssonand Landstrom 1985), suggesting that the biological sensitivityof human beings may not be parallel with the “conscious”audibility of air vibration. Second, the natural environment,such as tropical rain forests, usually contains sounds that areextremely rich in HFCs over 100 kHz. From an anthropogeneticpoint of view, the sensory system of human beingsexposed to a natural environment would stand a good chance ofdeveloping some physiological sensitivity to HFCs. It is prematureto conclude that consciously inaudible high-frequencysounds have no effect on the physiological state of listeners.In the present study, therefore, we addressed this issue byusing quantifiable and reproducible measurements of brainactivity. To measure human physiological responses to HFCs,we selected two noninvasive techniques: analysis of electroencephalogram(EEG) and positron emission tomography (PET)measurements of the regional cerebral blood flow (rCBF).These methods have complementary characteristics. EEG hasexcellent time resolution, is sensitive to the state of humanbrain functioning, and places fewer physical and mental constraintson subjects than do other techniques such as functionalmagnetic resonance imaging (fMRI). This is of special importancebecause some responses might be distorted by a stressfulmeasurement environment itself. On the other hand, PET providesus with detailed spatial information on the neuroanatomicalsubstrates of brain activity. Combining these two techniqueswith psychological assessments, we provide evidenceherein that inaudible high-frequency sounds have a significanteffect on humans.METHODSSubjectsTwenty-eight Japanese volunteers (15 males and 13 females, 19–43years old) participated in the EEG experiments; 12 Japanese volunteers (8males and 4 females, 19–34 years old) participated in the PET experiment;and 26 Japanese volunteers (15 males and 11 females, 18–31 yearsold) participated in the psychological experiment. None of the subjectshad any history of neurological or psychiatric disorders. Written informedconsent was obtained from all subjects before the experiments. The PETand EEG experiments were performed in accordance with the approval ofthe Committee of Medical Ethics, Graduate School of Medicine, KyotoUniversity. All subjects were familiar with the actual sounds of theinstruments used as a sound source.Sound materials and presentation systemsTraditional gamelan music of Bali Island, Indonesia, a naturalsound source containing the richest amount of high frequencieswith a conspicuously fluctuating structure, was chosen as the soundsource for all experiments. A traditional gamelan composition,“Gambang Kuta,” played by “Gunung Jati,” an internationallyrecognized gamelan ensemble from Bali, was recorded using aB&K 4135 microphone, a B&K 2633 microphone preamplifier,and a B&K 2804 power supplier, all manufactured by Brüel andKjær (Nærum, Denmark). The signals were digitally coded by Y.Yamasaki’s high-speed one-bit coding signal processor (UnitedStates Patent No. 5351048) (Yamasaki 1991) with an A/D samplingfrequency of 1.92 MHz and stored in a DRU-8 digital datarecorder (Yamaha, Hamamatsu, Japan). This system has a generallyflat frequency response of over 100 kHz.Most of the conventional audio systems that have been used topresent sound for determining sound quality were found to be unsuitablefor this particular study. In the conventional systems, soundscontaining HFCs are presented as unfiltered source signals through anall-pass circuit and sounds without HFCs are produced by passing thesource signals through a low-pass filter (Muraoka et al. 1978; Plengeet al. 1979). Thus the audible low-frequency components (LFCs) arepresented through different pathways that may have different transmissioncharacteristics, including frequency response and group delay.In addition, inter-modulation distortion may differentially affectLFCs. Therefore it is difficult to exclude the possibility that anyobserved differences between the two different sounds, those with andthose without HFCs, may result from differences in the audible LFCsrather than from the existence of HFCs. To overcome this problem,we developed a bi-channel sound presentation system that enabled usto present the audible LFCs and the nonaudible HFCs either separatelyor simultaneously. First, the source signals from the D/Aconverter of Y. Yamasaki’s high-speed, one-bit coding signal processorwere divided in two. Then, LFCs and HFCs were produced bypassing these signals through programmable low-pass and high-passfilters (FV-661, NF Electronic Instruments, Tokyo, Japan), respectively,with a crossover frequency of 26 or 22 kHz and a cutoffattenuation of 170 or 80 dB/octave, depending on the type of test.Then, LFCs and HFCs were separately amplified with P-800 andP-300L power amplifiers (Accuphase, Yokohama, Japan), respectively,and presented through a speaker system consisting of twincone-type woofers and a horn-type tweeter for the LFCs and adome-type super tweeter with a diamond diaphragm for the HFCs.The speaker system was designed by one of the authors (T. <strong>Oohashi</strong>)and manufactured by Pioneer Co., Ltd. (Tokyo, Japan). This soundreproduction system had a flat frequency response of over 100 kHz.The level of the presented sound pressure was individually adjusted sothat each subject felt comfortable; thus the maximum level wasapproximately 80–90 dB sound pressure level (SPL) at the listeningposition.Using the bi-channel sound presentation system, four differentsound combinations were prepared as follows: 1) full-range sound(FRS) HFC LFC; 2) high-cut sound (HCS) LFC only; 3)low-cut sound (LCS) HFC only; and, 4) baseline no soundexcept for ambient noise. All experiments were performed in anacoustically shielded room. In the PET experiment, there was avery low-level fan noise from the PET scanner, which did notannoy the subjects. Figure 1A shows the averaged power spectrumof the source signal obtained from the music with a CF-5220 fastFourier transform (FFT) analyzer (Ono Sokki, Tokyo, Japan) overan analysis period of 200 s. It contained a significant amount ofHFCs above the audible range, often exceeding 50 kHz and, atcertain times, 100 kHz. Figure 1B shows the averaged powerspectra of the actual sounds reproduced with a 22 kHz cutofffrequency for the filter and recorded at the subject’s head position.The spectrum of FRS was essentially the same as that of the sourceand contained both LFCs below and HFCs above 22 kHz. None ofthe blindfolded subjects could distinguish LCS (i.e., HFC only)from silence when it was presented alone. Therefore we concludedthat the HFC employed in the present experimental setting was, atleast, a consciously unrecognizable air vibration.Downloaded from jn.physiology.org on July 2, 2007
3550 OOHASHI ET AL.FIG. 1. Power spectra of the sound used in this study. A: the averagedpower spectrum calculated from the entire 200-s period of the recorded soundsource signal using a CF-5220 fast Fourier transform (FFT) analyzer (OnoSokki, Tokyo, Japan). It contains a significant amount of high-frequencycomponents above the audible range. B: the averaged power spectra of thesounds reproduced by the bi-channel sound presentation system (see text) indifferent conditions. The power was calculated from the signal actually recordedat the subject’s head position using a B&K 4135 microphone (Brüeland Kjær, Nærum, Denmark). The top, middle, and bottom panels representfull-range sound (FRS), high-cut sound (HCS), and low-cut sound (LCS),respectively. The power spectrum of FRS is essentially identical to the spectrumof the source and contains both a low-frequency component (LFC) (i.e.,the one used in the HCS condition) and a high-frequency component (HFC) (inthe LCS condition).EEG recordings and analysisThe EEG experiments were performed in the EEG laboratory of theNational Institute of Multimedia Education. Subjects were asked to siton a chair in a relaxed position. The distance from the speakers to thesubjects’ ears was approximately 2.5 m. Special attention was paid tothe subjects’ immediate environment to avoid discomfort. For example,the room was decorated with plants, lacquered masks, and landscapepaintings. The equipment for the EEG recordings was hiddenfrom the subjects’ view and all cables for the experimental equipmentwere in a pit below the floor. The subjects were instructed to enjoy themusic without any cognitive tasks during the sound presentation. Thesubjects were able to see outdoors through a wide, double-glasswindow that acoustically shielded the experimental room from outsidesounds. Two different EEG experiments were performed. In the firstexperiment, to explore the physiological effect of sounds with anonaudible frequency range, we employed a strictly controlled experimentalsetting of sound presentation combined with conventionalEEG measurements. In the second experiment, the same effect wasexamined under more ordinary listening conditions.EXPERIMENT 1. To examine the physiological effect of sounds withan inaudible frequency range, 11 subjects were presented with theFRS, HCS, and baseline conditions. In this experiment, a cutofffrequency of 26 kHz with a steeper cutoff attenuation of 170 dB/octave was employed to separate HFCs from LFCs. This relativelyhigh cutoff frequency was chosen because when a cutoff frequencylower than 26 kHz is used the skirts of the power spectrum of thefiltered HFCs extend below 20 kHz and generate sounds containingcomponents below 20 kHz. It is widely known that the upper limit ofthe audible range of humans varies considerably. It usually correspondsto around 15 or 16 kHz in young adults and sometimes below13 kHz in the elderly, and some people can recognize air vibrations of20 kHz as sound. When a cutoff frequency of 26 kHz is employedwith the steeper cutoff attenuation, the power spectrum of the filteredHFCs under 20 kHz falls below the system noise level. Therefore weselected a cutoff frequency of 26 kHz, which is sufficiently high tocompletely exclude contamination by audible sound components in allof the subjects. In accordance with conventional recordings of backgroundEEG activity, subjects were asked to keep their eyes naturallyclosed during the experiment to eliminate any effects of visual input.The presentation of the sounds in both FRS and HCS conditions lasted200 s, which included the entire piece of music. The baseline conditionalso lasted 200 s without sound presentation. The inter-sessionintervals were 10 s. Two recording sessions were repeated for eachcondition in the following order: baseline–FRS–HCS–FRS–HCS–baseline.EXPERIMENT 2. The validity of the digital audio format internationallyemployed for CDs was evaluated under more ordinary listeningconditions. Seventeen subjects were presented with sounds using acutoff frequency of 22 kHz, which corresponds to the upper range ofsounds recorded by a CD. Subjects were then asked to keep their eyesnaturally open as they usually do when they listen to music. Theopen-eye condition was also appropriate to control the subjects’vigilance. Each subject was presented with four types of conditions:FRS, HCS, and baseline, as in Experiment 1, plus LCS to elucidate theeffect of an HFC when it is presented alone. As in Experiment 1, eachcondition lasted 200 s. Before the actual recording sessions, HCS waspresented once to familiarize the subjects with the experimentalenvironment. To avoid any influence by the order of presentation, thefour different conditions were performed in random order across thesubjects. After a 10-min rest, the same four conditions were repeatedin reverse order. Neither the subjects nor the experimenters knewwhich conditions were being performed.The EEGs, recorded using the WEE-6112 telemetric system (Nihon-Koden,Tokyo, Japan) to minimize constraint on the subjects,were stored on magnetic tape for off-line analysis. The EEGs wererecorded continuously, including the intervals between the sessions.Data were recorded from 12 scalp sites (Fp1, Fp2, F7, Fz, F8, C3, C4,T5, Pz, T6, O1, and O2 according to the International 10-20 System)using linked earlobe electrodes as the reference with a filter setting of1–60 Hz (3 dB). The impedance of all electrodes was kept below5k. The EEGs obtained were subjected to power spectra analysis.The power spectrum of the EEG at each electrode was calculated byfast Fourier transform (FFT) analysis for every 2-s epoch, with anoverlap of 1 s, at a frequency resolution of 0.5 Hz with a samplingfrequency of 256 Hz. Then the averaged power spectrum within a 10-stime window was calculated. Each analysis window was designatedby the time at its middle point measured from the beginning of thesound presentation. For example, the time window labeled as 100-scontains data from 95 to 105 s from the beginning. Then the squareroot of the averaged power level in a frequency range of 8.0–13.0 HzDownloaded from jn.physiology.org on July 2, 2007
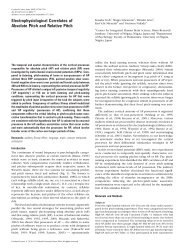
BIOLOGICAL EFFECT OF INAUDIBLE HIGH-FREQUENCY SOUNDS3551FIG. 2. Normalized potentials from the alpha frequency range of the spontaneous electroencephalogram (alpha-EEG) undereach experimental condition (FRS, HCS, and baseline) and time course in the successive FRS and HCS conditions in EEGExperiment 1. A: brain electrical activity maps (BEAMs) averaged across the 11 subjects over the entire time epoch of soundpresentation. Darker red indicates higher alpha-EEG potential. Note that the alpha-EEG is enhanced in the parieto-occipital regionexclusively in the FRS condition. B: mean and standard error of the occipital alpha-EEG for all 11 subjects. FRS significantlyenhanced the occipital alpha-EEG relative to HCS. C: time course of grand average BEAMs across all 11 subjects. Two sessionsfor each condition were averaged in this figure. The occipital alpha-EEG shows a gradual increase during the FRS presentation anda gradual decrease while HCS was successively presented.at each electrode position was calculated as the equivalent potential ofEEGs in an alpha band (alpha-EEG). To eliminate a possible effect ofinter-subject variability, the alpha-EEG at each electrode position wasnormalized with respect to the mean value across all time epochs,conditions, and electrode positions for each subject. To obtain anoverview of the data, to check for contamination by artifacts, and tocharacterize the spatial distribution of the alpha-EEG, we constructedcolored contour line maps using 2,565 scalp grid points with linearinterpolation and extrapolation. This type of map is called a brainelectrical activity map (BEAM) (Duffy et al. 1979). To avoid contaminationby artifacts arising from eye movement, we calculatedoccipital alpha-EEGs by averaging the alpha-EEGs at the electrodeson the posterior one-third of the scalp. The BEAMs and occipitalalpha-EEGs were averaged over multiple time epochs and subjectedto a statistical evaluation of condition effects. Since the time course ofthe alpha-EEG change revealed a considerable time lag with respect tothe sound presentation (see RESULTS and Fig. 2C), we made a statisticalevaluation of the data obtained from all time epochs as well as of thedata from only the latter half of the session (from the 100-s to 200-sclass marks). We used analysis of variance (ANOVA) followed byFishers’ protected least significant difference (PLSD) post hoc test toassess statistical significance for the different conditions.PET measurement and analysisThe sound presentation equipment was installed and calibrated inthe PET laboratory of Kyoto University Hospital. Subjects lay supine,with their eyes naturally open, on the PET scanner bed in a quiet,dimly lit room. Their heads were fixed in individually molded helmetshapedrests that were contoured to leave their ears undisturbed. Thedistance from the speakers to the subjects’ ears was approximately1.5 m. As in the EEG study, special attention was paid to theimmediate environment to minimize the subjects’ discomfort. Six ofthe subjects were studied using FRS, HCS, and baseline conditions,and the other six were studied using FRS, LCS, and baseline conditions.The order of the conditions was randomized across the subjectsand a total of six scans was performed on each subject with intervalsof 7 min. For each of the FRS, HCS, and LCS presentations, 30 mCiof 15 O-labeled water was injected into the right cubital vein 80 s afterthe beginning of each session. The same procedure was carried out forthe baseline condition after a minimum 1-min rest without any presentationother than the ambient background noise of the PET scannerroom. Following the injection, the head was scanned for radioactivitywith a multi-slice PET scanner (PCT3600W, Hitachi Medical Co.,Tokyo, Japan) for 120 s. The scanner acquired 15 slices with acenter-to-center distance of 7 mm and an axial resolution of 6.5 mmfull-width at half-maximum (FWHM) at the center (Endo et al. 1991).The in-plane spatial resolution with stationary mode acquisition usedin this protocol was 6.7 mm of FWHM, which was blurred to 10mm in the reconstructed PET images. The field of view and pixel sizewere 256 mm and 2 2 mm, respectively. Prior to the emissionmeasurements, transmission data were obtained using a 68 Ge/ 68 Gastandard plate source for attenuation correction. Reconstructed imageswere obtained by summing up the activity throughout the 120-speriod. No arterial blood sampling was performed; therefore theimages collected were of tissue activity. Tissue activity recorded bythis method is linearly related to rCBF (Fox et al. 1984; Fox andMintun 1989).The PET data were analyzed with statistical parametric mapping(SPM96 software, Wellcome Department of Cognitive Neurology,London, UK) implemented in MATLAB (Mathworks, Inc., Sherborn,MA). Statistical parametric maps are spatially extended statisticalprocesses that are used to characterize regionally specific effects inimaging data (Friston et al. 1991, 1994, 1995b; Worsley et al. 1992).The scans from each subject were realigned using the first image asthe reference (Friston et al. 1995a). After realignment, the imageswere transformed into a standard anatomical space (Friston et al.1995a; Talairach and Tournoux 1988). As a result, each scan wasresampled into voxels that were 2 2 4 mm each in the x(right-left), y (anterior-posterior), and z (superior-inferior) directions.Downloaded from jn.physiology.org on July 2, 2007
3552 OOHASHI ET AL.Each image was smoothed with an isotropic Gaussian kernel(FWHM 15 mm) to account for the variation in normal gyralanatomy and to increase signal-to-noise ratio. The effect of globaldifferences in rCBF between scans was removed by scaling theactivity in each pixel proportional to the global activity so as to adjustthe mean global activity of each scan to 50 ml/100g/min. To exploreregions showing significant differences in rCBF among differentconditions, the general linear model with contrasts was employed ateach voxel (Friston et al. 1995b). Since the different conditions wererun in different subjects, the contrasts of FRS versus HCS and HCSversus baseline were examined for six subjects, and those of FRSversus LCS and LCS versus baseline were examined for the other sixsubjects. The contrast of FRS versus baseline was examined for all 12subjects, inclusive. The resulting set of voxel values for each contrastconstituted a statistical parametric map of the t statistic. The t valueswere transformed into the unit normal distribution (Z score), whichwas independent of the degree of freedom of error, and were thresholdedat 3.09. To account for multiple non-independent comparisons,the significance of the activation in each brain region detected wasestimated by the use of distributional approximations from the theoryof Gaussian fields in terms of spatial extent and/or peak height(Friston et al. 1994). An estimated P value of 0.05 was used as a finalthreshold for significance. The resulting set of Z scores for thesignificant brain regions was mapped onto a standard spatial grid(Talairach and Tournoux 1988).In all of the subjects, EEGs were simultaneously recorded throughoutthe PET measurement, which lasted approximately 60 min, from12 electrodes as in the EEG experiment. The EEGs obtained duringthe total 200-s sound presentation were subjected to power spectraanalysis and, in particular, those during each 120-s PET scan wereused for correlation analysis with the rCBF. The data of one subjectwere excluded because of an excessive amount of electrical noise inthe EEG. We used ANOVA followed by Fisher’s PLSD post hoc testto assess the statistical significance of the different conditions. Inaddition, we used SPM software to calculate a correlation map betweenrCBF and the occipital alpha-EEG, to examine the relationshipbetween them. An estimated P value of 0.05 with correction formultiple comparisons was used as the final threshold for significance.Psychological evaluation of sound qualityWe also evaluated the subjective perception of sound quality. Sincethe subjective impression of sounds is closely related to the subjects’psychological condition, this evaluation was performed separatelyfrom the EEG and PET experiments. We used the same piece ofgamelan music as was used for the EEG and PET experiments. First,a pair of FRS and HCS, each lasting 200 s, was presented. The orderof the conditions was randomized across the subjects. After an intermissionof 3 min, another pair of FRS and HCS was presented inreverse order. Therefore the stimuli were presented in an A-B-B-Afashion, in which FRS and HCS were assigned to A and B or B andA, respectively, in a randomly counterbalanced way across the subjects.Neither the subjects nor the experimenter knew what the soundconditions were, although they did know that the presentation was inan A-B-B-A fashion. The subjects filled out a questionnaire to rate thesound quality in terms of 10 elements, each expressed in a pair ofcontrasting Japanese words (e.g., soft vs. hard). Each element of eachcondition was graded on a scale of 5 to 1. The scores were statisticallyevaluated by the paired comparison method described by Scheffé(1952). Note that the method used in the present study differs fromthat recommended by the CCIR (1978) and its modified version,which were widely used to determine the digital format of CDs around1980 (e.g., Muraoka et al. 1978; Plenge et al. 1979). In the previousstudies, sound materials were never longer than 20 s and the intervalbetween two successive sound materials was 2–3 s or less. Thereforeif neuronal response to sound stimuli is characterized by delay andpersistence for longer than 20 s, it is difficult to exclude the possibilitythat those studies might have introduced a subjective evaluation thatmight not precisely correspond to each sound condition.RESULTSEEG Experiment 1Figure 2, A and B, shows the grand average BEAMs andoccipital alpha-EEGs, respectively, for the 11 subjects, calculatedover the entire period of the sound presentation. Thealpha-EEGs were enhanced during FRS compared with thoseduring the other conditions. This enhancement was especiallypredominant in the occipital and parietal regions (Fig. 2A).ANOVA on the occipital alpha-EEG revealed a significantmain effect of condition [F(2,63) 3.74, P 0.05]. The posthoc tests showed that the occipital alpha-EEG during FRS wassignificantly greater than that during HCS (P 0.05) (Fig. 2B).There was a similar tendency when FRS was compared withthe baseline (P 0.10). Figure 2C shows the averaged timecourse of the BEAMs calculated for each 30 s of the FRS andHCS conditions for all subjects, inclusive. The alpha-EEGshowed a gradual increase during the first several tens ofseconds of FRS; there was a gradual decrease at the beginningof the following HCS. Taking into account the delay andpersistence of the enhancement of the alpha-EEG, statisticalevaluation was also made of the data from the latter half of therecording session (from the 100-s to 200-s class mark). In thisanalysis, compared with the data obtained by analyzing theentire period of the sound presentation, ANOVA followed bypost hoc tests revealed a more significant main effect of condition[F(2,63) 4.43, P 0.05] and a greater differencebetween FRS and HCS (P 0.01).EEG Experiment 2The grand average BEAMs and occipital alpha-EEGs acrossall 17 subjects over the latter half of the session (from the 100-sto 200-s class mark) are shown in Fig. 3. The amount of eyemovement did not differ for different conditions. The alpha-EEG showed significant enhancement in FRS compared withthe other conditions (Fig. 3A). This enhancement was predominantin the occipital and parietal regions. ANOVA on theoccipital alpha-EEG revealed a significant main effect of condition[F(3,131) 3.74, P 0.05]. The post hoc tests showedthat the occipital alpha-EEG in FRS was significantly greaterthan that in the other three conditions (Fig. 3B). There was nosignificant difference among HCS, LCS, and baseline (P 0.8for all comparisons). A similar but weaker tendency was recognizedwhen the data from the entire period of the soundpresentation were subjected to the analysis (main effect ofcondition, P 0.26; FRS vs. baseline, P 0.05). This isreasonable because the time course of the grand average occipitalalpha-EEG in this experiment showed, as in Experiment1, a gradual increase over the first several tens of seconds ofFRS (data not shown).PET experimentWhen the conditions with audible sounds (i.e., FRS or HCS)were compared with those without audible sounds (i.e., LCS orbaseline), the bilateral temporal cortex, presumably the primaryand secondary auditory cortex, always showed signifi-Downloaded from jn.physiology.org on July 2, 2007
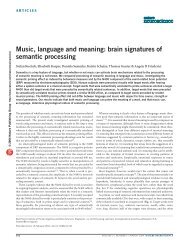
BIOLOGICAL EFFECT OF INAUDIBLE HIGH-FREQUENCY SOUNDS3553Conversely, when HCS was presented, these areas in factshowed a decreased rCBF compared with the baseline (Fig. 5,A and B). When LCS was compared with the baseline, nosignificant differential activation was observed anywhere in thebrain and neither the left thalamus nor the brain stem showedchanges in rCBF.FIG. 3. Normalized alpha-EEG potentials in each experimental condition(FRS, HCS, LCS, and baseline) during the latter half of the sound presentationin EEG Experiment 2. A: BEAMs averaged across all 17 subjects over the timeperiod from the 100- to 200-s class marks. B: mean and standard error of theoccipital alpha-EEG for all 17 subjects. FRS significantly enhanced the occipitalalpha-EEG relative to the other conditions.cantly increased rCBF as expected (Table 1; see also Fig. 5C).More importantly, when FRS was compared with HCS, deeplyingstructures in the brain were significantly more activatedduring the presentation of FRS than during that of HCS (Fig. 4and Table 1). The activated areas corresponded to the brainstem (Fig. 4B) and the lateral part of the left thalamus (Fig.4C). The same areas also showed an increased rCBF when FRSwas compared with either the baseline or LCS (Fig. 5, A andB). This tendency was also recognizable in the comparison ofFRS versus baseline with a lower threshold (Z 1.64 withcorrection for multiple comparisons) (Fig. 5C and Table 1).TABLE 1.EEG–rCBF correlationThe EEGs measured simultaneously with PET showed thatFRS significantly increased alpha-EEG activity compared withHCS (P 0.05) (Fig. 6A), which is in complete agreementwith the findings of the EEG experiments performed independentlyof the PET experiment. In contrast, when HCS wascompared with the baseline, alpha-EEG activity decreasedslightly in parallel with the changes we observed in the rCBF.The normalized EEG potentials showed a significant correlationwith the rCBF equivalent value in the lateral part of thethalamus (r 0.539, P 0.0001). The maximum correlationin the brain was observed at x 16, y 16, and z 0(Zscore 4.30) in the stereotaxic space, which corresponds tothe pixel immediately adjacent to the maximally significantpoint in the left thalamus as determined by the rCBF experiments(Fig. 6, B and C, and Table 1).Psychological evaluation of sound qualityTable 2 shows the subjective evaluation of sound qualityexamined by Scheffé’s paired comparison method (Scheffé1952). A significant difference was evident between FRS andHCS in some elements of sound quality. Subjects felt that FRSwas softer, more reverberant, with a better balance of instruments,more comfortable to the ears, and richer in nuance thanHCS.DISCUSSIONLocation and significance of activation in each area explored by SPM softwarePhysiological effects of inaudible high-frequency soundsDespite the fact that nonstationary HFCs were not perceivedas sounds by themselves, we demonstrated that the presentationof sounds that contained a considerable amount of non-Downloaded from jn.physiology.org on July 2, 2007AnalysisLocationTalairach Coordinate (mm)x y zMagnitude ofPeak Activation(Z score)Size ofActivation(voxel)Significance ofActivation(corrected P)Subtraction analysisFRS baseline GTT, GTs (lt) 44 16 8 6.42 790 0.001GTT, GTs (rt) 42 18 4 5.76 753 0.001(brain stem) (4) (26) (8) (3.39) — —[thalamus(lt)] (16) (18) (0) (3.32) — —FRS HCS brain stem 4 26 8 4.67 117 0.022thalamus(lt) 16 18 0 4.50 60 0.039HCS baseline GTT, GTs (lt) 54 20 0 4.88 462 0.001GTT, GTs (rt) 36 20 8 4.08 245 0.004FRS LCS GTT, GTs (lt) 46 20 8 3.99 179 0.026GTT, GTs (rt) 48 8 4 5.40 476 0.001LCS baselinen.s.Correlation analysisrCBF vs. alpha-EEG thalamus (lt) 16 16 0 4.30 149 0.027Z scores for the brain stem and thalamus in the comparison of FRS vs. baseline are reported in the parentheses to show a tendency of increased rCBF. x, y,and z, stereotactic coordinates in the three orthogonal dimensions of the atlas by Talairach and Tournoux (1988). GTT, transverse temporal gyrus; GTs, superiortemporal gyrus; lt, left; rt, right.
3554 OOHASHI ET AL.Downloaded from jn.physiology.org on July 2, 2007FIG. 4. Projected images of statistical parametric maps (SPMs) contrastingFRS with HCS with a standard threshold (Z 3.09 and P 0.05 with correctionfor multiple comparisons). A: projection images. Maps of Z scores for the regionswhere activity was significantly increased during FRS as compared with HCS areshown in a standard anatomical space (Talairach and Tournoux 1988) viewed fromthe back (coronal view), the right side (sagittal view), and the top (transverse view)of the brain. Maps are illustrated by a color scale, with the lower Z scorerepresented in darker red and the higher Z score in brighter yellow. B and C:activated foci in the brain stem (B) and left thalamus (C) are superimposed onto thespatially normalized magnetic resonance image (MRI) as shown in neurologicalconvention. Maps are illustrated by a color scale, with the lower Z score representedin darker red and the higher Z score in brighter yellow.FIG. 5. Averaged regional cerebral blood flow (rCBF) at the activated foci ina comparison of FRS and HCS across the 12 subjects under each condition (seeTable 1). A: brain stem; B: left thalamus. Each P value indicates the significancecalculated by Fisher’s protected least significant difference (PLSD) followinganalysis of variance (ANOVA) without correction for multiple pixel-based comparisons.Both the brain stem and the left thalamus showed an increase in rCBFduring the FRS presentation compared with all other conditions (baseline, LCS,and HCS). rCBF decreased during HCS compared with the baseline. On the otherhand, presentation of LCS did not lead to any change in rCBF compared with thebaseline values. C: projection images of SPM contrasting FRS with the baseline (inthe same format as in Fig. 4A) with a lower threshold (Z 1.64 and P 0.05 withcorrection for multiple comparisons).
BIOLOGICAL EFFECT OF INAUDIBLE HIGH-FREQUENCY SOUNDS3555stationary HFCs (i.e., FRS) significantly enhanced the powerof the spontaneous EEG activity of alpha range when comparedwith the same sound lacking HFCs (i.e., HCS). In parallelexperiments employing exactly the same stimulus andTABLE 2. Subjective evaluation of sound quality under FRS andHCS conditionsElement for Evaluation*SignificanceLevel (P)† q‡Soft vs. hard 0.01 5.33Reverberant type vs. percussive type 0.01 5.01Instruments in balance vs. instruments in imbalance 0.01 4.57Comfortable to ears vs. uncomfortable to ears 0.01 4.44Rich in nuance vs. lacking in nuance 0.05 3.63Lower tone dominant vs. higher tone dominant — 2.25Thick vs. thin — 1.70Light vs. heavy — 1.13Like vs. dislike — 1.12Finely textured vs. roughly textured — 0.14* Approximate English equivalents for pairs of Japanese words used forevaluation of sound quality. The subjects rated sound quality on a scale of 5(the former) to 1 (the latter). † P indicates the significance level by which FRSshowed a higher score (more favorable) than HCS for each element. ‡ qindicates each Student’s interval.methods, PET rCBF measurement revealed that FRS activatedthe deep-lying brain structures, including the brain stem andthalamus, compared with HCS. In addition, subjective evaluationby questionnaire revealed that FRS intensified the subjects’pleasure to a significantly greater extent than HCS did.We conclude, therefore, that inaudible high-frequency soundswith a nonstationary structure may cause non-negligible effectson the human brain when coexisting with audible low-frequencysounds. We term this phenomenon the “hypersoniceffect” and the sounds introducing this effect the “hypersonicsound.” We do not think that the hypersonic effect is specificto the sound material used in the present study because wepreviously confirmed, by EEG analysis, that the same effectcan be introduced by different sound sources containing asignificant amount of nonstationary HFCs (e.g., <strong>Oohashi</strong> et al.1994).In contrast to the fact that the primary auditory cortex in thebilateral temporal lobes was similarly activated by FRS andHCS, it is noteworthy that the brain stem and thlamic fociactivated by the presentation of FRS showed a decrease inrCBF when HCS was presented, as shown in Fig. 5. Thisfinding suggests that these areas may not belong to the conventionalauditory perception system. Moreover, it is the combinedpresentation of HFCs and LFCs, not HFCs alone, thatspecifically induces the enhancement of alpha-EEG and activationin the deep-lying structures. We interpret these findingsDownloaded from jn.physiology.org on July 2, 2007FIG. 6. Normalized alpha-EEG potentials under each experimental conditionand their correlation with adjusted rCBF equivalent values as measured bypositron emission tomography (PET) scanning. A: grand average normalizedalpha-EEG potentials with standard error for 11 subjects. The data of onesubject were excluded because of excessive electrical noise in the EEG.ANOVA followed by Fisher’s PLSD post hoc test showed a significant maineffect of condition (P 0.05) and a significant increase during the presentationof FRS compared with HCS (P 0.05). B: the brain areas in which the rCBFequivalent values were significantly correlated with the alpha-EEG potentialsare shown in a standard format (the same as in Fig. 4A). Maps are illustratedin a color scale, with the higher Z score represented in brighter green. C: thesame area as shown in B (green) and the activated area in the comparisons ofFRS and HCS as shown in Fig. 4 (yellow) are superimposed. The same area inthe left thalamus that was activated by FRS was most significantly correlatedwith the alpha-EEG potentials. The maximum correlation in the brain wasobserved at [x, y, z] [16, 16, 0] (Z score 4.30) in the stereotaxic space,which is the pixel immediately adjacent to the maximally significant localpoint observed in the rCBF experiment (FRS vs. HCS).
3556 OOHASHI ET AL.to mean that the hypersonic effect does not simply result froma neurophysiological response to isolated frequencies above anaudible range, but from a more complex interaction to whichHFCs and LFCs both contribute.The alpha rhythm of EEG is considered to occur in relaxedyet alert subjects and to be sensitive to the subjects’ emotionalas well as arousal state (Drennen and O’reilly 1986; Iwaki et al.1997). Although there is considerable inter-subject variabilityin the amount of alpha rhythm, normal alpha rhythm can betreated as an intra-individually stable trait in terms of itstest–retest reliability (Fernandez et al. 1993; Gasser et al. 1985;Kohrman et al. 1989). Although the mechanisms underlyinggeneration of the alpha rhythm have yet to be fully clarified, ananimal model suggests the involvement of at least the thalamocorticaland intracortical networks (Steriade et al. 1990). Ourfinding of a significant positive correlation between the rCBFin the thalamus and the occipital alpha-EEG suggests that theoccipital alpha-EEG may reflect an aspect of activity in deeplyingstructures, including the thalamus. This finding does notcontradict our earlier report (Sadato et al. 1998), which did notaddress the physiological effect of inaudible high-frequencysounds.Explanation of the discrepancy between the present andprevious studiesThe fact that we used an entire piece of natural musiclasting 200 s as sound stimuli instead of short fragments ofsounds might explain the discrepancy between our findingsand those of previous studies carried out around 1980 todetermine the format for digital audio CDs (e.g., Muraoka etal. 1978; Plenge et al. 1979), which concluded that thepresence of sounds containing a frequency range above 15kHz was not recognized as making a difference in soundquality. The CCIR (1978), and the current InternationalTelecommunication Union–Radio communication sector(ITU-R 1997), have recommended that sound samples usedfor the comparison of sound quality should not last longerthan 15–20 s (CCIR 1978; ITU-R 1997), and that intervalsbetween sound samples should be about 0.5–1 s (CCIR1978) because of short-term human memory limitations.Most of the previous psychological experiments, includingthe studies by Muraoka et al. (1978) and Plenge et al.(1979), were carried out using, essentially, the sound presentationmethod recommended by the CCIR. We also examinedthe psychological evaluation using the same materialand sound presentation system as was used for thepresent study, but followed the presentation method recommendedby the CCIR, and confirmed that the results were inagreement with the studies by Muraoka et al. (1978) andPlenge et al. (1979).In our EEG and PET experiments, we focused on physiologicalbrain responses and objectively evaluated the effect ofthe combination of audible sounds and inaudible HFCs onbrain activity, independent of a subjective evaluation of soundquality. According to the EEG measurements, the occipitalalpha-EEG gradually increased over several tens of secondsafter the exposure to FRS began, and this increase persisted forseveral tens of seconds after FRS ended. These findings suggestthat the phenomenon that we call the hypersonic effectmay involve some neuronal mechanisms that can be characterizedby delay and persistence for as long as several tens ofseconds. It seems, therefore, that an exposure to FRS shorterthan 20 s, as recommended by the CCIR and ITU-R, may beinsufficient to introduce a physiological effect. By the sametoken, a short exposure to HCS following FRS with a shortinterval of 0.5–1 s may not be enough to withdraw physiologicaleffects, if any, induced by the preceding FRS. Based onthis physiological consideration, we performed our psychologicalexperiment with sound materials of longer duration. Theresults showed a significant difference between FRS and HCSin some elements of sound quality. That difference was evidentdespite the fact that a long presentation time should make itmore difficult to detect subtle differences between two materialsdue to the limitation of short-term auditory memory. Ourfindings suggest the possibility that the results of the previouspsychological studies may not be valid in a situation wherehumans are continuously exposed to auditory stimuli such asmusic or environmental sounds.Hypothetical explanation of neuronal mechanisms of thehypersonic effectFrom an authentic view of human auditory physiology, itis not straightforward to explain the neuronal basis of thehypersonic effect characterized by the fact that HFCsshowed significant physiological and psychological effectson listeners only when presented with audible sounds. Althoughhow inaudible HFCs produce a physiological effecton brain activity is still unknown, we need to consider atleast two possible explanations. The first is that HFCs mightchange the response characteristics of the tympanic membranein the ears and produce more realistic acoustic perception,which might increase pleasantness. However, thishypothesis is unlikely to explain the fact that the subjectswho showed significant hypersonic effect were not necessarilyaware of the difference of sounds in a consciousmanner. An alternative explanation is that HFCs might beconveyed through pathways distinct from the usual airconductingauditory pathway and therefore might affect theCNS, including the deep-lying brain structure. It was reportedthat the vibratory stimulus of ultrasound modulatedby the human voice activated the primary auditory cortex(Hosoi et al. 1998) and was successfully recognized bypeople with normal hearing as well as those whose hearingis totally impaired (Lenhardt et al. 1991). Recently evidencehas accumulated that stimuli outside the frequency andamplitude boundaries of an auditory neuron’s receptive fieldcan influence responses to stimuli inside the classical receptivefield determined with pure tone stimuli (e.g., Schulzeand Langner 1999). This modulatory interaction betweeninside and outside the classical auditory receptive range isnoteworthy. However, we cannot conclude that the neuralmechanisms incorporating ultrasound hearing, including thebone-conducting auditory pathway, are the system responsiblefor the hypersonic effect, which involves the brainstem and thalamus. These regions showed decreased activitycompared with the baseline when HCS was presented andthus may not belong to the conventional auditory perceptionsystem. Therefore participation of nonauditory sensory systemssuch as somatosensory perception also needs to beconsidered in further investigations.Downloaded from jn.physiology.org on July 2, 2007
BIOLOGICAL EFFECT OF INAUDIBLE HIGH-FREQUENCY SOUNDS3557We pay special attention to the fact that FRS is accompaniedby an intensification of the pleasure with which the sound isperceived, and envisage the participation of the neuronal pathwaysin connection with reward-generating systems (Cooper1991; Olds and Milner 1954; Wise 1980), which effectivelycontrol various aspects of human behavior. The present PETresult does not seem to be contradictory to this view. The brainstem contains distinct neuronal groups that are the majorsource of monoaminergic projections to various parts of thebrain (Nieuwenhuys et al. 1988; Role and Kelly 1991). Thesemonoaminergic systems are thought to be the primary sites forthe action of many stimulants and antipsychotic drugs (Kandel1991). The rCBF in this area was reported to increase after oralamphetamine challenge (Devous et al. 1995). These fibers liein the medial forebrain bundle, which is considered to beintimately connected with registering pleasurable sensations(Thompson 1988). The monoaminergic neurons or the opioidpeptidergicneurons in the deep-lying brain structures are characterizedby long neurotransmitter residence times at synapticjunctions and the participation of an intracellular messenger inthe postsynaptic neurons (Hartzell 1981; Kehoe and Marty1980; Schwartz and Kandel 1991). These characteristics seemto support the delay and persistence of the hypersonic effectobserved in the present EEG experiments. The activation of thethalamus may reflect its function as part of the limbic system,which also plays an important role in the control of emotions(LeDoux 1993; Vogt and Gabriel 1993). It might also reflectthe role of the thalamus in gating sensory input to the cortex(Andreasen et al. 1994). We speculate that changes of activityin the deep-lying structure may introduce some modulatoryeffects on the perception of audible sounds and thus controlsome aspects of human behavior. We have incorporated thesefeatures in the two-dimensional sound perception model: soundfrequencies in the audible range function as a message carrierand frequencies above the audible range, together with those inthe audible range, function as a modulator of sound perceptionthrough the brain systems, including the reward-generatingsystem. Further investigations are clearly required to examinethis hypothetical model.In conclusion, our findings that showed an increase in alpha-EEG potentials, activation of deep-seated brain structures, acorrelation between alpha-EEG and rCBF in the thalamus, anda subjective preference toward FRS, give strong evidencesupporting the existence of a previously unrecognized responseto high-frequency sound beyond the audible range that mightbe distinct from more usual auditory phenomena. Additionalsupport for this hypothesis could come from future noninvasivemeasurements of the biochemical markers in the brain such asmonoamines or opioid peptides.We thank the staff of the Kyoto University PET Center for valuablecontributions to this work; Dr. Yoshio Yamasaki, Waseda University, for theuse of his recently developed signal processing system; the Yamashiro Instituteof Science and Culture for recording the sound sources; Dr. Norihiro Sadato,National Institute for Physiological Sciences, for valuable comments on anearly version of the manuscript; and Dr. Masako Morimoto, Japan Society forthe Promotion of Science, for valuable technical support.This work was supported in part by the Japan Ministry of Education, Scienceand Culture, through the Grants-in-Aid for Scientific Research (A) (09490031)to T. <strong>Oohashi</strong>, on Priority Areas to H. Shibasaki, and for International ScientificResearch Program (10041144) to T. <strong>Oohashi</strong>, and by the Japan Society forthe Promotion of Science through the Research for the Future Program JSPS-RFTF 97L00201 to H. Shibasaki.Address for reprint requests: T. <strong>Oohashi</strong>, Dept. of KANSEI Brain Science,ATR Human Information Processing Laboratories, 2-2 Hikaridai, Seika-cho,Soraku-gun, Kyoto 619-0288, Japan.Received 15 November 1999; accepted in final form 6 March 2000.REFERENCESANDREASEN NC, ARNDT S, SWAYZE V, CIZADLO T, FLAUM M, O’LEARY D,EHRHARDT JC, AND YUH WT. Thalamic abnormalities in schizophreniavisualized through magnetic resonance image averaging. Science 266: 294–298, 1994.CCIR. Subjective assessment of sound quality. CCIR Recommendation 562,1978.COOPER SJ. Interactions between endogenous opioids and dopamine: implicationsfor reward and aversion. In: The Mesolimbic Dopamine System. FromMotivation to Action, edited by Willner P and Scheel-Kruger J. New York:Wiley, 1991, p. 331–366.DANIELSSON A AND LANDSTROM U. Blood pressure changes in man duringinfrasonic exposure. An experimental study. Acta Med Scand 217: 531–535,1985.DEVOUS MD SR, TRIVEDI MH, GONG W, HARRIS TS, AND RUSH AJ. RCBFchanges in normal controls following oral amphetamine challenge. HumBrain Map Suppl 1: 267, 1995.DRENNEN WT AND O’REILLY BK. Alpha enhancement: a comparison study ofbiofeedback, open focus training, and control procedures. Percept Mot Skills62: 467–474, 1986.DUFFY FH, BURCHFIEL JL, AND LOMBROSO CT. Brain electrical activity mapping(BEAM): a method for extending the clinical utility of EEG and evokedpotential data. Ann Neurol 5: 309–321, 1979.DURRANT JD AND LOVRINC JH. Bases of Hearing Science. Hagerstown, MD:Lippincott Williams and Wilkins, 1977.ENDO M, FUKUDA H, SUHARA T, MATSUMOTO T, IINUMA T, AND YAMASAKI T.Design and performance of PCT-3600W (15-slice type): a whole-bodypositron emission tomograph. J Nucl Med Suppl 32: 1061, 1991.FERNANDEZ T, HARMONY T, RODRIGUEZ M, REYES A, MAROSI E, AND BERNALJ. Test-retest reliability of EEG spectral parameters during cognitive tasks.I. Absolute and relative power. Int J Neurosci 68: 255–261, 1993.FOX PT AND MINTUN MA. Noninvasive functional brain mapping by changedistributionanalysis of averaged PET images of H 2 15 O tissue activity.J Nucl Med 30: 141–149, 1989.FOX PT, MINTUN MA, RAICHLE ME, AND HERSCOVITCH P. A noninvasiveapproach to quantitative functional brain mapping with H 2 15 O and positronemission tomography. J Cereb Blood Flow Metab 4: 329–333, 1984.FRISTON KJ, ASHBURNER J, FRITH CD, POLINE JB, HEATHER JD, AND FRACK-OWIAK RSJ. Spatial registration and normalization of images. Hum BrainMap 2: 165–189, 1995a.FRISTON KJ, FRITH CD, LIDDLE PF, AND FRACKOWIAK RSJ. Comparing functional(PET) images: the assessment of significant change. J Cereb BloodFlow Metab 11: 690–699, 1991.FRISTON KJ, HOLMES AP, WORSLEY KJ, POLINE JB, FRITH CD, AND FRACK-OWIAK RSJ. Statistical parametric maps in functional imaging: a generallinear approach. Hum Brain Map 2: 189–210, 1995b.FRISTON KJ, WORSLEY KJ, FRACKOWIAK RSJ, MAZZIOTTA JC, AND EVANS AC.Assessing the significance of focal activations using their spatial extent.Hum Brain Map 1: 210–220, 1994.GASSER T, BACHER P, AND STEINBERG H. Test-retest reliability of spectralparameters of the EEG. Electroencephalogr Clin Neurophysiol 60: 312–319,1985.HARTZELL HC. Mechanisms of slow postsynaptic potentials. Nature 291:539–544, 1981.HOSOI H, IMAIZUMI S, SAKAGUCHI T, TONOIKE M, AND MURATA K. Activationof the auditory cortex by ultrasound. Lancet 351: 496–497, 1998.ITU-R. Methods for the subjective assessment of small impairments in audiosystems including multichannel sound systems. ITU-R Recommendation BS1116-1, 1997.IWAKI T, HAYASHI M, AND HORI T. Changes in alpha band EEG activity in thefrontal area after stimulation with music of different affective content.Percept Mot Skills 84: 515–526, 1997.JAPAN AUDIO SOCIETY. The proposal to the next generation audio system byAdvanced Audio Conference and Japan Audio Society (in Japanese). Reportof Advanced Audio Conference, Tokyo, 1999.KANDEL ER. Disorders of mood: depression, mania, and anxiety disorders. In:Principles of Neural Science, edited by Kandel ER, Schwartz JH, and JessellTM. Norwalk, CT: Appleton and Lange, 1991, p. 869–883.Downloaded from jn.physiology.org on July 2, 2007
3558 OOHASHI ET AL.KEHOE JS AND MARTY A. Certain slow synaptic responses: their properties andpossible underlying mechanisms. Annu Rev Biophys Bioeng 9: 437–465,1980.KOHRMAN MH, SUGIOKA C, HUTTENLOCHER PR, AND SPIRE JP. Inter- versusintra-subject variance in topographic mapping of the electroencephalogram.Clin Electroencephalogr 20: 248–253, 1989.LEDOUX JE. Emotional memory systems in the brain. Behav Brain Res 58:69–79, 1993.LENHARDT ML, SKELLETT R, WANG P, AND CLARKE AM. Human ultrasonicspeech perception. Science 253: 82–85, 1991.MURAOKA T, YAMADA Y, AND YAMAZAKI M. Sampling-frequency considerationsin digital audio. J Audio Engineer Soc 26: 252–256, 1978.NEVE, R. Letters: Rupert Neve of Amek replies. Studio Sound and BroadcastingEngineering 3: 21–22, 1992.NIEUWENHUYS R, VOOGD J, AND VAN HUIJZEN C. The Human Central NervousSystem—A Synopsis and Atlas. New York: Springer-Verlag, 1988.OLDS J AND MILNER P. Positive reinforcement produced by electrical stimulationof septal area and other regions of rat brain. J Comp Physiol Psychol47: 419–427, 1954.OOHASHI T, NISHINA E, AND FUWAMOTO Y. A study on the difference of thesound quality between LP sound and CD sound: physiological and KANSEIscientific approach (in Japanese). In: Technical Report of the Institute ofElectronics, Information and Communication Engineers, 1994, vol. HC94-18, p. 15–22.PLENGE GH, JAKUBOWSKI H, AND SCHONE P. Which bandwidth is necessary foroptimal sound transmission. Proceedings of 62nd Audio Engineering SocietyConvention, Brussels, 1979.ROLE LW AND KELLY JP. The brain stem: cranial nerve nuclei and themonoaminergic systems. In: Principles of Neural Science, edited by KandelER, Schwartz JH, and Jessell TM. Norwalk, CT: Appleton and Lange, 1991,p. 683–699.SADATO N, NAKAMURA S, OOHASHI T, NISHINA E, FUWAMOTO Y, WAKI A, ANDYONEKURA Y. Neural networks for generation and suppression of alpharhythm: a PET study. Neuroreport 9: 893–897, 1998.SCHEFFÉ H. An analysis of variance for paired comparisons. J Am Stat Assoc47: 381–400, 1952.SCHULZE H AND LANGNER G. Auditory cortical responses to amplitude modulationswith spectra above frequency receptive fields: evidence for widespectral integration. J Comp Physiol A 185: 493–508, 1999.SCHWARTZ JH AND KANDEL ER. Synaptic transmission mediated by secondmessengers. In: Principles of Neural Science, edited by Kandel ER,Schwartz JH, and Jessell TM. Norwalk, CT: Appleton and Lange, 1991, p.173–193.SNOW WB. Audible frequency ranges of music, speech and noise. J Acoust SocAm 3: 155–166, 1931.STERIADE M, GLOOR P, LLINAS RR, LOPES DE SILVA FH, AND MESULAM MM.Report of IFCN Committee on Basic Mechanisms. Basic mechanisms ofcerebral rhythmic activities. Electroencephalogr Clin Neurophysiol 76:481–508, 1990.TALAIRACH J AND TOURNOUX P. Co-Planar Stereotaxic Atlas of the HumanBrain. New York: Thieme, 1988.THEISS B AND HAWKSFORD MOJ. Phantom source perception in 24bit @ 96kHzdigital audio. Proceedings of 103rd Audio Engineering Society Convention,New York, 1997.THOMPSON JG. The Psychobiology of Emotions. New York: Plenum Press,1988, p. 24–42.VOGT BA AND GABRIEL M. Neurobiology of Cingulate Cortex and Limbic Thalamus.A Comprehensive Handbook. Boston, MA: Birkhauser, 1993, p. 71–122.WEGEL RL. The physical examination of hearing and binaural aids for the deaf.Proc Natl Acad Sci USA 8: 155–160, 1922.WISE RA. The dopamine synapse and the notion of ‘pleasure centers’ in thebrain. Trends Neurosci 2: 91–95, 1980.WORSLEY KJ, EVANS AC, MARRETT S, AND NEELIN P. A three-dimensionalstatistical analysis for CBF activation studies in human brain. J Cereb BloodFlow Metab 12: 900–918, 1992.YAMAMOTO T. Sound quality of 96kHz sampling digital audio. Proceedings of101st Audio Engineering Society Convention, Los Angeles, 1996.YAMASAKI Y. Signal processing for active control—AD/DA conversion andhigh speed processing. Proceedings of International Symposium on ActiveControl of Sound and Vibration, Tokyo, 1991.YOSHIKAWA S, NOGE S, OHSU M, TOYAMA S, YANAGAWA H, AND YAMAMOTOT. Sound quality evaluation of 96kHz sampling digital audio. Proceedingsof 99th Audio Engineering Society Convention, New York, 1995.YOSHIKAWA S, NOGE S, YAMAMOTO T, AND SAITO K. Does high samplingfrequency improve perceptual time-axis resolution of digital audio signal?Proceedings of 103rd Audio Engineering Society Convention, New York,1997.Downloaded from jn.physiology.org on July 2, 2007