The new climate theory of Dr. Ferenc Miskolczi
The new climate theory of Dr. Ferenc Miskolczi
The new climate theory of Dr. Ferenc Miskolczi

Create successful ePaper yourself
Turn your PDF publications into a flip-book with our unique Google optimized e-Paper software.
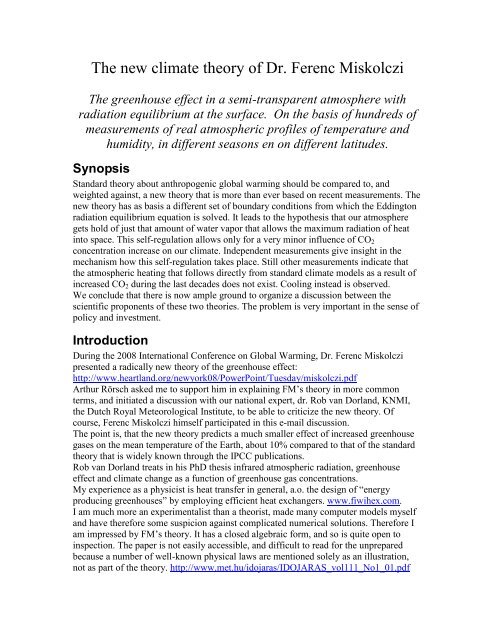
<strong>The</strong> <strong>new</strong> <strong>climate</strong> <strong>theory</strong> <strong>of</strong> <strong>Dr</strong>. <strong>Ferenc</strong> <strong>Miskolczi</strong><strong>The</strong> greenhouse effect in a semi-transparent atmosphere withradiation equilibrium at the surface. On the basis <strong>of</strong> hundreds <strong>of</strong>measurements <strong>of</strong> real atmospheric pr<strong>of</strong>iles <strong>of</strong> temperature andhumidity, in different seasons en on different latitudes.SynopsisStandard <strong>theory</strong> about anthropogenic global warming should be compared to, andweighted against, a <strong>new</strong> <strong>theory</strong> that is more than ever based on recent measurements. <strong>The</strong><strong>new</strong> <strong>theory</strong> has as basis a different set <strong>of</strong> boundary conditions from which the Eddingtonradiation equilibrium equation is solved. It leads to the hypothesis that our atmospheregets hold <strong>of</strong> just that amount <strong>of</strong> water vapor that allows the maximum radiation <strong>of</strong> heatinto space. This self-regulation allows only for a very minor influence <strong>of</strong> CO 2concentration increase on our <strong>climate</strong>. Independent measurements give insight in themechanism how this self-regulation takes place. Still other measurements indicate thatthe atmospheric heating that follows directly from standard <strong>climate</strong> models as a result <strong>of</strong>increased CO 2 during the last decades does not exist. Cooling instead is observed.We conclude that there is now ample ground to organize a discussion between thescientific proponents <strong>of</strong> these two theories. <strong>The</strong> problem is very important in the sense <strong>of</strong>policy and investment.IntroductionDuring the 2008 International Conference on Global Warming, <strong>Dr</strong>. <strong>Ferenc</strong> <strong>Miskolczi</strong>presented a radically <strong>new</strong> <strong>theory</strong> <strong>of</strong> the greenhouse effect:http://www.heartland.org/<strong>new</strong>york08/PowerPoint/Tuesday/miskolczi.pdfArthur Rörsch asked me to support him in explaining FM’s <strong>theory</strong> in more commonterms, and initiated a discussion with our national expert, dr. Rob van Dorland, KNMI,the Dutch Royal Meteorological Institute, to be able to criticize the <strong>new</strong> <strong>theory</strong>. Ofcourse, <strong>Ferenc</strong> <strong>Miskolczi</strong> himself participated in this e-mail discussion.<strong>The</strong> point is, that the <strong>new</strong> <strong>theory</strong> predicts a much smaller effect <strong>of</strong> increased greenhousegases on the mean temperature <strong>of</strong> the Earth, about 10% compared to that <strong>of</strong> the standard<strong>theory</strong> that is widely known through the IPCC publications.Rob van Dorland treats in his PhD thesis infrared atmospheric radiation, greenhouseeffect and <strong>climate</strong> change as a function <strong>of</strong> greenhouse gas concentrations.My experience as a physicist is heat transfer in general, a.o. the design <strong>of</strong> “energyproducing greenhouses” by employing efficient heat exchangers. www.fiwihex.com.I am much more an experimentalist than a theorist, made many computer models myselfand have therefore some suspicion against complicated numerical solutions. <strong>The</strong>refore Iam impressed by FM’s <strong>theory</strong>. It has a closed algebraic form, and so is quite open toinspection. <strong>The</strong> paper is not easily accessible, and difficult to read for the unpreparedbecause a number <strong>of</strong> well-known physical laws are mentioned solely as an illustration,not as part <strong>of</strong> the <strong>theory</strong>. http://www.met.hu/idojaras/IDOJARAS_vol111_No1_01.pdf
Greenhouse heat transferA market garden greenhouse is not warm because the glass cover is transparent forvisible light, but opaque for infrared radiation [IR]. <strong>The</strong> greenhouse is warm because aclosed ro<strong>of</strong> does not let out the warm and humid air. A greenhouse with a ro<strong>of</strong> that is IRtransparent is only a little bit lower in temperature.<strong>The</strong> standard <strong>theory</strong>, in contrast to this experience, teaches us that the earth surfaceradiates into space through the IR absorbing atmosphere, and therefore, if IR absorbinggases increase, the surface temperature increases. Cooling through radiation becomesmore difficult.FM’s <strong>theory</strong>, in agreement with this experience, teaches us instead that the heat transferfrom the surface is by non-radiation processes: vertical & horizontal convection, waterevaporation, cloud formation, rain and snow. And FM teaches us more: Our atmospherehas, in the global and time-averaged mean value, a constant optical thickness, so, whenmore CO 2 is injected, the atmosphere compensates this by increasing its water vaporcontent to regain the equilibrium.<strong>The</strong> atmosphere makes itself just that optimal optical thickness that allows for themaximum heat transfer to space, by adjusting its IR absorbance.MeasurementsThousands <strong>of</strong> atmosphere pr<strong>of</strong>iles are in the public domain, measurements by weatherballoons <strong>of</strong> temperature, pressure, and relative humidity. Because there is hydrostaticequilibrium, the pressure is a precise function <strong>of</strong> altitude; there is only a small and welldefinedtemperature correction term.<strong>The</strong> last 20 years there are satellites in orbit that have Fourier Transform InfraredSpectrometers with high resolution, and there are so-called line-by-line computerprograms that can translate atmospheric pr<strong>of</strong>iles to IR heat fluxes in W/m 2 , and that canconvert p, T, rH pr<strong>of</strong>iles into IR spectra and vice versa. FM is one <strong>of</strong> the few people thathave made such a program, HARTCODE.http://hps.elte.hu/zagoni/<strong>Miskolczi</strong>/hartcode_v01.pdf gives a detailed description <strong>of</strong> this5000-line Fortran program, based on thousands <strong>of</strong> laboratory-measured absorption lines.Later, FM went to NASA Langley Research Center, where he published an extensivetreatment <strong>of</strong> atmospheric heat fluxes, based on these thousands <strong>of</strong> atmosphericmeasurements: http://www.met.hu/idojaras/IDOJARAS_vol108_No4_01.pdf; where thebasic <strong>theory</strong> is already to be seen. In this 2004 paper, on p.242, he calculates an increase<strong>of</strong> global temperature <strong>of</strong> 0.482 °C as a result <strong>of</strong> doubling the CO 2 concentration.This is very different from what we learn from the standard <strong>theory</strong>. <strong>The</strong> methodologicaldifference is, that the <strong>new</strong> <strong>theory</strong> starts with measurements, in contrast with the standard<strong>theory</strong> that starts with schematic atmosphere models like the Keith-Trenberth scheme.<strong>The</strong> mathematical difference is, that the <strong>new</strong> <strong>theory</strong> treats the atmosphere as semitransparent,bounded, and in radiation equilibrium with the surface.On page 233 we find the basic standard mathematics; OLR means Outgoing Long waveRadiation. <strong>The</strong> OLR is the only way the Earth can get rid <strong>of</strong> its heat received from thesun, and therefore well known to be 250 W/m 2 as a global and seasonal mean. Opticalthickness is the natural logarithm <strong>of</strong> the IR absorption <strong>of</strong> the atmosphere, or the naturallogarithm <strong>of</strong> the ratio <strong>of</strong> ingoing and outgoing radiation flux.
<strong>The</strong>se are the equations <strong>of</strong> the standard <strong>theory</strong>. With OLR=250 W/m 2 and the globalaverage atmospheric optical thickness τ A = 1.86 we find the air temperature at the surface282 K, and for the ground temperature 304 K. Here the standard <strong>theory</strong> is not consistentwith what we all know: <strong>The</strong>re is no 22 °C difference between ground and air.A simple experimentIt is not difficult to measure the ground-air temperature differences, and get at least aqualitative impression <strong>of</strong> what goes on in a “real” greenhouse.We make 7 wells; 10 cm diameter and 4 cm deep, in apiece <strong>of</strong> EPS, fix a temperaturesensor on the center <strong>of</strong> each bottom, and cover some <strong>of</strong> the wells with windows that havea very different IR transparency. We lay a wet cloth on the bottom <strong>of</strong> half the wells.We make 7 temperature measurements every half-minute, log the results, and see whathappens night & day.
Color cover, mirror, wet or dry # <strong>of</strong> wellRed: 2 mm PMMA cover, dry bottom 1Blue: 2 mm PMMA cover, wet bottom 2Orange: 6 µ PE cover, dry bottom 3Light blue: 6 µ PE cover, wet bottom 4Green: No cover, dry bottom 5Brown: No cover, wet bottom 6Violet: Aluminum mirror above well, not closed 7
<strong>The</strong> experiment begins the 10 th <strong>of</strong> May 2008, on an open lawn at Fiwihex,Wierdensestraat 74 in Almelo. <strong>The</strong> sky is clear, it has been a sunny day, and thefollowing day is sunny too. Quite un-Dutch weather. <strong>The</strong> experiment ends the 11 th 13:00,because my daughter in law wanted to mow the grass by then.Now, what do we see: After equilibration from installation, 21:00 in the evening, thePMMA [Perspex, or poly methyl methacrylate] cover, red and dark blue points, beingblack in the IR wavelengths relevant, keeps the well relatively warm. It does not matter ifthe bottom is wet or dry, however, because the temperature is so low, and the humidity sohigh outside and inside, that the wet-bulb temperature is equal to the dry bulbtemperature.We see also that, notwithstanding the greenhouse effect <strong>of</strong> the PMMA cover, the opendry well is slightly warmer that the PMMA greenhouse, and much warmer that the PEgreenhouse. <strong>The</strong> warmest is the well with the mirror above it. How come?This is, because the air, being composed <strong>of</strong> mainly a-polar gases like O 2 and N 2 , andcannot radiate as strongly as a solid body, stays warm longer than any radiating solid orliquid. So, a sensor that is in open contact with the air stays warmer too.Now the coldest spot is the PE covered little greenhouse, wet or dry, because PE istransparent for IR radiation, so we have there a connection with the cold heavens, andinsulation from the warm air by the cover. <strong>The</strong> well with the Al mirror is the opposite:here we have contact with the air, but the upward radiation is reflected back by the shinymetal. <strong>The</strong> difference is large; the PE greenhouse is about 10 °C colder than the mirrorwell.Now the day comes, and we see a radically different pattern:All covered closed greenhouses are very hot. We see a slight difference between thehottest, PMMA, 61 °C in the early afternoon, and the PE covered, 57 °C. <strong>The</strong> only well,which is substantially less warm, is the open well with the wet bottom. This well is ableto cool itself by evaporation. We see also that a wet canopy, as every greenhouse
gardener knows, lowers the temperature quite a bit in a greenhouse, because it is nevercompletely closed, so the water vapor from the plants finds its way outside. In the bluecase, the water was almost completely evaporated by 13:00; dry spots begin at 12:00already.Conclusion: what makes the surface, or <strong>climate</strong>, warm is the hindered convective heattransfer to up in the atmosphere. Not the hindered radiation heat transfer, this is muchsmaller.1 A completely IR absorbing window, compared to a transparent one, increasesthe temperature only 5 °C, but as soon as water can be evaporated, we cool20°C. Both covers hinder evaporation, and that is, why greenhouses can bevery hot indeed. <strong>The</strong>y are always being regulated, the normal greenhouse byopening the ro<strong>of</strong> windows, the closed greenhouse by [fine wire] heatexchangers, cooling against ground water, condensing the evaporation fromthe plants, saving irrigation water and pest control chemicals and allowingCO 2 fertilization in the process.2 <strong>The</strong> wet surface temperatures are lower than the air temperatures. In the night,the difference is 10 °C, and during the day it is not the other way around. Thislooks not conform the standard <strong>theory</strong>, because there the upward radiation is65 W/m 2 larger than the downward radiation, which means a 12 °C higherground temperature than the effective atmospheric downward radiationtemperature. In <strong>Ferenc</strong> <strong>Miskolczi</strong>’s <strong>theory</strong>, there is radiation equilibriumbetween ground and atmosphere. So, no persistent higher ground temperature,even lower, as soon as liquid water is available for evaporation.So, there is no net radiation transport from the ground, other then the radiation throughthe infrared window. Can our atmosphere then regulate our temperature? Yes she can,because as soon as the temperature lapse rate becomes greater than the temperature lapserate by adiabatic expansion <strong>of</strong> dry air; 1°C per 100 m, or air in which humidity ischanging phase 0.29 °C per 100 m at 320 K, 0.42 °C per 100 m at 300 K, .74 °C per 100m at 250 K, the atmosphere becomes instable. Large amounts <strong>of</strong> heat escape to manykilometers high, where the radiation away into space is much easier: <strong>The</strong>re theatmosphere is thin and much more IR transparent. And, in most cases, the top <strong>of</strong> therising air column is a cloud, reflecting most <strong>of</strong> the incoming solar radiation.And we live in an atmosphere, where the temperature lapse rate due to IR radiationequilibrium, is always steeper than the adiabatic one. So, as soon as there is radiationequilibrium, the atmosphere tends to instability. <strong>The</strong> more IR active gases in the air, thesteeper the radiation lapse rate, and the sooner the real cooling comes into action. <strong>The</strong>warmer it is, the less steep the adiabatic lapse rate, and the sooner instability – andcooling – starts.We live on a planet with an abundance <strong>of</strong> liquid or solid water, be it in the oceans, in theplant canopy, or in ice. <strong>The</strong> only really dry place is the desert. <strong>The</strong>re, we have a <strong>climate</strong>that depends on radiation. Nobody lives there, for that matter.But how to quantify this water thermostat? And how to estimate the influence <strong>of</strong> a fewhundred ppm extra anthropogenic carbon dioxide?For the first time, <strong>Ferenc</strong> <strong>Miskolczi</strong> has solved this enigma in an analytic way, I think.
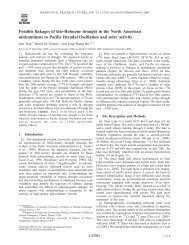
<strong>The</strong> Cabauw measurements<strong>The</strong> 200 m high radio broadcast transmitter in Cabauw, near Lopik, the Netherlands, canbe used, like a weather balloon, to measure atmosphere pr<strong>of</strong>iles, albeit only until 200 mhigh. Rob van Dorland has measured these pr<strong>of</strong>iles. <strong>The</strong> real ground temperature has notbeen measured; instead, one takes the air temperature T A at 2 m. <strong>The</strong> humidity has beenmeasured too. Out <strong>of</strong> these pr<strong>of</strong>iles, the LWD or Long wave Downward Radiation iscalculated using existing computer programs, similar to HARTCODE. This LWD is alsomeasured, using a pyrgeometer. Now we ask, is one <strong>of</strong> the basic assumptions made by the<strong>new</strong> <strong>theory</strong>, also true when we compare the LWD with the absorbed upwelling IRradiation. For this comparison we take the atmospheric transmittance as a function <strong>of</strong>water content expressed in precipitable centimeters, and the emissivity <strong>of</strong> the surface as0.96. <strong>The</strong> following correlation is the result:We see that, indeed, the radiation equilibrium extends to the surface. No net IR radiationheat flux reaches the atmosphere from the ground. It is either transmitted through theatmospheric window, or completely compensated by the LWD, or E U , in FM’s terms.<strong>The</strong> conclusion is, Rob’s Cabauw measurements support <strong>Ferenc</strong> <strong>Miskolczi</strong>’s majorassumption.Atmospheric pr<strong>of</strong>iles translated into IR spectra<strong>The</strong> following two figures are taken from FM, and are examples <strong>of</strong> typical IR spectradecomposed in the relevant heat fluxes. A very warm <strong>climate</strong>, and a very cold one. <strong>The</strong>x-axis is the wavelength expressed as the number <strong>of</strong> wavelengths per cm, as usual in IRspectroscopy. <strong>The</strong> list <strong>of</strong> decomposed heat fluxes is:
S U is the blackbody radiation from the surface upwards. Light blue line. A continuousspectrum because the ground is solid, or liquid sea surface.E D is the long wave downward radiation from the atmosphere to the ground.OLR is the sum <strong>of</strong> the heat fluxes S T and E U into spaceS T is the heat flux radiated through the IR window and through other partially transparentparts <strong>of</strong> the atmosphere, from the ground directly to spaceE U is the heat flux from the atmosphere itself into space.Around 650/cm lies the major absorption <strong>of</strong> CO 2 . E U is very much hindered there. <strong>The</strong>back radiation E D , is here large, almost as large as the upwelling radiation S U .Kiehl-Trenberth is the scheme most used in the standard <strong>theory</strong>. Such schemes do notcompare with measurements, because they are modified to be also 100% correct radiationbudgets. Local pr<strong>of</strong>iles do not have to be conforming an energy budget, because there isalso a large horizontal convective heat transfer. FM does not depart from schemes at all,he uses atmospheric pr<strong>of</strong>iles that are measured, and converted on a straightforwardmethod into radiation heat fluxes. We see that the standard K-T scheme has a largedeviation from the measured pr<strong>of</strong>iles that have a much higher flux in the IR window.
In the second figure we are in Antarctica. <strong>The</strong>re it is 232.2 K <strong>of</strong> -41.2 °C cold, we seethat the sharp molecular line at 650/cm <strong>of</strong> CO 2 in a <strong>climate</strong> that is cold enough to excludealmost all water vapor, extending even above the continuous spectrum <strong>of</strong> the snow. Wesee even the Ozone peak, around 1000/cm, in this dry <strong>climate</strong>.In both graphs we see the pr<strong>of</strong>iles where they are derived from. CO 2 is not indicatedbecause the concentration is the same everywhere. <strong>The</strong> adiabat is clearly visible, 110K/15km=7.3K/km in the first, and 70 K/10 km in the second graph. We see that even in thepolar <strong>climate</strong>, we have less than the dry adiabat.<strong>The</strong> standard <strong>theory</strong><strong>The</strong> standard <strong>theory</strong> does not work with relations that come out <strong>of</strong> the study <strong>of</strong> manymeasured pr<strong>of</strong>iles, but does work with an atmospheric scheme, such as the K-T scheme.From the PhD thesis <strong>of</strong> van Dorland we take the following figures that show the standardscheme. <strong>The</strong> overall heat flux balance is 343=83+20+40+200 W/m 2 .
Note the net 355-330=25 W/m 2 heat flow through the absorbing atmosphere from surfaceto space. <strong>The</strong> next figure shows how we come to the influence <strong>of</strong> IR active gases<strong>The</strong> x-axis is in Kelvin/day, so the system is only then stationary if the tendency is zero.We see that water [vapor] absorbs sunlight [S H2O] and so heats the atmosphere withhalf a degree per day, but we see also that in the IR region [L H2O] water has a coolingeffect. We see that in the stratosphere Ozon is a heater. This gas absorbs UV light fromthe Sun and therefore the stratosphere becomes so warm, that a stable inversion forms, on12000 meter, the tropopause.
We are interested in the <strong>climate</strong>, and that is on zero height. We see that CO 2 heats there,but cools on great height, which we saw in the spectra. It is striking, that the largewarming on 2-3 km height, which could be easily measured by satellites, is not there inreality. On the contrary, a cooling is measured as a result <strong>of</strong> increased CO 2 .We see also, that there is a net shortage <strong>of</strong> heat. That comes form the sun, shining on thesurface. This is much more than the necessary 1.5 °C/day, so there is a large term,vertical convection that balances the <strong>climate</strong>.
In this graph we see the heat fluxes upward and downward as a function <strong>of</strong> height. At1000 hectopascal we are on the surface. <strong>The</strong> scheme is a good illustration <strong>of</strong> theunphysically strong discontinuities assumed at the surface. <strong>The</strong>se are the reason for thelarge influence <strong>of</strong> extra greenhouse gases. In the <strong>new</strong> <strong>theory</strong> there is no suchdiscontinuity. This discontinuity arouses from boundary conditions used in solvingthe Eddington equation, taken from the conditions in the Sun. <strong>The</strong>re we have nosurface, there we have an infinite atmosphere, so the solution takes the form:ORL=2/[1+τ A ]·S A for the lowest atmospheric layer, and in the standard <strong>theory</strong>ORL=2/[2+τ A ]·S U for the liquid or solid surface. In the <strong>new</strong> <strong>theory</strong> S A = S U = S G andis ORL=2/[1+τ A +T A ]·S U . This the essential difference between the standard <strong>theory</strong>and that <strong>of</strong> <strong>Miskolczi</strong>.In the graph that follows, we see the influence on heat fluxes <strong>of</strong> a CO 2 doubling. We see a-4.5 W/m 2 decrease in the upward flux outside the window region, and only a +1.7increase in the downward flux. Here we have the standard “Anthropogenic GlobalWarming” <strong>theory</strong>. In the <strong>new</strong> <strong>theory</strong>, these two fluxes are equal to each other, and thatdoes not change at all, not with water content, or with extra CO 2 . <strong>The</strong> typical “forcing”due to CO 2 on 700 m height, is conspicuously absent in satellite measurements in the last25 years.
<strong>The</strong> <strong>new</strong> <strong>theory</strong><strong>The</strong> <strong>new</strong> <strong>theory</strong> does not start with schemes, but from atmosphere pr<strong>of</strong>iles. It seeksrelations between the heat fluxes per pr<strong>of</strong>ile. In the following graphs, every pointrepresents one pr<strong>of</strong>ile. <strong>The</strong> locations are as far apart as they can be. <strong>The</strong> coldest point isthe polar night; the warmest point is a hot day over the tropical pacific. From the study <strong>of</strong>the relations between the heat fluxes, surprising <strong>new</strong> insights come to light.
First, it appears that there is a strong correlation between the downward atmosphericradiation E D, the transparency <strong>of</strong> the atmosphere and the upwelling radiation S U . All threevary strongly with latitude, but E D = S U·[1-T A ] on all places. FM calls this “Kirchh<strong>of</strong>f’sLaw”, but it does not follow from the radiation equilibrium. It appears to be a specialproperty <strong>of</strong> our atmosphere. This is in great contrast to the standard <strong>theory</strong>, that assumesa fairly large, 25 W/m 2 , net flux from the surface through the absorbing atmosphere. <strong>The</strong>absorption grows with greenhouse gas increase, so this net flux is hindered, increasingthe surface temperature. If E D = S U·[1-T A ], there is no net upward IR heat flow otherthan that which passes unhindered through the IR window, which is much less dependenton increased greenhouse gas concentration.This relation is true for every height, not only on the surface. It is also true for Mars, withits tenuous atmosphere.From this relation it follows that the OLR is constituted from three parts: <strong>The</strong> radiationthrough the window, the absorption <strong>of</strong> visible sunlight into the atmosphere, and thevertical convective heat transfer when the adiabat is exceeded.
Second, it appears that the upwelling IR flux from the top <strong>of</strong> the atmosphere E U , that is,the OLR minus the window radiation, is roughly one half <strong>of</strong> the surface blackbodyradiation. FM calls this “Virial Law”, but it does not follow from this general kinetic /potential energy quotient. It appears to be also a special property <strong>of</strong> our atmosphere.This relation, S U /E U = 2, means that the optical depth <strong>of</strong> our atmosphere has, in the globaland time mean, the value 1.86. This measured value is precisely equal to the theoreticalvalue, found by solving the Eddington radiation differential equation with the boundarycondition on the surface <strong>of</strong> E D = S U·[1-T A ] and with a partial transparent atmosphere thatis bounded in height. All these are natural boundary conditions; none <strong>of</strong> them is appliedin the standard <strong>theory</strong>.We can calculate which influence an extra amount <strong>of</strong> greenhouse gas has on the opticalthickness. We start at the theoretical, and measured, value 1.86, and it follows thatremoval <strong>of</strong> all CO 2 brings us back to 1.73 or a perturbation <strong>of</strong> -7%, a 100-fold CO 2concentration causes a thickness <strong>of</strong> 2.29, a perturbation <strong>of</strong> +23%.
This we can do for Ozone or O 3 , and for water vapor. Each time for all otherconcentrations being equal. But, we have as a consequence <strong>of</strong> the <strong>new</strong> <strong>theory</strong>, that theatmosphere chooses its own optical thickness, where the maximum heat transfer to spacetakes place, i.e. 1.86. This has influence on the S U /E U = 2 equation, see the graph <strong>of</strong> thecalculated functions above. We see that water vapor cools, the other two gases heat, likewe saw in the graph <strong>of</strong> Rob van Dorland.When we increase the CO 2 to 3%, 100 times what we have now, the atmosphereincreases its water content about 5% to regulate back to an optical depth <strong>of</strong> 1.86. Waterhas a cooling effect, as shown in Van Dorland’s figure 2.4.In the geologic history <strong>of</strong> the Earth such a period, where the CO 2 concentration increaseda hundredfold; the Paleocene-Eocene <strong>The</strong>rmal Maximum, about 55 million years ago.<strong>The</strong> oceans were so acid then, that we find no calcium carbonate sediments, but reddishclay instead. <strong>The</strong> large amount <strong>of</strong> CO2 was caused by a temperature increase <strong>of</strong> about 6°C globally; the arctic polar sea was not saline and full <strong>of</strong> floating Azolla ferns, now to beseen in rice paddies. <strong>The</strong>ir fossil rests are to be found in the North Sea bottom.Measurement <strong>of</strong> absolute humidityhttp://www.cdc.noaa.gov/cgibin/Timeseries/timeseries.pl?ntype=1&var=Specific+Humidity+%28up+to+300mb+only%29&level=300&lat1=0&lat2=90&lon1=-
180&lon2=180&iseas=1&mon1=0&mon2=11&iarea=0&typeout=2&Submit=Create+Timeseriesgives a history <strong>of</strong> water content in the atmosphere up till 300 mB:We see a very distinct decrease <strong>of</strong> humidity in the last 50 years, about 25%, from 0.24gram/kg air to 19.5 gram/kg air. But this is strangely at odds with the assumption in thepreceding paragraph, however.NCEP Reanalysis data provided by the NOAA/OAR/ESRL PSD, Boulder,Colorado, USA, from their Web site at http://www.cdc.noaa.gov
Thirdly, from those measured atmospheric pr<strong>of</strong>iles there appears to be a relation <strong>of</strong> theOLR into space and the S U , the upward radiation from the surface. In the global mean,around S U 400, S U is 1.5·OLR, but on the poles at S U 200, 1.5·OLR=270 and in hot
tropical <strong>climate</strong>s, at S U 500, 1.5· OLR is 450. <strong>The</strong> title, “energy conservation rule”, is abit misleading, but the fact is that S U – OLR is measured to be equal to E D – E U , thedifference <strong>of</strong> the downward and the upward thermal radiation from the atmosphere, andboth are measured to be equal to one half <strong>of</strong> the OLR, see FM’s paper from 2004, figure24, here under.This graph has led to much discussion, as you could take the blue line as a function ratherthan an illustration <strong>of</strong> a relation. <strong>The</strong>n you could make an equation <strong>of</strong> the blue line, andrequire that the mathematically derived function ORL/S U = 2/{1+ τ A + exp [-τ A ]} must bethe same equation with τ A =1.86, and this leads to gross inconsistencies, <strong>of</strong> course. <strong>The</strong>recannot be more than one function between two variables in such a range, and τ A itself is afunction <strong>of</strong> the latitude, and therefore <strong>of</strong> S U .<strong>The</strong> <strong>new</strong> <strong>theory</strong><strong>Ferenc</strong> <strong>Miskolczi</strong> has sought, as soon as these strong dependencies became apparent tohim, for a <strong>theory</strong> that could explain those relations.This is the core <strong>of</strong> his <strong>new</strong> <strong>theory</strong>.It lies in the fact that he solves the Eddington differential equations, that describe theradiation equilibrium in a radiating and thus absorbing atmosphere [originally in the Sun,
1916] not with the classic boundary conditions <strong>of</strong> Milne [1922] but with two differentboundary conditions:1 <strong>The</strong> surface is in radiation equilibrium with the atmosphere right above it2 <strong>The</strong> atmosphere is bounded in height [about 60 km] and is partiallytransparent, the transparency is exp [-τ A ] = T A .Both boundary conditions follow directly form the spectral decomposition <strong>of</strong> the set <strong>of</strong>measured [TIGR] atmospheric temperature, pressure and humidity pr<strong>of</strong>iles.<strong>The</strong> resulting solution is ORL/S U = 2/{1+ τ A + exp [-τ A ]} or ORL/S U = 2/[1+ τ A + T A ].If we compare this solution to that <strong>of</strong> the standard <strong>theory</strong>: ORL / S UA = 2/[1+τ A ] for thelower atmosphere and ORL / S UG = 2/[2+τ A ] for the surface, we see that there is nodifference any more between surface and lowest atmosphere, and that the transparency isaccounted for. Both solutions tend to ORL/S U = 1 for the surface when there is noatmospheric absorbance and thus not greenhouse effect, when τ A =0 and T A =1, as nearlyso on Mars. Both tend to ORL/S U = 0 when τ A =∞ and therefore T A =0, as on the sun andnearly so on Venus.It can be shown that if ORL/S U = 2/[1+ τ A + T A ], that the maximum heat transfer fromsurface to space is reached for the Earth atmosphere. <strong>The</strong> theoretical atmospheric opticalthickness turns out to be 1.86, very close to the observed 1.87. T A = exp [-τ A ] has thevalue <strong>of</strong> 15% there, in the mid section <strong>of</strong> the graph, there ORL=1.5·S U while 2/[1+ τ A +T A ] there has the value 1.5. In that point global OLR is not dependent any more on theoptical density, it has its maximum in a cloudy atmosphere.For this situation <strong>Ferenc</strong> <strong>Miskolczi</strong> has calculated mean global temperature increase as aconsequence <strong>of</strong> the doubling <strong>of</strong> CO 2 concentration; see table 6 in the 2004 IDOJARAS
paper. <strong>The</strong> result is 0.48 °C, much too low to be measured in the noise <strong>of</strong> changing seacurrents, volcanic eruptions, changing galactic cosmic ray densities, etc.
<strong>The</strong> regulating mechanismNow the question is, how does the atmosphere regulate its optical thickness ortransparency so that the ORL is maximized over the long term? Recently we have quiteindependent measurements that elucidate this mechanism.In the following page we see satellite measurements by Roy Spencer et al. During IntraSeasonal Oscillations, that are periodic weather changes, over the tropical pacific, theytraced sea surface temperature, rain intensity, air temperature, water vapor concentration,Short Wave sun light reflection, and the Outgoing Long wave Radiation, all as a function<strong>of</strong> time, synchronized around the mid-point <strong>of</strong> maximum SST <strong>of</strong> an ISO.Every time the low air temperature increases, the SW light reflects more, the OLRincreases, rain increases, until, when the maximum temperature [=0] point is passed, thesunlight penetrates more, the OLR increases, the rain stops, just until the temperature isnormal again.What we see is a thermostat, the atmosphere increases and decreases it water content, sothat the <strong>climate</strong> is kept at a constant value. If the Earth cannot get rid <strong>of</strong> its heat throughradiation form low altitude alone, clear sky conditions, the adiabat is surpassed, and theheat transfer by latent heat high into the top <strong>of</strong> the atmosphere increases, so that the OLRfrom a higher altitude, where the effective IR optical depth is so much lower, can sendthe surplus heat into space.In the second set <strong>of</strong> graphs is, with another type <strong>of</strong> satellite, the amount <strong>of</strong> high, or ice,clouds, and the amount <strong>of</strong> low or water clouds, is put as a function <strong>of</strong> time, synchronizedon the same manner. It appears, that cooling low clouds become less, and warming highclouds become more, as the temperature rises, and vice versa.We see the cloud top temperature, which is a direct measure <strong>of</strong> the total OLR in thatplace, increase 2 K as a result <strong>of</strong> only 0.4 K higher surface temperatures. That means athreefold negative feedback due to atmospheric water content: σ·[258 4 -256 4 ]= 7.7W/m 2 K; a difference <strong>of</strong> 0.4 K at 305 K is σ·[305.4 4 -305.0 4 ]=2.6 W/m 2 K. Spencer et al.have measured the average feedback as -6.1 W/m 2 K, a full 100% negative feedback atground temperature level on average cloudiness.We see now the physical mechanism behind the observed OLR-S U relations, empiricallyfound and theoretically founded by <strong>Miskolczi</strong>, in operation. <strong>The</strong> OLR increases, and thesurface cools, with increasing water content as a result <strong>of</strong> surface temperature increase.<strong>The</strong> cooling rate, 0.03 °C per day, is conform the value 1 K/day in van Dorland’s figure2.4 in case water content varies only 3%.In great contrast, the standard <strong>theory</strong> assumes a positive feedback due to water content inthe atmosphere, increasing the global warming a factor 2 or 3 as a result <strong>of</strong> greenhousegas emission.
Now, in hindsight, this not so unexpected at all. <strong>The</strong> heat transfer coefficient <strong>of</strong> all nonradiationprocesses is not only way larger that that <strong>of</strong> radiation processes in the low
atmosphere; it is also very strongly dependent on the temperature. That is, because thewater vapor pressure is an exponential function <strong>of</strong> the sea surface temperature. This isalso the case for vegetation. <strong>The</strong> only exception are deserts, where there is no liquidwater to evaporate, and indeed, there the solid surface can become much hotter that theair above it. In the night, however, the desert surface and the air just above it is muchcolder. <strong>The</strong>re is documentation that the classic Egyptian technical men could make ice inthat way, screening the surface at day, and exposing it at night.Troposphere warming by CO 2 ; measurements comparedto standard <strong>theory</strong>In the four graphs hereunder, to be found viahttp://icecap.us/images/uploads/DOUGLASPAPER.pdf and more direct in thepresentation in http://www.warwickhughes.com/agri/Recent-Evidence-Reduced-Sensitivity-NYC-3-4-08.pptthe lower atmosphere temperature anomaly, observed by satellite is compared with a set<strong>of</strong> standard <strong>climate</strong> models. In the standard <strong>theory</strong>, a sizeable part <strong>of</strong> the heat transfer isby IR radiation through the absorbing atmosphere, which becomes thicker withincreasing CO 2 that radiates back, because it is warming the lower atmosphere. <strong>The</strong>measured period is from 1979 until 1999, a period with substantial <strong>climate</strong> change orwarming, and a substantial increase in greenhouse gases.1000 hPa is surface level, 100 hPa is tropopause pressure, about 17 km. <strong>The</strong> top 4 curvesare the results from four different <strong>climate</strong> models. <strong>The</strong>y all indicate a rising tropospheretemperature, 150 to 300 milliKelvin per 10 years, i.e. 0.3 to 0.6 °C <strong>climate</strong> warming overthose 20 years, the known value <strong>of</strong> IPCC reports as a consequence <strong>of</strong> greenhouse gasincrease.<strong>The</strong> measurements do not indicate heating, but generally the opposite. Only on the Northhemisphere there is a small warming, but much less than given by the standard <strong>theory</strong>.In contrast, the <strong>Miskolczi</strong> relations, drawn from many radio sonde pr<strong>of</strong>iles, conclude thatthere is no net radiation transport through the absorbing part <strong>of</strong> the IR spectrum <strong>of</strong> theatmosphere, only through the “window”, where the greenhouse gas concentration has anorder <strong>of</strong> magnitude less effect. <strong>The</strong>re is no tropopause warming, quite in agreement withthese measurements.<strong>The</strong> temperature effect <strong>of</strong> CO 2 doubling in this study is the same as in the <strong>Miskolczi</strong><strong>theory</strong>, about 0.5 °C.
Conclusions1 It is clear now, that radio sonde and satellite measurements do not support thestandard <strong>theory</strong> <strong>of</strong> “Anthropogenic Global Warming”. <strong>The</strong> <strong>new</strong> <strong>theory</strong> <strong>of</strong> <strong>Miskolczi</strong>,based on those atmospheric pr<strong>of</strong>iles under very different circumstances, does supportthose empirical results. His <strong>theory</strong> contains no parameters that are “fitted” to historic<strong>climate</strong> trends and greenhouse gas concentration trends. <strong>The</strong> only thing that is different,is that other, more experimentally founded, boundary conditions are taken in solving thedifferential equations describing radiation equilibrium:i. Infrared Radiation equilibrium between surface and atmosphereii. Partly infrared transparent atmosphere.<strong>The</strong> result indicates that the atmosphere chooses an optical thickness, by water vaportake-up or release, that ensures the maximum Outgoing Long wave Radiation globally fora cloudy atmosphere.2 Measurements <strong>of</strong> the oscillating weather patterns in the tropical Pacific showindeed that the <strong>climate</strong> controls itself, by changes in the water content <strong>of</strong> the air, and soby changing cloud cover and cloud height.3 Measurements <strong>of</strong> troposphere heating, predicted by the standard <strong>theory</strong> as aconsequence <strong>of</strong> the greenhouse gas increase, in de period 1979-1999 contradict thestandard <strong>theory</strong> by measuring a global cooling instead.RecommendationsEstablishing the right relation between greenhouse gas increase and <strong>climate</strong> change is soimportant, that we cannot allow ourselves to evade discussion about its physicalfoundation.<strong>The</strong> Netherlands, having a reputation <strong>of</strong> four centuries <strong>of</strong> criticizing established opinions,should organize this discussion on an appropriate scientific level.<strong>Dr</strong>. Ir. E. van Andel,Fiwihex, Wierdensestraat 74, Almelo, May 2008,