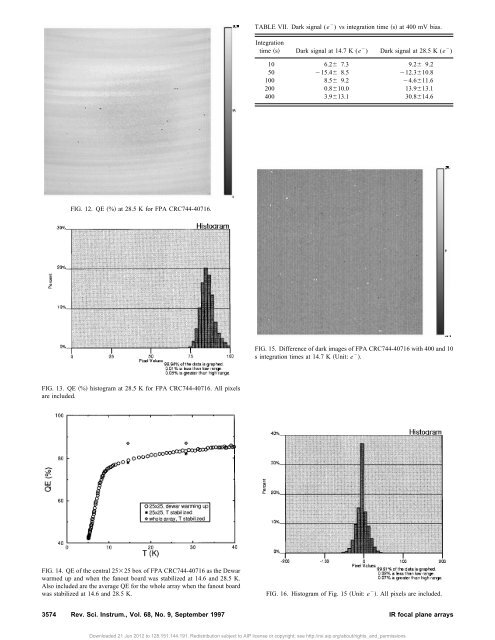
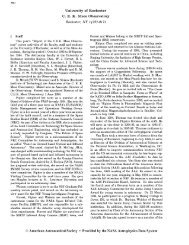
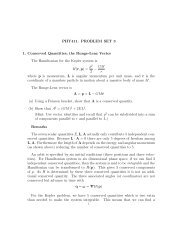
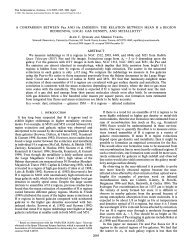
TABLE VII. Dark signal (e ) vs integration time s at 400 mV bias.Integrationtime s Dark signal at 14.7 K (e ) Dark signal at 28.5 K (e )10 6.2 7.3 9.2 9.250 15.4 8.5 12.310.8100 8.5 9.2 4.611.6200 0.810.0 13.913.1400 3.913.1 30.814.6FIG. 12. QE % at 28.5 K <strong>for</strong> FPA CRC744-40716.FIG. 15. Difference <strong>of</strong> dark images <strong>of</strong> FPA CRC744-40716 with 400 and 10s integration times at 14.7 K Unit: e .FIG. 13. QE % histogram at 28.5 K <strong>for</strong> FPA CRC744-40716. All pixelsare included.FIG. 14. QE <strong>of</strong> the central 2525 box <strong>of</strong> FPA CRC744-40716 as the Dewarwarmed up and when the fanout board was stabilized at 14.6 and 28.5 K.Also included are the average QE <strong>for</strong> the whole array when the fanout boardwas stabilized at 14.6 and 28.5 K.FIG. 16. Histogram <strong>of</strong> Fig. 15 Unit: e . All pixels are included.3574 Rev. Sci. Instrum., Vol. 68, No. 9, September 1997 IR <strong>focal</strong> <strong>plane</strong> <strong>arrays</strong>Downloaded 21 Jun 2012 to 128.151.144.191. Redistribution subject to AIP license or copyright; see http://rsi.aip.org/about/rights_and_permissions
FIG. 17. Difference <strong>of</strong> dark images <strong>of</strong> FPA CRC744-40716 with 400 and 10s integration times at 28.5 K Unit: e .uni<strong>for</strong>m throughout the whole array and there are only a fewhot pixels the pixels with large dark current. The actual hotpixels are fewer than the large current pixels which can beseen in Figs. 15–18. Some large current pixels in Figs.15–18 were caused by the remnant radiation from our Dewarwhich had been used in a proton radiation test five monthsago. The 28.5 K histogram indicates that a real dark charge<strong>of</strong> 20 e may be present; which would correspond to adark current <strong>of</strong> 0.05 e /s.E. NoiseThe read noise data were taken at 14.5 and 28.5 K withintegration times <strong>of</strong> 6 s <strong>for</strong> 1–32 pairs <strong>of</strong> Fowler samples, 12s <strong>for</strong> 64 pairs, and also 200 s <strong>for</strong> 1–32 pairs. Figure 19 showsthe noise versus number <strong>of</strong> Fowler pairs at 14.5 K. The noiseimproves with increasing numbers <strong>of</strong> Fowler pairs up to themaximum <strong>of</strong> 64 pairs. This was true at 14.5 K as well as 28.5K. Table VIII lists the noise obtained <strong>for</strong> 32 sample pairsFIG. 19. Read noise <strong>of</strong> FPA CRC744-40716 and CRC744-41626 vs number<strong>of</strong> Fowler sample pairs N at 14.5 K. The modeling result described in thetext is also plotted as the solid line. The 41626 FPA employs a 2 mLawrence mux.with6s<strong>of</strong>integration time, 64 sample pairs with 12 s <strong>of</strong>integration time, and 32 sample pairs with 200 s <strong>of</strong> integrationtime at 14.6 and 28.5 K. At 200 s <strong>of</strong> integration time, thenoise was about 50% larger than at 6 s. The 200 s per<strong>for</strong>manceis noticeably better at 14.6 K than at 28.5 K.Figure 20 shows read noise in 6 s integration time with1, 8, 32, and 64 Fowler sample pairs versus temperature. Thedata shown were obtained from a 2525 box at the center <strong>of</strong>the array. From 5 to 40 K, the noise with 8 and 32-samplepairs increases very gradually as the temperature rises. It canbe seen in Table VIII that the noise in the central 2525 box<strong>for</strong> 32 Fowler sampling pairs and 6s<strong>of</strong>integration timestabilized at temperatures <strong>of</strong> 14.6 and 28.5 K is about 1 e TABLE VIII. Noise (e ) at 14.5 K and 28.5 K, Fowler sampling. aN samp 32,integrationtime6s (x,y)(50,50) (x,y)(128,128) (x,y)(225,225)T14.6 K 7.26.4 b 6.96.2 b 7.36.7 b T28.5 K 7.5 7.7 8.4N samp 64,integrationtime12 sT14.6 K 6.75.3 b 5.85.2 b 6.65.6 b T28.5 K 6.9 7.3 7.9N samp 32,integrationtime200 sT14.6 K 9.2 9.4 10.3T28.5 K 12.7 14.2 14.3FIG. 18. Histogram <strong>of</strong> Fig. 17 Unit: e . All pixels are included.a Statistical uncertainty: 2%.b After fixing a small problem in our preamp board.Rev. Sci. Instrum., Vol. 68, No. 9, September 1997IR <strong>focal</strong> <strong>plane</strong> <strong>arrays</strong>3575Downloaded 21 Jun 2012 to 128.151.144.191. Redistribution subject to AIP license or copyright; see http://rsi.aip.org/about/rights_and_permissions