Physics of the Solar Active Regions from Radio Observations
Physics of the Solar Active Regions from Radio Observations
Physics of the Solar Active Regions from Radio Observations

You also want an ePaper? Increase the reach of your titles
YUMPU automatically turns print PDFs into web optimized ePapers that Google loves.
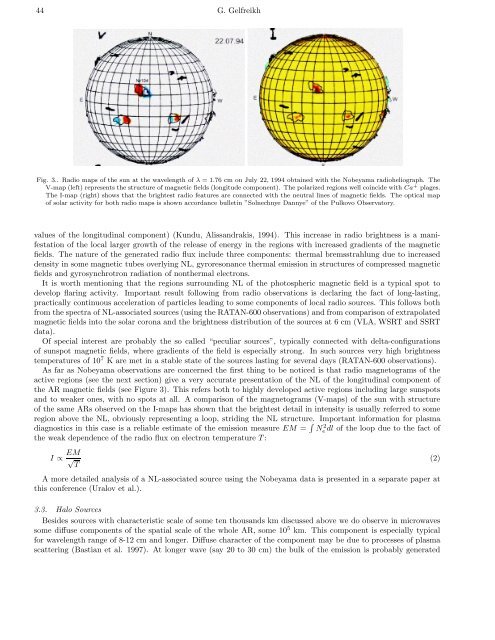
44 G. GelfreikhFig. 3.. <strong>Radio</strong> maps <strong>of</strong> <strong>the</strong> sun at <strong>the</strong> wavelength <strong>of</strong> λ =1.76 cm on July 22, 1994 obtained with <strong>the</strong> Nobeyama radioheliograph. TheV-map (left) represents <strong>the</strong> structure <strong>of</strong> magnetic fields (longitude component). The polarized regions well coincide with Ca + plages.The I-map (right) shows that <strong>the</strong> brightest radio features are connected with <strong>the</strong> neutral lines <strong>of</strong> magnetic fields. The optical map<strong>of</strong> solar activity for both radio maps is shown accordance bulletin ”Solnechnye Dannye” <strong>of</strong> <strong>the</strong> Pulkovo Observatory.values <strong>of</strong> <strong>the</strong> longitudinal component) (Kundu, Alissandrakis, 1994). This increase in radio brightness is a manifestation<strong>of</strong> <strong>the</strong> local larger growth <strong>of</strong> <strong>the</strong> release <strong>of</strong> energy in <strong>the</strong> regions with increased gradients <strong>of</strong> <strong>the</strong> magneticfields. The nature <strong>of</strong> <strong>the</strong> generated radio flux include three components: <strong>the</strong>rmal bremsstrahlung due to increaseddensity in some magnetic tubes overlying NL, gyroresonance <strong>the</strong>rmal emission in structures <strong>of</strong> compressed magneticfields and gyrosynchrotron radiation <strong>of</strong> non<strong>the</strong>rmal electrons.It is worth mentioning that <strong>the</strong> regions surrounding NL <strong>of</strong> <strong>the</strong> photospheric magnetic field is a typical spot todevelop flaring activity. Important result following <strong>from</strong> radio observations is declaring <strong>the</strong> fact <strong>of</strong> long-lasting,practically continuous acceleration <strong>of</strong> particles leading to some components <strong>of</strong> local radio sources. This follows both<strong>from</strong> <strong>the</strong> spectra <strong>of</strong> NL-associated sources (using <strong>the</strong> RATAN-600 observations) and <strong>from</strong> comparison <strong>of</strong> extrapolatedmagnetic fields into <strong>the</strong> solar corona and <strong>the</strong> brightness distribution <strong>of</strong> <strong>the</strong> sources at 6 cm (VLA, WSRT and SSRTdata).Of special interest are probably <strong>the</strong> so called “peculiar sources”, typically connected with delta-configurations<strong>of</strong> sunspot magnetic fields, where gradients <strong>of</strong> <strong>the</strong> field is especially strong. In such sources very high brightnesstemperatures <strong>of</strong> 10 7 K are met in a stable state <strong>of</strong> <strong>the</strong> sources lasting for several days (RATAN-600 observations).As far as Nobeyama observations are concerned <strong>the</strong> first thing to be noticed is that radio magnetograms <strong>of</strong> <strong>the</strong>active regions (see <strong>the</strong> next section) give a very accurate presentation <strong>of</strong> <strong>the</strong> NL <strong>of</strong> <strong>the</strong> longitudinal component <strong>of</strong><strong>the</strong> ARmagnetic fields (see Figure 3). This refers both to highly developed active regions including large sunspotsand to weaker ones, with no spots at all. A comparison <strong>of</strong> <strong>the</strong> magnetograms (V-maps) <strong>of</strong> <strong>the</strong> sun with structure<strong>of</strong> <strong>the</strong> same ARs observed on <strong>the</strong> I-maps has shown that <strong>the</strong> brightest detail in intensity is usually referred to someregion above <strong>the</strong> NL, obviously representing a loop, striding <strong>the</strong> NL structure. Important information for plasmadiagnostics in this case is a reliable estimate <strong>of</strong> <strong>the</strong> emission measure EM = ∫ Ne 2 dl <strong>of</strong> <strong>the</strong> loop due to <strong>the</strong> fact <strong>of</strong><strong>the</strong> weak dependence <strong>of</strong> <strong>the</strong> radio flux on electron temperature T :I ∝ EM √ (2)TA more detailed analysis <strong>of</strong> a NL-associated source using <strong>the</strong> Nobeyama data is presented in a separate paper atthis conference (Uralov et al.).3.3. Halo SourcesBesides sources with characteristic scale <strong>of</strong> some ten thousands km discussed above we do observe in microwavessome diffuse components <strong>of</strong> <strong>the</strong> spatial scale <strong>of</strong> <strong>the</strong> whole AR, some 10 5 km. This component is especially typicalfor wavelength range <strong>of</strong> 8-12 cm and longer. Diffuse character <strong>of</strong> <strong>the</strong> component may be due to processes <strong>of</strong> plasmascattering (Bastian et al. 1997). At longer wave (say 20 to 30 cm) <strong>the</strong> bulk <strong>of</strong> <strong>the</strong> emission is probably generated