Physics of the Solar Active Regions from Radio Observations
Physics of the Solar Active Regions from Radio Observations
Physics of the Solar Active Regions from Radio Observations

You also want an ePaper? Increase the reach of your titles
YUMPU automatically turns print PDFs into web optimized ePapers that Google loves.
<strong>Solar</strong> <strong>Physics</strong> with <strong>Radio</strong> <strong>Observations</strong>, Proceedings <strong>of</strong> Nobeyama Symposium 1998, NRO Report 479<strong>Physics</strong> <strong>of</strong> <strong>the</strong> <strong>Solar</strong> <strong>Active</strong> <strong>Regions</strong> <strong>from</strong> <strong>Radio</strong> <strong>Observations</strong>G.B. GelfreikhMain (Pulkovo) Astronomical Observatory <strong>of</strong> RAS, St.-Petersburg 196140, RussiaE-mail(FI): gbg@GG1623.spb.eduAbstractLocalized increase <strong>of</strong> <strong>the</strong> magnetic field observed by routine methods on <strong>the</strong> photosphere result in <strong>the</strong>growth <strong>of</strong> a number <strong>of</strong> active processes in <strong>the</strong> solar atmosphere and <strong>the</strong> heliosphere. These localized regions<strong>of</strong> increased magnetic field are called active regions (AR). The main processes <strong>of</strong> transfer, accumulationand release <strong>of</strong> energy in an ARis, however, out <strong>of</strong> scope <strong>of</strong> photospheric observations being essentially a3D-process and happening ei<strong>the</strong>r under photosphere or up in <strong>the</strong> corona. So, to investigate <strong>the</strong>se plasmastructures and processes we are bound to use ei<strong>the</strong>r extrapolation <strong>of</strong> optical observational methods orobservations in EUV, X-rays and radio. In this review, we stress and illustrate <strong>the</strong> input to <strong>the</strong> problemgained <strong>from</strong> radio astronomical methods and discuss possible future development <strong>of</strong> <strong>the</strong>ir applicatications.Historically speaking each new step in developing radio technique <strong>of</strong> observations resulted in detectingsome new physics <strong>of</strong> ARs. The most significant progress in <strong>the</strong> last few years in radio diagnostics <strong>of</strong> <strong>the</strong>plasma structures <strong>of</strong> magnetospheres <strong>of</strong> <strong>the</strong> solar ARs is connected with <strong>the</strong> developing <strong>of</strong> <strong>the</strong> 2D fulldisk analysis on regular basis made at Nobeyama and detailed multichannel spectral-polarization (but onedimensionaland one per day) solar observations at <strong>the</strong> RATAN-600. In this report <strong>the</strong> bulk <strong>of</strong> attentionis paid to <strong>the</strong> new approach to <strong>the</strong> study <strong>of</strong> solar activity gained with <strong>the</strong> Nobeyama radioheliograph andanalyzing <strong>the</strong> ways for future progress.The most important new features <strong>of</strong> <strong>the</strong> multicomponent radio sources <strong>of</strong> <strong>the</strong> ARs studied usingNobeyama radioheliograph are as follow:1. The analysis <strong>of</strong> magnetic field structures in solar corona above sunspot with 2000 G. Their temporalevolution and fluctuations with <strong>the</strong> periods around 3 and 5 minutes, due to MHD-waves in sunspot magnetictubes and surrounding plasma. These investigations are certainly based on an analysis <strong>of</strong> <strong>the</strong>rmal cyclotronemission <strong>of</strong> lower corona and CCTRabove sunspot umbra.2. Magnetography <strong>of</strong> <strong>the</strong> solar active regions presenting <strong>the</strong> weak magnetic fields (with <strong>the</strong> sensitivity<strong>of</strong> several G) reflecting longitude component <strong>of</strong> <strong>the</strong> magnetic field in chromosphere and corona and solarfaculae structure. The method is based on an analysis <strong>of</strong> <strong>the</strong> weak polarization (<strong>of</strong> <strong>the</strong> order <strong>of</strong> 1% or less).3. An analysis <strong>of</strong> <strong>the</strong> structure, temperature, and density <strong>of</strong> arches seen above neutral magnetic fieldlines (seen in most ARs with spots and without ones).4. Study <strong>of</strong> temporal and spatial behavior <strong>of</strong> inversion <strong>of</strong> <strong>the</strong> sign <strong>of</strong> <strong>the</strong> circular polarization with <strong>the</strong>result <strong>of</strong> magnetography <strong>of</strong> <strong>the</strong> solar corona.5. An analysis <strong>of</strong> <strong>the</strong> solar activity at high heliographic latitudes, observed mostly as polar faculae(increased brightness structures having counterparts in optical white light observations). In modern study<strong>of</strong> <strong>the</strong> solar activity analysis <strong>of</strong> <strong>the</strong> activity <strong>of</strong> polar zones are <strong>of</strong> principal importance. Nobeyama probablypresents <strong>the</strong> most reliable way to study this.The above points present not exactly completed results but ra<strong>the</strong>r <strong>the</strong> directions for future studies.These should use full time coverage <strong>of</strong> observations at different phases <strong>of</strong> <strong>the</strong> solar activity and combination<strong>of</strong> observations with o<strong>the</strong>r radio, optical, EUV and X-ray observations whenever possible.Key words: Sun: active regions: radio magnetography; plasma diagnostics; radio observations1. IntroductionMost manifestations <strong>of</strong> <strong>the</strong> solar activity originate in <strong>the</strong> localized islands <strong>of</strong> increased magnetic fields in <strong>the</strong> solaratmosphere called traditionally solar active regions. These are essentially three-dimensional plasma structures in<strong>the</strong> solar atmosphere and we may call <strong>the</strong>m magnetospheres <strong>of</strong> <strong>the</strong> solar ARs (MAR). This term implies a structureclearly isolated <strong>from</strong> surrounding plasma, physical process inside a MARbeing controlled both by local magnetic
42 G. Gelfreikhfields (isolated currents) and by emission and matter fluxes <strong>from</strong> surrounding media. It was just radio observationswhich made it possible to propose <strong>the</strong> term MARbecause radio diagnostics <strong>of</strong> plasma parameters <strong>of</strong> <strong>the</strong> solar coronaand upper chromosphere (such as magnetic field strength, acceleration <strong>of</strong> particles) became regularly possible usingradio observations.In an analysis <strong>of</strong> <strong>the</strong> structure and physical processes in MAR<strong>the</strong>re are three main directions presenting mostsignificant results. They are- diagnostics <strong>of</strong> <strong>the</strong> magnetic fields;- diagnostics <strong>of</strong> <strong>the</strong>rmal structures (distribution <strong>of</strong> temperature and density);- diagnostics <strong>of</strong> long-lasting non-flaring acceleration <strong>of</strong> non<strong>the</strong>rmal particles.Modern solar physics consider <strong>the</strong> solar activity as essentially global process covering all heliographic latitudes. Inradio we also have exclusive means to analyze not only classical active regions at low and middle latitudes but also inpolar regions known in optical physics as polar faculae. <strong>Observations</strong> <strong>of</strong> dark filaments on <strong>the</strong> disk and prominencesover <strong>the</strong> limb open a method to follow development <strong>of</strong> global magnetic field structure.2. Global solar activityIn <strong>the</strong> previous session we discussed some <strong>of</strong> <strong>the</strong> problems <strong>of</strong> global changes <strong>of</strong> <strong>the</strong> magnetic field structure andits presentation in radio observations. However, today we need to study manifestation <strong>of</strong> <strong>the</strong> solar activity on <strong>the</strong>surface <strong>of</strong> <strong>the</strong> whole solar sphere. The latest results in helioseismology gained <strong>from</strong> SOHO have shown that we havesolid body rotation <strong>of</strong> <strong>the</strong> sun at latitudes about 50 ◦ while gradient <strong>of</strong> angular rotation <strong>of</strong> <strong>the</strong> sun with depth dω/drhas different sign at high and low solar latitudes. That implies a search for some new ideas in <strong>the</strong> <strong>the</strong>ory <strong>of</strong> <strong>the</strong> solarcycle. One can see <strong>from</strong> magnetograms that it looks as if <strong>the</strong>re are sub-photosheric circles <strong>of</strong> magnetic field lines atlower latitudes and circles <strong>of</strong> current at higher ones. So, we can expect different structures <strong>of</strong> active regions in <strong>the</strong>sezones <strong>of</strong> solar activity.The most obvious structures <strong>of</strong> polar activity <strong>of</strong> <strong>the</strong> sun are polar faculae. Now we know that fine elements <strong>of</strong><strong>the</strong>se may include magnetic fields exceeding 1500 G (Makarov et al., 1997) — value comparable with <strong>the</strong> magneticfields <strong>of</strong> classical ARs.It is worth mentioning some o<strong>the</strong>r important features <strong>of</strong> polar faculae as manifestation <strong>of</strong> polar activity <strong>of</strong> <strong>the</strong>sun. These are- Strong magnetic fields amounting 1500 G in fine structural elements.- Maximum number <strong>of</strong> <strong>the</strong> polar faculae near <strong>the</strong> minimum <strong>of</strong> <strong>the</strong> low-latitude solar activity.- Repetition <strong>of</strong> <strong>the</strong> fluctuations <strong>of</strong> <strong>the</strong> level <strong>of</strong> <strong>the</strong> polar activity in classical ARs with a delay <strong>of</strong> about six years.- Fast variability <strong>of</strong> <strong>the</strong> fine structure <strong>of</strong> <strong>the</strong> polar faculae on <strong>the</strong> time scale <strong>of</strong> one minute observed with very highspatial resolution <strong>of</strong> 0.2 arcsec (Makarov, private communication).<strong>Observations</strong> <strong>of</strong> <strong>the</strong> polar faculae in white light, however, have important limitations due to <strong>the</strong>ir low contrast(below 10%) and small-scale (arcsec) features. Nobeyama radioheliograph presents a new powerful tool to study thistype <strong>of</strong> solar activity. Figure 1 presents an example <strong>of</strong> <strong>the</strong> I-map at wavelength <strong>of</strong> λ =1.76 cm with distinguishedpicture <strong>of</strong> polar faculae, both near <strong>the</strong> North and South poles. The observed time variations <strong>of</strong> <strong>the</strong> radio polarfaculae are shown in Figure 2, where <strong>the</strong> structure <strong>of</strong> <strong>the</strong> radio sources is presented with time interval <strong>of</strong> 10 sec.The maximum brightness excess <strong>of</strong> separate structural elements were found in <strong>the</strong> limits <strong>of</strong> 10 to 40%. Thatimplies <strong>the</strong> brightness temperature in <strong>the</strong> limits <strong>of</strong> 11 to 14 10 3 K. The size <strong>of</strong> a separate elements is few tens <strong>of</strong>arcsec. If we are going to use this kind <strong>of</strong> observations as an index <strong>of</strong> solar activity it is essential to find out whe<strong>the</strong>rwe deal with a new index or just find more reliable way to measure level <strong>of</strong> <strong>the</strong> same solar activity in polar zones. Tothis end we tried for a chosen date to compare positions <strong>of</strong> optically observed polar faculae with <strong>the</strong>se found <strong>from</strong>Nobeyama radio maps. The coincidence was real but not very high (about 50% <strong>of</strong> optically observed features couldbe identified with <strong>the</strong> radio bright sources). Then we compared not separate optical features but <strong>the</strong> groups <strong>of</strong> polarfaculae. Using this method we have come to practically total identification <strong>of</strong> <strong>the</strong> radio bright features with groups<strong>of</strong> faculae observed at Kislovodsk mountain station in white light. Earlier a similar comparison was made using<strong>the</strong> RATAN-600 observations. One-dimensional resolution limited <strong>the</strong> reliability <strong>of</strong> identification. Never<strong>the</strong>less <strong>the</strong>correlation coefficient in brightness distribution was in <strong>the</strong> range 0.5 - 0.9. These results lead us to <strong>the</strong> conclusionthat both optical and radio methods deal with <strong>the</strong> same index <strong>of</strong> <strong>the</strong> solar activity.
<strong>Physics</strong> <strong>of</strong> <strong>the</strong> <strong>Solar</strong> <strong>Active</strong> <strong>Regions</strong> <strong>from</strong> <strong>Radio</strong> <strong>Observations</strong> 43Fig. 1.. <strong>Radio</strong> map <strong>of</strong> <strong>the</strong> sun at <strong>the</strong> wavelength λ =1.76 cmon June 30, 1993 obtained with Nobeyama radioheliograph.Interval <strong>of</strong> brightness temperatures <strong>the</strong> ∆T b =(7− 12) · 10 3 K.Fig. 2.. <strong>Radio</strong> maps <strong>of</strong> <strong>the</strong> polar region <strong>of</strong> <strong>the</strong> sun at <strong>the</strong> wavelength<strong>of</strong> λ =1.76 cm on June 29, 1993 obtained with <strong>the</strong>Nobeyama radioheliograph. Time interval between successivepictures is 10 seconds.3. Basic Components <strong>of</strong> <strong>Radio</strong> Emission <strong>of</strong> an ARA “classical” active region is observed at microwaves as a local source <strong>of</strong> <strong>the</strong> solar radio emission. The observationsto-day present a local source as a multi-component plasma structure generated by a number <strong>of</strong> different mechanisms,both <strong>of</strong> <strong>the</strong>rmal and non-<strong>the</strong>rmal origin. One should have in mind that classification <strong>of</strong> <strong>the</strong>se components and <strong>the</strong>iridentification is still under consideration and far <strong>from</strong> being completed due to <strong>the</strong> absence <strong>of</strong> multi-frequency,regularly working solar instrument with high two-dimensional resolution. Below we discuss <strong>the</strong>ir appearance andphysical diagnostics using <strong>the</strong> Nobeyama radioheliograms.3.1. Sunspot-associated SourcesIdentified in early sixties, this component became one <strong>of</strong> <strong>the</strong> most obviously determined in <strong>the</strong> wavelength range<strong>of</strong> short cm (2-4 cm). These radio sources are generated by <strong>the</strong>rmal cyclotron emission at <strong>the</strong> second and thirdharmonics <strong>of</strong> <strong>the</strong> electron gyr<strong>of</strong>requency in <strong>the</strong> magnetic field,B(s =2)= 5400 ; B(s =3)=3570λ λ(1)This implies that at Nobeyama we can see sunspots as bright strongly polarized regions with B=2000 G magneticfield in <strong>the</strong> lower corona or CCTR. An example <strong>of</strong> such a case was studied by Shibasaki et al. (1994). We illustratesome o<strong>the</strong>r examples later.3.2. Neutral Line-associated sourcesGenerally speaking this component becomes most prominent at longer wavelengths in <strong>the</strong> middle <strong>of</strong> cm-wavelengthrange (4-6 cm). A number <strong>of</strong> studies <strong>of</strong> this component made with <strong>the</strong> large instruments have shown a significantincrease <strong>of</strong> radio brightness above optically determined neutral lines (NL) <strong>of</strong> <strong>the</strong> photospheric magnetic field (zero
44 G. GelfreikhFig. 3.. <strong>Radio</strong> maps <strong>of</strong> <strong>the</strong> sun at <strong>the</strong> wavelength <strong>of</strong> λ =1.76 cm on July 22, 1994 obtained with <strong>the</strong> Nobeyama radioheliograph. TheV-map (left) represents <strong>the</strong> structure <strong>of</strong> magnetic fields (longitude component). The polarized regions well coincide with Ca + plages.The I-map (right) shows that <strong>the</strong> brightest radio features are connected with <strong>the</strong> neutral lines <strong>of</strong> magnetic fields. The optical map<strong>of</strong> solar activity for both radio maps is shown accordance bulletin ”Solnechnye Dannye” <strong>of</strong> <strong>the</strong> Pulkovo Observatory.values <strong>of</strong> <strong>the</strong> longitudinal component) (Kundu, Alissandrakis, 1994). This increase in radio brightness is a manifestation<strong>of</strong> <strong>the</strong> local larger growth <strong>of</strong> <strong>the</strong> release <strong>of</strong> energy in <strong>the</strong> regions with increased gradients <strong>of</strong> <strong>the</strong> magneticfields. The nature <strong>of</strong> <strong>the</strong> generated radio flux include three components: <strong>the</strong>rmal bremsstrahlung due to increaseddensity in some magnetic tubes overlying NL, gyroresonance <strong>the</strong>rmal emission in structures <strong>of</strong> compressed magneticfields and gyrosynchrotron radiation <strong>of</strong> non<strong>the</strong>rmal electrons.It is worth mentioning that <strong>the</strong> regions surrounding NL <strong>of</strong> <strong>the</strong> photospheric magnetic field is a typical spot todevelop flaring activity. Important result following <strong>from</strong> radio observations is declaring <strong>the</strong> fact <strong>of</strong> long-lasting,practically continuous acceleration <strong>of</strong> particles leading to some components <strong>of</strong> local radio sources. This follows both<strong>from</strong> <strong>the</strong> spectra <strong>of</strong> NL-associated sources (using <strong>the</strong> RATAN-600 observations) and <strong>from</strong> comparison <strong>of</strong> extrapolatedmagnetic fields into <strong>the</strong> solar corona and <strong>the</strong> brightness distribution <strong>of</strong> <strong>the</strong> sources at 6 cm (VLA, WSRT and SSRTdata).Of special interest are probably <strong>the</strong> so called “peculiar sources”, typically connected with delta-configurations<strong>of</strong> sunspot magnetic fields, where gradients <strong>of</strong> <strong>the</strong> field is especially strong. In such sources very high brightnesstemperatures <strong>of</strong> 10 7 K are met in a stable state <strong>of</strong> <strong>the</strong> sources lasting for several days (RATAN-600 observations).As far as Nobeyama observations are concerned <strong>the</strong> first thing to be noticed is that radio magnetograms <strong>of</strong> <strong>the</strong>active regions (see <strong>the</strong> next section) give a very accurate presentation <strong>of</strong> <strong>the</strong> NL <strong>of</strong> <strong>the</strong> longitudinal component <strong>of</strong><strong>the</strong> ARmagnetic fields (see Figure 3). This refers both to highly developed active regions including large sunspotsand to weaker ones, with no spots at all. A comparison <strong>of</strong> <strong>the</strong> magnetograms (V-maps) <strong>of</strong> <strong>the</strong> sun with structure<strong>of</strong> <strong>the</strong> same ARs observed on <strong>the</strong> I-maps has shown that <strong>the</strong> brightest detail in intensity is usually referred to someregion above <strong>the</strong> NL, obviously representing a loop, striding <strong>the</strong> NL structure. Important information for plasmadiagnostics in this case is a reliable estimate <strong>of</strong> <strong>the</strong> emission measure EM = ∫ Ne 2 dl <strong>of</strong> <strong>the</strong> loop due to <strong>the</strong> fact <strong>of</strong><strong>the</strong> weak dependence <strong>of</strong> <strong>the</strong> radio flux on electron temperature T :I ∝ EM √ (2)TA more detailed analysis <strong>of</strong> a NL-associated source using <strong>the</strong> Nobeyama data is presented in a separate paper atthis conference (Uralov et al.).3.3. Halo SourcesBesides sources with characteristic scale <strong>of</strong> some ten thousands km discussed above we do observe in microwavessome diffuse components <strong>of</strong> <strong>the</strong> spatial scale <strong>of</strong> <strong>the</strong> whole AR, some 10 5 km. This component is especially typicalfor wavelength range <strong>of</strong> 8-12 cm and longer. Diffuse character <strong>of</strong> <strong>the</strong> component may be due to processes <strong>of</strong> plasmascattering (Bastian et al. 1997). At longer wave (say 20 to 30 cm) <strong>the</strong> bulk <strong>of</strong> <strong>the</strong> emission is probably generated
<strong>Physics</strong> <strong>of</strong> <strong>the</strong> <strong>Solar</strong> <strong>Active</strong> <strong>Regions</strong> <strong>from</strong> <strong>Radio</strong> <strong>Observations</strong> 45by <strong>the</strong>rmal bremsstrahlung <strong>of</strong> <strong>the</strong> “coronal condensation” (with τ>1). However, at its maximum near λ ≈ 8 cm<strong>the</strong> increase <strong>of</strong> its flux can not be explained in terms <strong>of</strong> <strong>the</strong>rmal bremsstrahlung because <strong>the</strong> flux in this wavelengthrange exceeds flux at short cm waves by several times. Very low brightness <strong>of</strong> <strong>the</strong> halo on I-maps <strong>of</strong> Nobeyama stillsignificantly increase this discrepancy. On <strong>the</strong> o<strong>the</strong>r hand, an attempt to interpret this emission in terms <strong>of</strong> <strong>the</strong>rmalgyroresonance emission also meets serious obstacles because this component is observed even in very weak ARs withweak magnetic field; <strong>the</strong>re is no ground to cover <strong>the</strong> whole ARwith magnetic field <strong>of</strong> strength amounting to severalhundred gauss (condition follows <strong>from</strong> equation (1)).So, we must conclude that <strong>the</strong> halo is due to emission <strong>of</strong> non<strong>the</strong>rmal electrons, continuously generated in mostARs, both weak and strong. They are supposed to reflect an existence <strong>of</strong> “radiation belts” in magnetospheres <strong>of</strong> <strong>the</strong>solar ARs. The problem to be solved here is <strong>the</strong> relative stability <strong>of</strong> such sources. The reason may be connectedwith <strong>the</strong> fine structures <strong>of</strong> <strong>the</strong> source and averaging over <strong>the</strong>m by <strong>the</strong> observations. The o<strong>the</strong>r problem still waitingits final solution is comparatively low upper limit <strong>of</strong> brightness temperature <strong>of</strong> <strong>the</strong> dm halo, usually not exceedingseveral millions K. The essential role <strong>of</strong> scattering <strong>of</strong> <strong>the</strong> emission in <strong>the</strong>rmal plasma may help to understand <strong>the</strong>physical nature <strong>of</strong> this limit.4. <strong>Radio</strong> Magnetography<strong>Radio</strong> observations present a number <strong>of</strong> methods to measure magnetic fields in <strong>the</strong> chromosphere and <strong>the</strong> corona.Probably only <strong>the</strong> radio has an opportunity to measure more or less directly <strong>the</strong> magnetic field strength in <strong>the</strong> solarcorona instead <strong>of</strong> interpolations used while interpreting optical observations or studying <strong>the</strong> field line structure inEUV or X-rays <strong>from</strong> Space missions.4.1. Thermal BremsstrahlungHistorically <strong>the</strong>rmal bremsstrahlung was <strong>the</strong> first component identified as <strong>the</strong> mechanism responsible for <strong>the</strong>increased emission <strong>of</strong> <strong>the</strong> so called slowly-varying component <strong>of</strong> <strong>the</strong> solar radio emission. As we have seen above,its role has become ra<strong>the</strong>r limited while interpreting <strong>the</strong> radio emission <strong>of</strong> <strong>the</strong> solar active regions. However, as wecome nearer to short cm and especially mm wavelengths its role is increasing; it has become dominant already atλ =1.76 cm <strong>of</strong> Nobeyama. This makes <strong>the</strong> analysis <strong>of</strong> this mechanism <strong>the</strong> most important tool in studying magneticfields and electron densities (emission measure), especially.As components <strong>of</strong> a local source observed at λ =1.76 cm at <strong>the</strong> Nobeyama radioheliograph we can see <strong>the</strong> followingcomponents:- Wide halo, covering <strong>the</strong> whole ARis due mostly to increase <strong>of</strong> magnetic field and temperature-density structurein <strong>the</strong> chromosphere (Figure 3&4). This component is well identified on <strong>the</strong> V-maps.-Narrower structures surrounding <strong>the</strong> NL <strong>of</strong> <strong>the</strong> magnetic fields and representing <strong>the</strong> coronal loops. These structureswe expect to have good coincidence with features observed in s<strong>of</strong>t X-rays. This has been confirmed by Shibasaki(1994) for an AR<strong>of</strong> August 1992. However, it is not always <strong>the</strong> case and an ARseen on June 09, 1995 looks muchmore compact in radio I-map than that on X-ray map. Of special interest is <strong>the</strong> observation <strong>of</strong> such coronal loopsover <strong>the</strong> limb where one can see <strong>the</strong>ir height distribution <strong>of</strong> <strong>the</strong> density and <strong>the</strong> magnetic field (Figure 4).4.2. Gyroresonance EmissionThe most reliable manifestation <strong>of</strong> this mechanism are sunspot-associated sources with fast-growing spectra in <strong>the</strong>wavelength range <strong>of</strong> about 2 to 3 cm and strong (nearly 100%) circular polarization at shorter wavelength where <strong>the</strong>source is observed. The presence <strong>of</strong> this radiation is <strong>the</strong> evidence <strong>of</strong> <strong>the</strong> magnetic field at <strong>the</strong> third harmonic <strong>of</strong> <strong>the</strong>gyr<strong>of</strong>requency according to <strong>the</strong> Formula (1). The high brightness <strong>of</strong> <strong>the</strong> source (T b > 10 5 ) shows that this strength<strong>of</strong> <strong>the</strong> field achieved <strong>the</strong> corona. Due to thin layer <strong>of</strong> <strong>the</strong> CCTR<strong>the</strong> size <strong>of</strong> <strong>the</strong> source illustrates <strong>the</strong> size <strong>of</strong> <strong>the</strong>magnetic region <strong>of</strong> <strong>the</strong> particular strength at level <strong>of</strong> <strong>the</strong> CCTR. So, if we have a number <strong>of</strong> <strong>the</strong> radio maps at differentfrequencies we come to possibility to make a magnetogram at this level <strong>of</strong> <strong>the</strong> solar atmosphere (observations withOVRO, Bastian et al. 1997 ). The shortest wavelength <strong>of</strong> this emission (observations made with <strong>the</strong> RATAN-600)gives <strong>the</strong> highest strength <strong>of</strong> <strong>the</strong> magnetic field penetrating <strong>the</strong> corona (see an example at Figure 5).Ano<strong>the</strong>r possible type <strong>of</strong> <strong>the</strong>rmal cyclotron emission may be due to current sheet and similar structures. Amanifestation <strong>of</strong> “cyclotron line observations” is presented at this session by Zlotnik.An analysis <strong>of</strong> combined optical (in several lines) and radio methods <strong>of</strong> measuring magnetic field strength in asunspot result in a distribution <strong>of</strong> magnetic field with height (Abramov-Maximov et al. 1996 ). An example <strong>of</strong> suchstudy with <strong>the</strong> usage <strong>of</strong> Nobeyama data is shown in Figure 6.
46 G. GelfreikhFig. 4.. <strong>Radio</strong> maps <strong>of</strong> an active region on <strong>the</strong> sun at <strong>the</strong> wavelength <strong>of</strong> λ =1.76 cm on June 09 (left) and June 14 (right), 1995 obtainedwith Nobeyama radioheliograph. On <strong>the</strong> right picture shows <strong>the</strong> active region (coronal loop) over <strong>the</strong> limb. I-maps are shown at <strong>the</strong>top, V-maps — in <strong>the</strong> middle. Below <strong>the</strong>y are overlaid.Fig. 5.. <strong>Radio</strong> scans <strong>of</strong> <strong>the</strong> sun (I & V ) at <strong>the</strong> wavelength <strong>of</strong> λ =4.32 cm on June 16, 1999 obtained with radio telescope RATAN-600.Below <strong>the</strong> spectra <strong>of</strong> <strong>the</strong> main sources in total intensity and polarization are shown. The strength <strong>of</strong> <strong>the</strong> maximum coronal field forevery polarized source is shown above or below its scan.Fig. 6.. The distribution <strong>of</strong> magnetic field above a sunspot with height for sunspot group No.142 (bulletin ”Solnechnye Dannye”).Optical and radio observations were made on June 28, 1993.
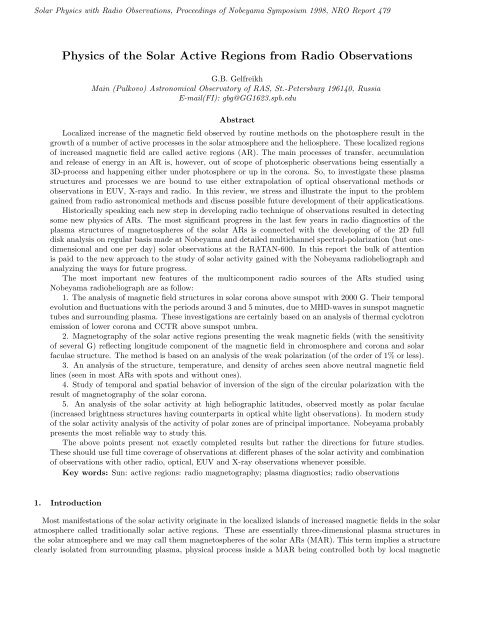
<strong>Physics</strong> <strong>of</strong> <strong>the</strong> <strong>Solar</strong> <strong>Active</strong> <strong>Regions</strong> <strong>from</strong> <strong>Radio</strong> <strong>Observations</strong> 47Fig. 7.. Model computations <strong>of</strong> <strong>the</strong> inversion <strong>of</strong> polarization in QT-region for a radio source generated by <strong>the</strong>rmal bremsstrahlung <strong>of</strong> asymmetrical flocculi for λ =1.76 cm. (courtesy by B.I.Ryabov)4.3. Inversion <strong>of</strong> PolarizationCircularly polarized component emitted in most stable radio sources in most cases has an excess <strong>of</strong> extraordinarymode. However, we meet situations when <strong>the</strong> sign <strong>of</strong> polarization is reversed. This happens both as a function <strong>of</strong>time and wavelength. There are several reasons responsible for <strong>the</strong> effect:- The effect <strong>of</strong> propagation across QT-region (<strong>the</strong> region <strong>of</strong> quasi-transverse propagation). This effect was observedby many authors at different cm-waves bands, Nobeyama radioheliograph including. It has become an essential toolto magnetography <strong>of</strong> coronal magnetic field and is presented in more detail (see Alissandrakis, 1999).- In <strong>the</strong> case <strong>of</strong> <strong>the</strong>rmal emission with optical thickness τ>1, both for bremsstrahlung and cyclotron mechanisms,<strong>the</strong> inversion <strong>of</strong> <strong>the</strong> temperature gradient results in inversion <strong>of</strong> <strong>the</strong> sign <strong>of</strong> polarization.- In <strong>the</strong> case <strong>of</strong> gyrosynchrotron emission <strong>of</strong> non<strong>the</strong>rmal electrons trapped in a magnetic loop <strong>the</strong> inversion <strong>of</strong>polarization in time (due to solar rotation) may be due to <strong>the</strong> effects <strong>of</strong> directivity <strong>of</strong> <strong>the</strong> emission. This effect isprobably important for longer cm wavelengths.Coming back to Nobeyama observations we can expect <strong>the</strong> inversion in QT-region in <strong>the</strong> solar corona not only <strong>of</strong>strongly polarized sunspot-associated sources but also weakly polarized emission <strong>of</strong> halo above flocculi (Figure 3).The expected effect <strong>of</strong> inversion presented by model computations is shown in Figure 7. If successful, it may present
48 G. GelfreikhFig. 8.. The gyroresonance emission layers responsible radio emission <strong>of</strong> sunspot- associated sources and expected effect <strong>of</strong> MHD-waveson <strong>the</strong> emission (top). The structure <strong>of</strong> <strong>the</strong> radio source <strong>of</strong> an active region (August 16, 1992) — <strong>the</strong> RATAN-600 observations (lowerleft). The spectra <strong>of</strong> polarized component <strong>of</strong> <strong>the</strong> source for 5 days (lower right).a new important method for detailed study <strong>of</strong> <strong>the</strong> structure <strong>of</strong> coronal magnetic fields for weak active regions, withno sunspot inside.4.4. Faraday RotationThe angle <strong>of</strong> Faraday rotation is determined by <strong>the</strong> formula:∫θ = const · λ 2 · B l · N e dl (3)The effect is very sensitive to <strong>the</strong> magnetic field strength and wavelength and needs observations with narrowwavebands. The integral in this equation is called rotation measure. The observations at a number <strong>of</strong> frequenciesmay result in its determination. As far as <strong>the</strong> radio observations <strong>of</strong> <strong>the</strong> sun are concerned <strong>the</strong> main problem isdue to <strong>the</strong> effect <strong>of</strong> limiting polarization when a radio wave leaves <strong>the</strong> sun. The presence <strong>of</strong> linear component is anexception in solar observations. It may be <strong>the</strong> case <strong>of</strong> mode coupling in <strong>the</strong> QT region in <strong>the</strong> corona above an AR.Such a case was investigated by Alissandrakis using observations with WSRT (Alissandrakis et al. 1994).The o<strong>the</strong>r way is to use observations <strong>of</strong> linearly polarized sources, like Crab Nebula (Parijskij et al. 1980, Sobolevaet al. 1983). Such observations provide some interesting information about magnetic field in <strong>the</strong> outer corona.5. OscillationsThe microwave observations are important not only in <strong>the</strong> study <strong>of</strong> plasma parameters but also dynamical processesessential for <strong>the</strong> problems <strong>of</strong> generation, transfer and release <strong>of</strong> energy in magnetospheres <strong>of</strong> <strong>the</strong> solar ARs. Animportant agent in transfer <strong>of</strong> non<strong>the</strong>rmal energy <strong>from</strong> below <strong>the</strong> photosphere is flux <strong>of</strong> MHD waves. The study <strong>of</strong><strong>the</strong>se waves also provides an important tool in diagnostics <strong>of</strong> sub-photospheric structure <strong>of</strong> <strong>the</strong> sun (helioseismology).In plasma-magnetic structures <strong>of</strong> <strong>the</strong> solar atmosphere we expect to get resonance cavities <strong>of</strong> some modes <strong>of</strong> <strong>the</strong>sewaves. We do expect <strong>the</strong>ir manifestation in different components <strong>of</strong> <strong>the</strong> radio emission <strong>of</strong> an AR. In fact, manyperiods, <strong>from</strong> several minutes to half an hour, were found by a number <strong>of</strong> researchers.
<strong>Physics</strong> <strong>of</strong> <strong>the</strong> <strong>Solar</strong> <strong>Active</strong> <strong>Regions</strong> <strong>from</strong> <strong>Radio</strong> <strong>Observations</strong> 49Fig. 9.. <strong>Radio</strong> maps <strong>of</strong> <strong>the</strong> sun at λ =1.76 cm (left) and oscillation <strong>of</strong> <strong>the</strong> sunspot -associated source (AR7260, right). The structure,time variations and spectrum <strong>of</strong> <strong>the</strong>se variations are shown.However, most <strong>of</strong> <strong>the</strong>se studies were made with instruments <strong>of</strong> low spatial resolution, and in many cases withstrong influence <strong>of</strong> terrestrial atmospheric effects and o<strong>the</strong>r interference. The long continuous stretches <strong>of</strong> highspatial resolution observations at Nobeyama open a new page in this study (Gelfreikh et al. 1995). We began withan analysis <strong>of</strong> possible fluctuations <strong>of</strong> sunspot-associated sources because one can expect here a very sensitive methodto study oscillations in magnetic tube <strong>of</strong> a sunspot (see Figure 9). An analysis <strong>of</strong> four sunspot groups has beenmade. An example <strong>of</strong> such study is shown in Figure 10. In three cases <strong>of</strong> large stable spots, clearly seen with highlypolarized gyroresonance source at <strong>the</strong> V-maps <strong>of</strong> Nobeyama we detected periodic oscillations. Spectral analysis <strong>of</strong>tine variation <strong>of</strong> <strong>the</strong> polarized sources has shown presence <strong>of</strong> several periods in <strong>the</strong> range <strong>of</strong> 120-220 sec, in goodagreement with <strong>the</strong> periods <strong>of</strong> so called umbral oscillations, observed in sunspots by optical methods. In most casesalso <strong>the</strong> five-minute mode was also registered.Both <strong>the</strong> three-minute (in umbra <strong>of</strong> sunspots) and five-minute (covering <strong>the</strong> whole solar surface) modes <strong>of</strong> MHDwavesare known in solar physics. In case <strong>of</strong> <strong>the</strong> three-minute, several alternative interpretations with differentboundaries <strong>of</strong> <strong>the</strong> resonance cavities and MHD-modes are under consideration. The Nobeyama data gives a newtool to study <strong>the</strong> manifestation <strong>of</strong> <strong>the</strong> oscillations at <strong>the</strong> basis <strong>of</strong> <strong>the</strong> solar corona - <strong>the</strong> region which most <strong>the</strong>oriesconsider as a upper level <strong>of</strong> reflection <strong>of</strong> <strong>the</strong> MHD wave in a cavity.To study this effect we have made a series <strong>of</strong> pictures <strong>of</strong> <strong>the</strong> fluctuating radio source covering time interval <strong>of</strong>about four periods <strong>of</strong> oscillations (12.5 minutes). In Figure 10 <strong>the</strong>se pictures are shown with intervals <strong>of</strong> 10 sec.With <strong>the</strong> spatial resolution <strong>of</strong> about 10 arcsec it looks as <strong>the</strong> whole effect is due to increase in brightness <strong>of</strong> somesmall regions, while <strong>the</strong> whole source looks very stable. This seems to be in general agreement in <strong>the</strong> observations<strong>of</strong> effect with high-resolution optical magnetograms (e.g., Horn et al. 1997). For future study in this direction weneed parallel optical and radio observations <strong>of</strong> some oscillating sunspots.Ano<strong>the</strong>r progress in <strong>the</strong> problem uses <strong>the</strong> spectral observations <strong>of</strong> a oscillating source with <strong>the</strong> radio telescopeRATAN-600 (Figure 8). The logarithmic spectral index for <strong>the</strong> sunspot associated source was found to be n ≈ 10.It follows that oscillations in <strong>the</strong> magnetic field with amplitude <strong>of</strong> ±4G are enough to result in <strong>the</strong> observed 4%oscillation <strong>of</strong> <strong>the</strong> radio flux at λ =1.76 cm.In future we may hope to get some information on <strong>the</strong> oscillation <strong>of</strong> <strong>the</strong>se sources in <strong>the</strong> whole cm wave-lengthrange (observations on <strong>the</strong> RATAN-600, VLA, WSRT, OVRO). Such observations can give information how deepinto <strong>the</strong> solar corona can penetrate <strong>the</strong> three-minute mode.6. Modelling <strong>of</strong> Magnetospheres <strong>of</strong> ARsModelling <strong>of</strong> magnetospheres <strong>of</strong> <strong>the</strong> solar ARs include two kinds <strong>of</strong> problems:- diagnostics <strong>of</strong> physical parameters representing 3D-structure <strong>of</strong> <strong>the</strong> atmosphere <strong>of</strong> an AR(distribution <strong>of</strong> intensityand direction <strong>of</strong> <strong>the</strong> magnetic field, temperature and plasma density, and also <strong>the</strong> presence <strong>of</strong> non<strong>the</strong>rmal particles);- study <strong>of</strong> time-dependent physical processes to find energy sources <strong>of</strong> heating <strong>the</strong> corona, producing non<strong>the</strong>rmalparticles (flares), mass ejection etc.
50 G. GelfreikhFig. 10.. Variations <strong>of</strong> <strong>the</strong> structure <strong>of</strong> a polarized source during <strong>the</strong> three-minute oscillations. (<strong>Observations</strong> were made with <strong>the</strong>Nobeyama radio heliograph).The first problem uses two approaches to get a 3D picture <strong>from</strong> observed 2D pictures: stereoscopic analysis <strong>of</strong> astable ARfor several dates (see Aschwanden 1995, and Figure 4).The second method uses solution <strong>of</strong> equation <strong>of</strong> transfer to find longitude distribution, both <strong>of</strong> <strong>the</strong> magnetic fieldand temperature, density <strong>of</strong> <strong>the</strong> plasma (Grebinskij, 1999, this proc.).7. Future DevelopmentNow we summarize some problems to be considered in <strong>the</strong> near future using <strong>the</strong> observations <strong>of</strong> <strong>the</strong> Nobeyamaradioheliograph.1. I would like to stress <strong>the</strong> importance <strong>of</strong> studying activity in polar active regions as part <strong>of</strong> <strong>the</strong> global activity <strong>of</strong><strong>the</strong> sun. That implies importance to compare at each step <strong>the</strong> level and peculiarity <strong>of</strong> active regions near <strong>the</strong> poles(polar faculae) and <strong>the</strong> “classical” low-latitude ARs. We have got already <strong>the</strong> observations at declining phase <strong>of</strong> <strong>the</strong>previous (22-nd) cycle, <strong>the</strong> growth phase <strong>of</strong> <strong>the</strong> present (23-rd) cycle and its maximum is not so far away. We stillmay have a hope to use <strong>the</strong> Nobeyama radioheliograph to analyze <strong>the</strong> behavior <strong>of</strong> <strong>the</strong> polar magnetic fields, bothusing chromospheric structures and possibly still polarization effects (though very weak ones).2. In analyzing <strong>the</strong> three-dimensional structures <strong>of</strong> <strong>the</strong> magnetospheres <strong>of</strong> <strong>the</strong> solar ARs only some first, but verypromising steps have been made. Above we discussed some promising methods to restore 3D-structure <strong>of</strong> magneticfields in strong and weak ARs, accessible both on <strong>the</strong> chromospheric and coronal levels <strong>of</strong> <strong>the</strong> solar atmosphere.Both stereoscopic and tomography (solution <strong>of</strong> <strong>the</strong> equation <strong>of</strong> radiation transfer) methods are to be used.3. Studying <strong>the</strong> physical processes representing <strong>the</strong> transfer, accumulation and release <strong>of</strong> non<strong>the</strong>rmal energy(leading both to hot <strong>the</strong>rmal corona and evidently non<strong>the</strong>rmal flare and mass-ejecting events). At this stage weshould develop <strong>the</strong> methods <strong>of</strong> studying 3-minute, 5-minute oscillations detected at Nobeyama above sunspots.However, we have some preliminary results (see e.g. polar faculae at Figure 3) showing that we have tools toinvestigate plasma oscillations (plasma turbulence) in many structures at λ =1.76 cm.8. AcknowledgementsThe author thanks <strong>the</strong> support to some <strong>of</strong> <strong>the</strong> results presented in this paper by RFBR, GRANT 96-02-16268aand Russian program “Astronomy”, grant 1.5.4.6. Especially he feels thankful to <strong>the</strong> staff <strong>of</strong> <strong>the</strong> Nobeyama <strong>Radio</strong>Observatory for possibility to work with <strong>the</strong> radioheliograph observations.ReferencesAbramov-Maximov V.E., Vyalshin G.F., Gelfreikh G.B., Shatilov V.I. 1996, SolPhys 164, 333Akhmedov, Sh.B., Borovik V.N., Gelfreikh G.B., Bogod V.M., Korzhavin A.N., Petrov Z.E., Dikij V.N., Lang K.R., WilsonR.F. 1986, ApJ 301, 460Akhmedov Sh.B., Gelfreikh G.B., Bogod V.M., Korzhavin A.N. 1982, SolPhys 79, 41
<strong>Physics</strong> <strong>of</strong> <strong>the</strong> <strong>Solar</strong> <strong>Active</strong> <strong>Regions</strong> <strong>from</strong> <strong>Radio</strong> <strong>Observations</strong> 51Alissandrakis C.E., Kundu M.R., Lantos P. 1980, A&A 82, 30.Alissandrakis C.E., Gelfreikh G.B., Borovik V.N., Korzhavin A.N., Bogod V.M., Nindos A., Kundu M.R. 1993, A&A 270,509.Alissandrakis C.E., Chiuderi Drago, F. 1994, ApJL 428, L73.Aschwanden M.J. 1993, ApJ 436, 425Aschwanden M.J., Bastian T.S. 1994, ApJ 426, 425Bastian T.S., Gary D.E., White S.M., Hurford G.J. 1997, BBSO#1010,1Bogod V.M., Gelfreikh G.B. 1980, SolPhys 67, 29Bogod V.M., Gelfreikh G.B., Ryabov B.I., Hafizov S.R. 1993, The magnetic and velocity fields <strong>of</strong> solar active regions, ASPConference Series, eds. H. Zirin, & G. Ai, & H. Wang, 302Bogod V.M., Grebinskij A.S. 1997, SolPhys 176, 67Gary D.E., Hurford G.J. 1994, ApJ 420, 903Gelfreikh G.B., Peterova N.G., Ryabov B.I. 1987, SolPhys 108, 89Gelfreikh G.B., N.A.Pilyeva, B.I.Ryabov 1997, SolPhys 170, 253Gelfreikh G.B. 1996, in <strong>Radio</strong> Emission <strong>from</strong> <strong>the</strong> Stars and Sun, ed. A.R. Taylor, & J.M. Paredes, ASP Conference Series 93,p.415Gelfreikh G.B., Grechnev V., Kosugi T., Shibasaki K. 1999, SolPhys 185, 177Horn T., Staude J., Landgraf V. 1997, SolPhys 172, 69Kundu M.R., Alissandrakis C.E., Bregman J.D., Hin A.C. 1977, ApJ 213, 278.Kundu M.R., Alissandrakis C.E. 1984, SolPhys 94, 249Lang K.L. 1993, ApJ 419, 398Nakajima H., Nishio M., Enome Sh., Shibasaki K., Takano T., Hanaoka Y., Torii Ch., Sekiguchi H. et al. 1994, Proceedings<strong>of</strong> <strong>the</strong> IEEE 82, 705Parijskij Yu.N., Soboleva N.S., Tim<strong>of</strong>eeva G.M. 1980, Astr<strong>of</strong>iz. Issld. Izv. Spets. Astr<strong>of</strong>iz. Obs. 12, 56Ryabov B.I., Pilyeva N.A., Alissandrakis C.E., Shibasaki K., Bogod V.M., Garaimov V.I., Gelfreikh G.B. 1999, SolPhys 185,157Shibasaki K., Enome S., Nakajima H., Nishio M., Takano T., Hanaoka Y., Torii Ch., Sekiguchi H. et al. 1994, PASJ 46, L17Soboleva N.S., Tim<strong>of</strong>eeva G.M. 1983, Pis’ma Astron. Zh. 9, 409Sych R.A., Uralov A.M., Korzhavin A.N. 1993, SolPhys 144, 59Zhugzhda Y.D., Locans V., Staude J. 1983, SolPhys 82, 369