Morphology and rheology of poly(methyl methacrylate)-block-poly ...
Morphology and rheology of poly(methyl methacrylate)-block-poly ...
Morphology and rheology of poly(methyl methacrylate)-block-poly ...
- No tags were found...

Create successful ePaper yourself
Turn your PDF publications into a flip-book with our unique Google optimized e-Paper software.
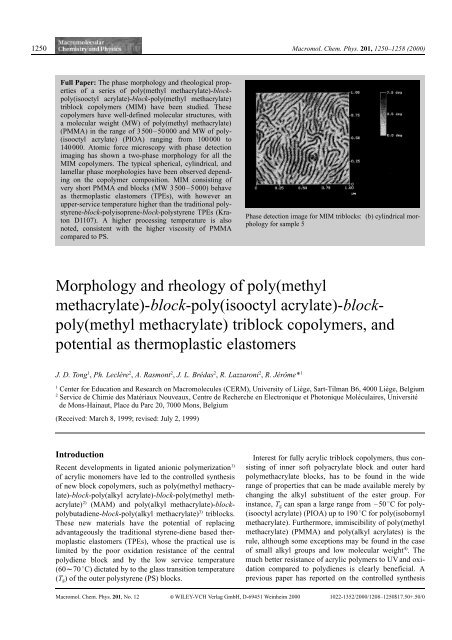
1250Macromol. Chem. Phys. 201, 1250–1258 (2000)Full Paper: The phase morphology <strong>and</strong> rheological properties<strong>of</strong> a series <strong>of</strong> <strong>poly</strong>(<strong>methyl</strong> <strong>methacrylate</strong>)-<strong>block</strong><strong>poly</strong>(isooctylacrylate)-<strong>block</strong>-<strong>poly</strong>(<strong>methyl</strong> <strong>methacrylate</strong>)tri<strong>block</strong> co<strong>poly</strong>mers (MIM) have been studied. Theseco<strong>poly</strong>mers have well-defined molecular structures, witha molecular weight (MW) <strong>of</strong> <strong>poly</strong>(<strong>methyl</strong> <strong>methacrylate</strong>)(PMMA) in the range <strong>of</strong> 3500–50000 <strong>and</strong> MW <strong>of</strong> <strong>poly</strong>-(isooctyl acrylate) (PIOA) ranging from 100000 to140000. Atomic force microscopy with phase detectionimaging has shown a two-phase morphology for all theMIM co<strong>poly</strong>mers. The typical spherical, cylindrical, <strong>and</strong>lamellar phase morphologies have been observed dependingon the co<strong>poly</strong>mer composition. MIM consisting <strong>of</strong>very short PMMA end <strong>block</strong>s (MW 3500–5000) behaveas thermoplastic elastomers (TPEs), with however anupper-service temperature higher than the traditional <strong>poly</strong>styrene-<strong>block</strong>-<strong>poly</strong>isoprene-<strong>block</strong>-<strong>poly</strong>styreneTPEs (KratonD1107). A higher processing temperature is alsonoted, consistent with the higher viscosity <strong>of</strong> PMMAcompared to PS.Phase detection image for MIM tri<strong>block</strong>s: (b) cylindrical morphologyfor sample 5<strong>Morphology</strong> <strong>and</strong> <strong>rheology</strong> <strong>of</strong> <strong>poly</strong>(<strong>methyl</strong><strong>methacrylate</strong>)-<strong>block</strong>-<strong>poly</strong>(isooctyl acrylate)-<strong>block</strong><strong>poly</strong>(<strong>methyl</strong><strong>methacrylate</strong>) tri<strong>block</strong> co<strong>poly</strong>mers, <strong>and</strong>potential as thermoplastic elastomersJ. D. Tong 1 , Ph. Leclère 2 , A. Rasmont 2 , J. L. Brédas 2 , R. Lazzaroni 2 , R. Jérôme* 11Center for Education <strong>and</strong> Research on Macromolecules (CERM), University <strong>of</strong> Liège, Sart-Tilman B6, 4000 Liège, Belgium2Service de Chimie des Matériaux Nouveaux, Centre de Recherche en Electronique et Photonique Moléculaires, Universitéde Mons-Hainaut, Place du Parc 20, 7000 Mons, Belgium(Received: March 8, 1999; revised: July 2, 1999)IntroductionRecent developments in ligated anionic <strong>poly</strong>merization 1)<strong>of</strong> acrylic monomers have led to the controlled synthesis<strong>of</strong> new <strong>block</strong> co<strong>poly</strong>mers, such as <strong>poly</strong>(<strong>methyl</strong> <strong>methacrylate</strong>)-<strong>block</strong>-<strong>poly</strong>(alkylacrylate)-<strong>block</strong>-<strong>poly</strong>(<strong>methyl</strong> <strong>methacrylate</strong>)2) (MAM) <strong>and</strong> <strong>poly</strong>(alkyl <strong>methacrylate</strong>)-<strong>block</strong><strong>poly</strong>butadiene-<strong>block</strong>-<strong>poly</strong>(alkyl<strong>methacrylate</strong>) 3) tri<strong>block</strong>s.These new materials have the potential <strong>of</strong> replacingadvantageously the traditional styrene-diene based thermoplasticelastomers (TPEs), whose the practical use islimited by the poor oxidation resistance <strong>of</strong> the central<strong>poly</strong>diene <strong>block</strong> <strong>and</strong> by the low service temperature(60l708C) dictated by to the glass transition temperature(T g ) <strong>of</strong> the outer <strong>poly</strong>styrene (PS) <strong>block</strong>s.Interest for fully acrylic tri<strong>block</strong> co<strong>poly</strong>mers, thus consisting<strong>of</strong> inner s<strong>of</strong>t <strong>poly</strong>acrylate <strong>block</strong> <strong>and</strong> outer hard<strong>poly</strong><strong>methacrylate</strong> <strong>block</strong>s, has to be found in the widerange <strong>of</strong> properties that can be made available merely bychanging the alkyl substituent <strong>of</strong> the ester group. Forinstance, T g can span a large range from –508C for <strong>poly</strong>-(isooctyl acrylate) (PIOA) up to 1908C for <strong>poly</strong>(isobornyl<strong>methacrylate</strong>). Furthermore, immiscibility <strong>of</strong> <strong>poly</strong>(<strong>methyl</strong><strong>methacrylate</strong>) (PMMA) <strong>and</strong> <strong>poly</strong>(alkyl acrylates) is therule, although some exceptions may be found in the case<strong>of</strong> small alkyl groups <strong>and</strong> low molecular weight 4) . Themuch better resistance <strong>of</strong> acrylic <strong>poly</strong>mers to UV <strong>and</strong> oxidationcompared to <strong>poly</strong>dienes is clearly beneficial. Aprevious paper has reported on the controlled synthesisMacromol. Chem. Phys. 201, No. 12 i WILEY-VCH Verlag GmbH, D-69451 Weinheim 2000 1022-1352/2000/1208–1250$17.50+.50/0
<strong>Morphology</strong> <strong>and</strong> <strong>rheology</strong> <strong>of</strong> <strong>poly</strong>(<strong>methyl</strong> <strong>methacrylate</strong>) ... 1251<strong>and</strong> mechanical properties <strong>of</strong> PMMA-<strong>block</strong>-PIOA-<strong>block</strong>-PMMA tri<strong>block</strong> co<strong>poly</strong>mers (MIM) 5) . The phase morphology<strong>and</strong> the rheological properties <strong>of</strong> these MIM tri<strong>block</strong>co<strong>poly</strong>mers have been analyzed further <strong>and</strong> are thetopic <strong>of</strong> this paper.Experimental partMaterialsMIM tri<strong>block</strong> <strong>and</strong> MI di<strong>block</strong> co<strong>poly</strong>mers were synthesizedby sequential anionic <strong>poly</strong>merization <strong>of</strong> MMA, tert-butylacrylate (tBA) (<strong>and</strong> MMA, in case <strong>of</strong> tri<strong>block</strong>s) respectively,followed by the acid-catalyzed transalcoholysis <strong>of</strong> the tertbutylester groups by isooctyl alcohol. The detailed synthesiswas reported elsewhere 2, 5) . The molecular characteristics <strong>of</strong>the MIM tri<strong>block</strong>s <strong>and</strong> the MI di<strong>block</strong> are listed in Tab. 1. Acommercial grade <strong>poly</strong>styrene-<strong>block</strong>-<strong>poly</strong>isoprene(PIP)-<strong>block</strong>-<strong>poly</strong>styrene tri<strong>block</strong> co<strong>poly</strong>mer, SIPS (Kraton D1107from Shell Development Company, 15l18 wt.-% uncoupleddi<strong>block</strong>), was used for the sake <strong>of</strong> comparison. Theannounced molecular weight (MW) was 10000–120000–10000, with a <strong>poly</strong>styrene content <strong>of</strong> 15 wt.-%.was recorded in the so-called “s<strong>of</strong>t tapping mode” 6) in orderto avoid deformation <strong>and</strong> indentation <strong>of</strong> the <strong>poly</strong>mer surfaceby the tip. All the images were recorded with the maximumavailable number <strong>of</strong> pixels (512) in each direction. Forimage analysis, the Nanoscope image processing s<strong>of</strong>twarewas used. The images were usually reported as captured,repeated scans assessing the reproducibility <strong>of</strong> the observedstructures.Rheological measurementsThe RSI ARES rheometer from Rheometrics equipped witha force balance transducer was used, either in the cone-platemode: (plate: 25 mm diameter, cone: 48 angle, gap: 56 lmbetween the cone tip <strong>and</strong> the plate; for samples 1 <strong>and</strong> 7) or inthe parallel plate mode (25 mm diameter, for all the othersamples). The temperature control was better than 18C. Theapplied strain was always kept within the linear viscoelasticregime, so that the phase morphology did not change undershearing. The frequency range was between0.1 Hzl16.7 Hz. A Polymer Laboratory DMTA (parallelplate with 7 mm diameter) was used to conduct temperaturesweep experiments at 1 Hz (ramp mode, heating rate <strong>of</strong> 28C/min).Sample preparationThin MIM films were cast on mica from dilute solution inTHF (2 mg/ml) <strong>and</strong> sheltered from dust throughout. THFwas let to evaporate very slowly for a few days. The filmswere annealed at 1408C under high vacuum for 24 h beforeAFM observation. The film thickness was ca. 500 nm.Longer annealing times <strong>and</strong> longer thickness did not changethe microphase morphology. Some topological defects werehowever observed for 1–2 mm thick samples. Films suitedto rheological testing, were prepared by casting a co<strong>poly</strong>mersolution (8 wt.-%; 160 ml) in a 100 mm diameter <strong>poly</strong>ethylenedish. The solvent was evaporated over 4 days at roomtemperature. Ca. 1.5 mm films were dried to constant weightin a vacuum oven at 808C for ca. 1 day. The reason formilder conditions compared to the preparation <strong>of</strong> films forAFM observation must be found in the possible dehydrationat 1408C <strong>of</strong> the residual carboxylic acids left by the transalcoholysisreaction, which might affect the rheological data incontrast to the already set up phase morphology. Accordingly,<strong>rheology</strong> will not be discussed in direct relation to themicrophase morphology observed by AFM. The specimenswere colorless, transparent <strong>and</strong> elastomeric with a smoothsurface.AFM observationAll the AFM images were recorded with a Nanoscope IIIamicroscope from Digital Instruments Inc. operated in theTapping Mode (at 258C, in air). Micr<strong>of</strong>abricated cantileverswere used with a spring constant <strong>of</strong> 30 N N m –1 . The instrumentis equipped with the Extender TM Electronics Module,such that height <strong>and</strong> phase cartographies can be simultaneouslyrecorded. Several areas <strong>of</strong> the same sample wereobserved, with scanning time <strong>of</strong> ca. 5 min. The phase imageResults <strong>and</strong> discussionPhase morphologyThe very low electronic contrast between the constitutive<strong>block</strong>s <strong>of</strong> <strong>poly</strong> alkyl(meth)acrylate-containing tri<strong>block</strong>s isquite a problem for the observation <strong>of</strong> nanophase-separatedmorphology by transmission electron microscopy(TEM) <strong>and</strong> small angle X-ray scattering (SAXS). Onlyindirect techniques, such as NMR 7) <strong>and</strong> DMTA 5) , havebeen used for this purpose. However, atomic force microscopy(AFM) with phase detection imaging has provedvery recently to be very appropriate to the direct observation<strong>of</strong> phase separation in fully acrylic <strong>block</strong> co<strong>poly</strong>mers8) . In this work, tapping-mode atomic force microscopy(TMAFM) with phase detection imaging (PDI) hasbeen used, this technique having proven high efficiencyfor the analysis <strong>of</strong> the phase morphology <strong>of</strong> <strong>poly</strong>styrene<strong>block</strong>-<strong>poly</strong>isoprene-<strong>block</strong>-<strong>poly</strong>styreneco<strong>poly</strong>mers 9) .Fig. 1 shows typical AFM images for the MIM tri<strong>block</strong>containing 6.5 wt% PMMA (sample 1, Tab. 1). Theheight image (Fig. 1a) is very uniform, thus indicatingthat the sample surface is very smooth, in line with ca.1.4 nm root mean square roughness for a 161 lm 2 area.This preliminary observation is a guarantee that any contrastobserved in the PDI image will not originate fromdifferences in the surface topography. The phase image(Fig. 1b) clearly shows a two-phase morphology for thesample 1, that consists <strong>of</strong> bright spheres r<strong>and</strong>omly distributedin a dark matrix. Recent models proposed 10) toaccount for the phase contrast in TMAFM indicate that in“s<strong>of</strong>t tapping” operation, the phase shift is directly related
<strong>Morphology</strong> <strong>and</strong> <strong>rheology</strong> <strong>of</strong> <strong>poly</strong>(<strong>methyl</strong> <strong>methacrylate</strong>) ... 1253The equilibrium phase morphology <strong>of</strong> <strong>block</strong> co<strong>poly</strong>mersstrongly depends on the co<strong>poly</strong>mer composition, asillustrated by the styrene-diene <strong>block</strong> co<strong>poly</strong>mers 11, 12) .Spherical morphology is commonly observed for <strong>poly</strong>styrene(PS) contents up to l17 wt%. When the PS contentranges from 17 to 38 wt.-%, the phase morphology iscylindrical, whereas a lamellar morphology is reportedfor 36l62 wt.-% PS. For the sake <strong>of</strong> comparison, a series<strong>of</strong> MIM co<strong>poly</strong>mers covering a wide range <strong>of</strong> PMMAcomposition has been analyzed by AFM. Fig. 2 showssome typical phase morphologies: PMMA spheres(Fig. 2a) for sample 3 <strong>of</strong> low PMMA content (12 wt.-%),PMMA cylinders (Fig. 2b) for sample 5 <strong>of</strong> intermediatePMMA content (22 wt.-%), <strong>and</strong> PMMA short lamellae(Fig. 2c) for sample 6 <strong>of</strong> higher PMMA content (36 wt.-%). Although the co<strong>poly</strong>mer composition-phase morphologyrelationship is basically comparable for MIM <strong>and</strong>styrene-diene <strong>block</strong> co<strong>poly</strong>mers, MIM with very shortPMMA <strong>block</strong>s (M — n: 3500) shows a well-defined sphericalmorphology, in contrast to the PS-<strong>block</strong>-<strong>poly</strong>butadiene(PB)-b-PS (SBS) <strong>and</strong> SIPS analogues 13) that show nophase separation.The annealing <strong>of</strong> sample 5 has a strong effect on theorientation <strong>of</strong> the PMMA cylinders with respect to thesample surface. Before annealing, the cylinders lie flat onthe surface (Fig. 2b). After annealing at 1408C, only afew flat cylinders coexist with many bright dots whosediameter is similar to the width <strong>of</strong> the flat cylinders. Thisobservation is consistent with the fact that the bright dotsare cylinders st<strong>and</strong>ing upright perpendicular to the surface(Fig. 2d). This reorganization is likely to be governedby the surface energy, which is smaller for PIOA(30610 –3 N/m) than for PMMA (41610 –3 N/m). As theequilibrium is approached, the PMMA cylinders tend toreorganize themselves with their apex at the surface.Viscoelastic behavior <strong>of</strong> MIM tri<strong>block</strong> co<strong>poly</strong>mersIt is well established that the domain structure <strong>of</strong> <strong>block</strong>co<strong>poly</strong>mers, such as SBS <strong>and</strong> SIPS, persists beyond theupper (PS) glass transition temperature. However, as temperatureis raised above a critical value, the microdomainstructure disappears completely, resulting in a homogeneoussystem. This transition is referred to as the orderdisordertransition (ODT), which occurs in all known<strong>block</strong> co<strong>poly</strong>mers 14–18) . The viscoelastic behavior <strong>of</strong> these<strong>block</strong> co<strong>poly</strong>mers significantly changes at the ODT, the<strong>block</strong> co<strong>poly</strong>mer being easily processable beyond ODT.Dynamic temperature sweep experimentsFig. 3 compares the temperature dependence <strong>of</strong> the storagemodulus (G9) <strong>and</strong> the loss factor (t<strong>and</strong>) measured at1 Hz for the 5000–140000–5000 MIM tri<strong>block</strong> (sample2, Tab. 1) <strong>and</strong> the Kraton D1107 sample. The dynamicFig. 3. Temperature dependence <strong>of</strong> the shear storage modulus(G9) <strong>and</strong> the loss factor (tan d) (1 Hz, heating rate: 28C/m). (a)MIM tri<strong>block</strong>, sample 2; (b) Kraton D1107mechanical behavior <strong>of</strong> these samples is typical <strong>of</strong> thermoplasticelastomers, i.e. two transitions, a rubbery plateaubetween them <strong>and</strong> the terminal zone at higher temperature.Compared to Kraton D1107, the MIM sample(Fig. 3a) has quite a comparable behavior, except for theG9 plateau region which is more flat (up to 1108C) asresult <strong>of</strong> the absence <strong>of</strong> di<strong>block</strong> co<strong>poly</strong>mers 19) . The t<strong>and</strong>curves do not exhibit any clear peak at the T g <strong>of</strong> PS (orPMMA) microdomains, which can be explained by thelow PS (or PMMA) content <strong>and</strong> the simultaneous occurrence<strong>of</strong> the flow.Fig. 4 compares the logG9 vs. temperature curves for aseries <strong>of</strong> MIM tri<strong>block</strong> co<strong>poly</strong>mers covering a large range<strong>of</strong> PMMA molecular weight (3500–20000). The behavior<strong>of</strong> MIM tri<strong>block</strong>s is similar to that <strong>of</strong> the Kraton TPEwhen the PMMA molecular weight is smaller than 7000.However, when this molecular weight is higher, no terminalzone is observed up to 2008C, the highest tempera-
1254 J. D. Tong et al.Fig. 4. Temperature dependence <strong>of</strong> the shear storage modulus(G9) for a series <strong>of</strong> MIM tri<strong>block</strong>s at 1 Hz (heating rate: 28C/m).For the sake <strong>of</strong> clarity, curves have been vertically shifted withrespect to sample 2 (sample 1 downwards by 0.5 unit; samples3, 4 <strong>and</strong> 5, upwards by 0.5, 1.0 <strong>and</strong> 1.5 units, respectivelyture tested. It is known that G9 measured at low frequenciesdecreases sharply at or near the order-disorder transitiontemperature (T ODT ) <strong>of</strong> the <strong>block</strong> co<strong>poly</strong>mer 20 – 23) . It isthus obvious that a phase-separated morphology persistsbeyond the glass transition <strong>of</strong> the PMMA microdomains<strong>of</strong> samples 3 to 5, at least up to 2008C. The comparison<strong>of</strong> MIM <strong>and</strong> SIPS <strong>of</strong> comparable molecular structure(sample 4 <strong>and</strong> Kraton D1107), also shows that G9 starts todecrease only at 1208C for MIM, which is ca. 208Chigher than for the SIPS sample, in agreement with ahigher service temperature for the MIM tri<strong>block</strong> co<strong>poly</strong>mer.Relaxation at temperatures beyond T g <strong>of</strong> PMMAThe rheological properties <strong>of</strong> <strong>poly</strong>mers are closely relatedto the relaxation process <strong>of</strong> the <strong>poly</strong>mer chains. Recently,Berglund <strong>and</strong> McKay have thoroughly studied the relaxationbehavior <strong>of</strong> SIPS tri<strong>block</strong> co<strong>poly</strong>mers 19) . The completerelaxation stress proceeds in two steps:diffusion <strong>of</strong>the outer <strong>block</strong>s out <strong>of</strong> the microdomains, followed bydiffusion <strong>of</strong> the released chains through the entangledmid<strong>block</strong> chains. Fig. 5 compares the relaxation for twoMIM tri<strong>block</strong>s <strong>of</strong> different PMMA molecular weight(samples 1 <strong>and</strong> 3) but <strong>of</strong> the same spherical morphology.The relaxation curve for the MIM containing PMMA<strong>block</strong>s <strong>of</strong> 7000 MW clearly confirms Berglund <strong>and</strong>McKay’s conclusion, i.e. a two-step drop <strong>of</strong> G(t) in the10 –1 l10 1 s <strong>and</strong> 10 1 l2610 2 s regions, respectively,assigned to the relaxation <strong>of</strong> the PMMA <strong>block</strong>s out <strong>of</strong> theFig. 5. Time dependence <strong>of</strong> the stress modulus for two MIMtri<strong>block</strong>s (samples 1 <strong>and</strong> 3, in Tab. 1)hard microdomains followed by the diffusion <strong>of</strong> the entirechains through the PIOA matrix. The relaxation <strong>of</strong> MIMcontaining two times shorter PMMA <strong>block</strong>s is quite reminiscent<strong>of</strong> that one commonly observed for monophase<strong>poly</strong>mers, so indicating that no microdomain structurepersists at 1308C.Dynamic frequency sweep experimentsFig. 6 illustrates how the complex viscosity <strong>of</strong> sample 2depends on the angular frequency. The complex viscosityat 1208C is clearly non-Newtonian, as is the case for vulcanizedrubber. A yield behavior starts to be observed at1808C, <strong>and</strong> a Newtonian behavior at low shear rate, aswell. The observation that the Newtonian behaviorbecomes more pronounced as the temperature isincreased beyond some limit, is the signature <strong>of</strong> the completerelaxation <strong>of</strong> the tri<strong>block</strong> chains at low angular frequencywhen T ODT <strong>of</strong> the <strong>block</strong> co<strong>poly</strong>mer isapproached 19) . Fig. 7 compares the plots <strong>of</strong> complex viscosityvs. angular frequency for a series <strong>of</strong> MIM tri<strong>block</strong>sat 1708C. As the PMMA molecular weight is increased,the non-Newtonian behavior is continuously more pronounced,as a result <strong>of</strong> increasingly more extended phaseseparation when the molecular weight 24) is increased.Fig. 8 compares the complex viscosity <strong>of</strong> MIM/MI binaryblend (sample 9, Tab. 1) <strong>and</strong> Kraton D1107. It mustbe noted that although the MIM/MI binary blend containsthe same di<strong>block</strong> content as the Kraton co<strong>poly</strong>mer, thecontent <strong>of</strong> the hard <strong>block</strong> (ca. 11.5 wt.-%) is smaller comparedto Kraton (ca. 15 wt.-%). Moreover, the molecularweight between chain entanglements (M e ) is 60000 forPIOA 6) much higher than the 6100 for PIP 2) . For these
<strong>Morphology</strong> <strong>and</strong> <strong>rheology</strong> <strong>of</strong> <strong>poly</strong>(<strong>methyl</strong> <strong>methacrylate</strong>) ... 1255Fig. 6. Plots <strong>of</strong> complex viscosity vs. angular frequency for theMIM sample 2Fig. 8. Plots <strong>of</strong> complex viscosity vs. angular frequency for theMIM/MI binary blend (sample 9, open symbols) <strong>and</strong> KratonD1107 (filled symbols)Fig. 7. Plots <strong>of</strong> complex viscosity vs. angular frequency for aseries <strong>of</strong> MIM tri<strong>block</strong>s (Tab. 1) at 1808Ctwo reasons, not only the shear modulus but also the complexviscosity are expected to be higher for the Kratonco<strong>poly</strong>mer than for the MIM/MI counterpart. This expectationis confirmed for the complex viscosity at 1508C athigh shear rates. However, as the temperature isincreased, the complex viscosity <strong>of</strong> sample 9 remainshigher compared to the Kraton sample in a larger range<strong>of</strong> shear rates, indicating more restricted relaxation <strong>and</strong>better persistence <strong>of</strong> the microdomain structures for theMIM co<strong>poly</strong>mer at high temperatures.Order-disorder transition temperatureAs long as the microdomains persist beyond T g <strong>of</strong>PMMA, they contribute to keeping the melt viscosityFig. 9. logG9 vs. logG99 for the MIM sample 1. The slope is 2at 1708C <strong>and</strong> 1808Chigh 26) , which is undesirable for the processing <strong>of</strong> theMIM co<strong>poly</strong>mers. Han <strong>and</strong> co-workers 27) have recentlyshown that rheological data can be used to determine theorder-disorder transition temperature, as illustrated inFig. 9, where logG9 is plotted vs. logG99 at different temperatures.According to these authors, the threshold temperatureat which the logG9 vs. logG99 plot becomes linear<strong>and</strong> the slope (<strong>of</strong> 2) becomes independent <strong>of</strong> temperatureis the signature <strong>of</strong> the order-disorder transition. Thisprediction is based on a rheological model suited tohomogeneous <strong>poly</strong>mers in the terminal zone (Eq. (1)):logG9 = 2logG99 – log(qRT/M e ) + log(p 2 /8) (1)
1256 J. D. Tong et al.MIM tri<strong>block</strong>s. Data for SIPS co<strong>poly</strong>mers are alsoreported from the scientific literature 19, 27, 28) . It is clearthat the T ODT <strong>of</strong> MIM tri<strong>block</strong>s is much higher than T ODT<strong>of</strong> the SIPS analogues, this might be a problem for theco<strong>poly</strong>mer processing, since the degradation temperature<strong>of</strong> the <strong>poly</strong>acrylate central <strong>block</strong> is only 2308C as measuredby TGA (58/min, N 2 ).Viscoelastic properties <strong>of</strong> <strong>poly</strong>styrene <strong>and</strong> <strong>poly</strong>(<strong>methyl</strong><strong>methacrylate</strong>) homo<strong>poly</strong>mersThe origin <strong>of</strong> the difference in T ODT <strong>of</strong> MIM <strong>and</strong> SIPSco<strong>poly</strong>mers might be found in the <strong>poly</strong>mer-<strong>poly</strong>mer interactionparameter, v ab , for the PMMA/PIOA <strong>and</strong> the PS/PIP pairs. The v ab value is commonly determined fromthe solubility parameter for each component at constantmolecular weight 24) :Fig. 10. logG9 vs. logG99 for the MIM sample 4Tab. 2. T ODT for MIM <strong>and</strong> SIS <strong>block</strong> co<strong>poly</strong>mers a)Sample M — n610 –3 Content <strong>of</strong>hard <strong>block</strong> inwt.-%T ODT /8CSIS-1 28) 7.4–99–7.4 11.4 180SIS-2 19) 10.6–125.4–10.6 14.5 280Kraton 10–120–10 + 14.3 230D1107 27) (15l18% di<strong>block</strong>)MIM-1 3.5–100–3.5 6.5 130–140MIM-2 5–140–5 6.6 200MIM-3 7–100–7 12.2 A200MIM-4 10–140–10 12.5 A200MIM-9 10–140–10 +(17% di<strong>block</strong>)11.5 A200a)Measured by Han’s method 18) .where q is the <strong>poly</strong>mer density, R the gas constant, T theabsolute temperature <strong>and</strong> M e the molecular weightbetween chain entanglements. Fig. 9 shows that plots <strong>of</strong>logG9 vs. logG99 for the MIM sample 1 (Tab. 1) are notlinear (data collected from frequency sweep experiments)below 130–1408C, particularly at higher frequency(upper part <strong>of</strong> the curves). As the temperature exceeds130–1408C, the logG9 vs. logG99 curve is linear with aslope <strong>of</strong> 2, so indicating that T ODT lies in this temperaturerange, at least in the range <strong>of</strong> the investigated frequencies(0.1l15.9 Hz). Fig. 10 illustrates the same relationshipfor the MIM sample 4, which contains more PMMA (12wt.-%) <strong>of</strong> higher molecular weight (7000) although preservingthe same spherical morphology. Plots <strong>of</strong> logG9vs. logG99 are far from linearity <strong>and</strong> superposition, indicatingthat T ODT is well beyond the range <strong>of</strong> the investigatedtemperatures (150–2008C). Tab. 2 lists the values<strong>of</strong> T ODT , as determined by Han’s method for a series <strong>of</strong>v ab = M a (d a –d b ) 2 /q a RTwhere M a the is molecular weight <strong>of</strong> component a; d a <strong>and</strong>d b are the solubility parameters <strong>of</strong> components a <strong>and</strong> b; q ais the density <strong>of</strong> component a. The solubility parametersfor PMMA, <strong>poly</strong>(alkyl acrylates) (e.g. ethyl, propyl,butyl), PS, <strong>and</strong> PIP are 18.6, 18.0l19.8, 19.0, <strong>and</strong>16l17 (J/cm 3 ) 1/2, 29) respectively. Thus, d a –d b for thePMMA/PIOA pair is expected to be smaller than for thePS/PIP pair, although the exact value <strong>of</strong> d for PIOA isunknown. The smaller <strong>poly</strong>mer-<strong>poly</strong>mer interaction parameterfor the PMMA/PIOA pair compared to the PS/PIPpair is thus in favor <strong>of</strong> a lower degree <strong>of</strong> immiscibility<strong>and</strong> thus a lower order-disorder transition temperature forthe MIM co<strong>poly</strong>mers, which completely disagrees withthe experimental observations.The physico-mechanical characteristics <strong>of</strong> the hard<strong>block</strong>s may not be ignored when the melt processing <strong>of</strong>the tri<strong>block</strong> TPEs are concerned. Although the volume<strong>and</strong> molecular weight <strong>of</strong> the monomer units <strong>and</strong> T g arecomparable for PMMA <strong>and</strong> PS, these two <strong>poly</strong>mers havequite a different behavior in solution <strong>and</strong> in the melt. Forexample, Tab. 3 shows that M e for PS is roughly threetimes as large as M e for PMMA <strong>and</strong> that the viscoelasticcoefficients extracted from the WLF equation are alsodifferent 30 – 35) . The viscoelastic characteristics for PMMA<strong>and</strong> PS (Tab. 3) have been reported for samples preparedby free-radical <strong>poly</strong>merization, thus for samples <strong>of</strong> verybroad molecular weight distribution, which might explainthe dispersion <strong>of</strong> some rheological properties dependingon their origin. In order to improve the accuracy <strong>of</strong> theM e values, PMMA (M — n: 5000 to 80000) <strong>and</strong> PS (M — n:10000) homo<strong>poly</strong>mers have been prepared, in this study,by anionic <strong>poly</strong>merization, so making samples <strong>of</strong> verynarrow molecular weight distribution (a1.1) available.M e for PMMA has been found to be 6000, consistent withthe previously reported data 30) . Tab. 4 provides the zero-
<strong>Morphology</strong> <strong>and</strong> <strong>rheology</strong> <strong>of</strong> <strong>poly</strong>(<strong>methyl</strong> <strong>methacrylate</strong>) ... 1257Tab. 3. Viscoelastic characteristics for PMMA <strong>and</strong> PS a)Sample G 0 N 6105PaM eg=molb†M cg=molc) c†C 1 C 2CPMMA 6.57 4 700l9 200 17 600l27 500 9.0 13.4PS 1.99 17 300l18 700 31 200l32 800 35.5 55a)Data from refs. 30–35)b)Critical molecular weight at which the molecular weight (M)dependence <strong>of</strong> g 0 changes from g 0 = KM (M a Mc) to g 0 =K9M 3.4 (M A Mc). g 0 is the zero-shear viscosity defined as g 0 =lim xe0 (G99/x), with x the shear rate <strong>and</strong> G99 the shear lossmodulus.c)Coefficients <strong>of</strong> the WLF equation, –loga T = C 1 (T–T 0 )/(C 2 +T–T 0 )Tab. 4.Zero-shear viscosity for PMMA <strong>and</strong> PS at 1708Ca)1808C.b)1838C 36) .Sample M — n <strong>and</strong> (M — w/M — n) g 0 /(Pa N s)PMMA 5000 (1.10) 1800PMMA 8000 (1.07) 3700PMMA 10000 (1.05) 7000PMMA 20000 (1.04) 80000 a)PS 10000 (1.10) 44PS 48500 (1.10) 1500 b)shear viscosity (g 0 ) measured at 1708C for these PMMA<strong>and</strong> PS samples. The experimental viscosity for PMMA<strong>of</strong> 10000 MW is more than 150 times larger compared toPS <strong>of</strong> the same MW. Even when the PMMA MW is halfthat <strong>of</strong> the PS, so leading to comparable T g ’s, the g 0 valuefor PMMA is still 40 times as large as for PS. Fig. 11compares the plots <strong>of</strong> complex viscosity vs. angular frequencyfor PS (Fig. 11a) <strong>and</strong> PMMA (Fig. 11b) <strong>of</strong> 10000MW (thus the same MW as the PS <strong>block</strong> <strong>of</strong> KratonD1107 <strong>and</strong> the PMMA <strong>block</strong> <strong>of</strong> MIM (sample 4)). ForPMMA to have the same melt viscosity as PS, it must beheated at least 408C higher than PS.The much higher zero-shear viscosity <strong>and</strong> lower M eindicate that PMMA is less prone to flow than PS, whichmight explain why the MIM tri<strong>block</strong>s have to be processedat higher temperature than the SIPS analogues,consistent with a higher order-disorder transition temperature.Thus, although the T ODT can be theoretically predicted15) from the <strong>poly</strong>mer-<strong>poly</strong>mer interaction parameter<strong>and</strong> the <strong>block</strong> co<strong>poly</strong>mer composition, the occurrence <strong>of</strong>this transition in MIM is much delayed by unfavorablekinetic parameters.ConclusionFig. 11. Plot <strong>of</strong> melt viscosity vs. angular frequency for: (a)10000 PS; (b) 10000 PMMAThe phase morphology <strong>of</strong> <strong>poly</strong>(<strong>methyl</strong> <strong>methacrylate</strong>)-<strong>block</strong>-<strong>poly</strong>(isooctyl acrylate)-<strong>block</strong>-<strong>poly</strong>(<strong>methyl</strong> <strong>methacrylate</strong>)tri<strong>block</strong> co<strong>poly</strong>mers has been studied by atomicforce microscopy with phase detection imaging. Spherical,cylindrical, <strong>and</strong> lamellar morphologies have beenobserved for <strong>block</strong> co<strong>poly</strong>mers <strong>of</strong> increasing PMMA content.These co<strong>poly</strong>mers exhibit a behavior typical <strong>of</strong> thermoplasticelastomers only when the PMMA molecularweight is small (3500 <strong>and</strong> 5000). Otherwise, the microdomainstructure <strong>of</strong> the MIM tri<strong>block</strong>s persists beyondthe glass transition temperature <strong>of</strong> PMMA. The muchhigher experimental T ODT for MIMs compared to the SIPSanalogues is not <strong>of</strong> thermodynamic origin but rather dueto kinetic factors in relation to the high zero-shear viscosity<strong>and</strong> low M e for the outer PMMA <strong>block</strong>s.
1258 J. D. Tong et al.Acknowledgements: The authors are grateful to the “ServicesFédéraux des Affaires Scientifiques, Techniques et Culturelles”for general support in the frame <strong>of</strong> the “PAI 4/11: SupramolecularChemistry <strong>and</strong> Supramolecular Catalysis”. Research inMons is also partly supported by the European Commission <strong>and</strong>the Government <strong>of</strong> the Région Wallonne (Project NOMAPOL-Objectif 1-Hainaut), <strong>and</strong> the Belgian National Fund for ScientificResearch FNRS/FRFC. RL is “Maître de Recherche” by the“Fonds National de la Recherche Scientifique” (FNRS).1) R. Jérôme, J. D. Tong, Current Opinion in Solid State <strong>and</strong>Materials Science 3, 573 (1998)2) R. Jérôme, Ph. Bayard, R. Fayt, Ch. Jacobs, S. Varshney, Ph.Teyssié, in: Thermoplastic Elastomers, 2 nd edition, G. Holden,N. R. Legge, R. Quirk, H. E. Schroeder, Eds., Hanser:Munich, Vienna, New York 1999, p. 5213) Y. Yu, Ph. Dubois, R. Jérôme, Ph. Teyssié, Macromolecules29, 1753 <strong>and</strong> 2738 (1996)4) J. M. G. Cowie, R. Ferguson, M. D. Fern<strong>and</strong>ez, M. J. Fern<strong>and</strong>ez,I. J. McEwen, Macromolecules 25, 3170 (1992)5) J. D. Tong, R. Jérôme, submitted for publication6) S. N. Magonov, M.-H. Whangbo, “Surface Analysis withSTM <strong>and</strong> AFM: Experimental <strong>and</strong> Theoretical Aspects <strong>of</strong>Image Analysis”, VCH, Weinheim 1996, p. 397) R. Soltani, F. Laupretre, L. Monnerie, Ph. Teyssié, Polymer39, 3297 (1998)8) Ph. Leclère, R. Lazzaroni, G. Moineau, M. Minet, Ph.Dubois, J. L. Brédas, R. Jérôme, submitted for publication9) M. A. van Dijk, R. van den Berg, Macromolecules 28,6773(1995)10) G. Bar, Y. Thomman, R. Br<strong>and</strong>sch, H. J. Cantow, M. H.Whangbo, Langmuir 13, 3807 (1997); S. N. Magonov, V.Elings, W. H. Whangbo, Surf. Sci. Lett. 375, L385 (1997); N.A. Burnham, O. P. Behrend, F. Oulevey, G. Gremaud, P.-J.Gallo, D. Gourdon, E. Dupas, A. J. Kulik, H. M. Pollock, G.A. D. Briggs, Nanotechnology 8, 67 (1997)11) B. R. M. Gallot, Adv. Polym. Sci. 29, 85(1978)12) G. Holden, N. R. Legge, in: Thermoplastic Elastomers, N. R.Legge, G. Holden, H. E. Schroeder, Eds., Hanser: Munich,Vienna, New York, 1987, p. 4713) D. J. Meier, J. Polym. Sci., Part C 26, 81 (1969)14) E. Helf<strong>and</strong>, Z. R. Wasserman, Macromolecules 9, 879 (1976)15) L. Leibler, Macromolecules 13, 1062 (1980)16) F. S. Bates, G. H. Fredrickson, in: Thermoplastic Elastomers,2 nd ed., G. Holden, N. R. Legge, R. Quirk, H. E. Schroeder,Eds., Hanser: Munich, Vienna, New York, 1996, p. 33517) T. Hashimoto, in: Thermoplastic Elastomers, 2 nd ed., G. Holden,N. R. Legge, R. Quirk, H. E. Schroeder, Eds., Hanser:Munich, Vienna, New York, 1996, p. 42918) C. D. Han, D. M. Baek, J. K. Kim, T. Ogawa, N. Sakamoto,T. Hashimoto, Macromolecules 28, 5043 (1995)19) C. A. Berglund, K. W. Mckay, Polym. Eng. Sci. 33, 1195(1993)20) K. I. Winey, D. S. Gobran, Z. Xu, L. J. Fetters, E. L. Thomas,Macromolecules 27, 2392 (1994)21) C. I. Chung, M. I. Lin, J. Polym. Sci., Polym. Phys. Ed. 16,545 (1978)22) F. S. Bates, Macromolecules 17, 2607(1984)23) M. D. Gehlsen, F. S. Bates, Macromolecules 26, 4122 (1993)24) R. F. Fedos, J. Polym. Sci., Part C 26, 189(1969)25) H. Morawetz, Macromolecules in Solution, Wiley-Interscience:New York 1961, p. 4126) E. V. Gouinlock, R. S. Porter, Polym. Eng. Sci. 17, 534(1977)27) C. D. Han, J. Kim, J. Polym. Sci., Part B 25, 1741 (1987)28) C. D. Han, D. M. Baek, J. K. Kim, Macromolecules 23, 561(1990)29) D. W. Van Krevelen, Properties <strong>of</strong> Polymers, 3 rd Edition,Elsevier: Amsterdam, Oxford, New York, Tokyo 1990,p. 79030) W. M. Graessley, Adv. Polym. Sci. 16, 55 (1974)31) J. L. Halary, A. K. Oultache, J. F. Louyot, B. Jasse, T. Sarraf,R. Muller, J. Polym. Sci., Part B 29, 933 (1991)32) T. Masuda, K. Kitagawa, S. Onogi, Polym. J. 4, 418(1970)33) D. J. Plazek, V. Tan, V. H. O’Rourke, Rheol. Acta 13, 367(1974)34) D. J. Plazek, E. Ri<strong>and</strong>e, H. Markovitz, N. Ragupathi, J.Polym. Sci., Polym. Phys. Ed. 17, 2189 (1979)35) S. Wu, J. Polym. Sci., Polym. Phys. Ed. 27, 723 (1989)36) R. A. J. Stratton, Coll. Interf. Sci. 22, 517 (1966)