PolicyLinkdensity <strong>and</strong> therefore purchasing power of urbanneighborhoods. Alternative market studies that uselocal data sources often find that population <strong>and</strong>purchasing power in low-income communities of coloris significantly higher than figures given by traditionalmarket analyses. A study of two Washing<strong>to</strong>n, DCneighborhoods by Social Compact, for example, foundthat census figures underestimated the populationof the Columbia Heights-Petworth neighborhoodby as much as 55 percent <strong>and</strong> of the Anacostia-Hillcrest neighborhood by as much as 13 percent. 57In deciding where <strong>to</strong> open new s<strong>to</strong>res, retailers alsorely on private marketing firms’ characterization oflow-income communities of color, <strong>and</strong> this has alsobeen a problem. These firms use demographic <strong>and</strong>consumer spending data <strong>to</strong> categorize communitiesin<strong>to</strong> pre-established “neighborhood types” rankedby investment potential. These neighborhood typeswith short names like “Difficult Times” draw onracial <strong>and</strong> class-based stereotypes. For example, onefirm describes the residents of northside AfricanAmerican neighborhoods in Milwaukee as “verylow income families [who] buy video games, dine atfast food chicken restaurants, use non-prescriptioncough syrup, <strong>and</strong> use laundries <strong>and</strong> laundromats.”The same company describes the residents ofthe suburban, white North Shore communityas “interested in civic activities, volunteer work,contributions, <strong>and</strong> travel.” 58 These descriptions areextremely subjective <strong>and</strong> are not accurate portrayalsof the business potential of low-income communitiesof color. They can steer business decision makersaway from locating in these communities, evenwhen there are actually significant opportunities.It is possible <strong>to</strong> achieve win-win solutions forbusinesses <strong>and</strong> communities—a double bot<strong>to</strong>mlineof financial return <strong>and</strong> community benefit.With a realistic evaluation of potential for successin underserved communities—driven by accuratedata <strong>and</strong> not clouded by racial stereotypes <strong>and</strong>assumptions—food retailers can identify <strong>and</strong> takeadvantage of opportunities in untapped markets. Forexample, Pathmark <strong>and</strong> Super S<strong>to</strong>p & Shop—twoleading grocery s<strong>to</strong>re chains in the Northeast—Rural Communities: Limited <strong>Food</strong> <strong>Access</strong> in a L<strong>and</strong> of PlentyAlthough much research has been done on food access in inner-city communities, less is unders<strong>to</strong>od about the food accessproblems faced by rural communities. Existing studies suggests that despite their proximity <strong>to</strong> some of the most productiveagricultural areas in the world, many rural residents have little access <strong>to</strong> fresh, healthy foods. 61 The rural poor have limitedaccess <strong>to</strong> supermarkets, <strong>and</strong> even when they do reach supermarkets, they face prices that are about 4 percent higherthan those charged by suburban s<strong>to</strong>res. 62 And while rural households generally have access <strong>to</strong> cars, those that do not areparticularly burdened given the lack of public transportation options in rural areas. Many rural farmworkers, for example,have limited access <strong>to</strong> cars, <strong>and</strong> therefore have little mobility <strong>to</strong> reach s<strong>to</strong>res beyond their immediate neighborhoods. 63Some of the promising strategies <strong>and</strong> policy options for improving access <strong>to</strong> healthy food outlined in this report are alsorelevant for rural underserved communities. Community organizations have successfully brought supermarkets <strong>to</strong> lowincomerural areas. Dineh Cooperatives Incorporated, a community development corporation on the Navajo Nation, built aBasha’s Market in rural Chinle, Arizona that created over 170 jobs for local residents. The s<strong>to</strong>re has been profitable since itsopening <strong>and</strong> has been exp<strong>and</strong>ed four times. 64 For resources on rural grocery s<strong>to</strong>re strategies, see Kansas State University’sRural Grocery Initiative page at www.ruralgrocery.org.Other types of food retailers also show promise. The Selma Flea Market in rural Fresno County, California was the first fleamarket in the nation <strong>to</strong> accept Electronic Benefit Transfer cards (food stamps) for purchasing fresh fruits <strong>and</strong> vegetables. 65Other potential strategies for rural areas include: improved public transportation <strong>to</strong> s<strong>to</strong>res selling healthy food; communitysupported agriculture; mobile markets; farmers’ markets organized by hospitals or other institutions or businesses; <strong>and</strong>farm-<strong>to</strong>-school programs.20 <strong>Healthy</strong> <strong>Food</strong>, <strong>Healthy</strong> Communities
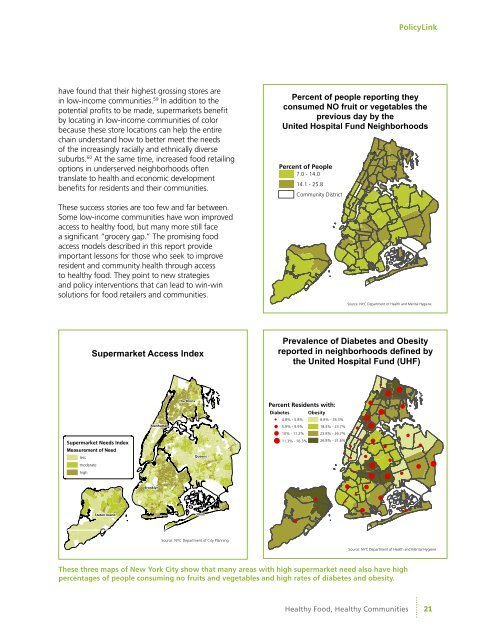
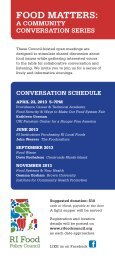
PolicyLinkhave found that their highest grossing s<strong>to</strong>res arein low-income communities. 59 In addition <strong>to</strong> thepotential profits <strong>to</strong> be made, supermarkets benefitby locating in low-income communities of colorbecause these s<strong>to</strong>re locations can help the entirechain underst<strong>and</strong> how <strong>to</strong> better meet the needsof the increasingly racially <strong>and</strong> ethnically diversesuburbs. 60 At the same time, increased food retailingoptions in underserved neighborhoods oftentranslate <strong>to</strong> health <strong>and</strong> economic developmentbenefits for residents <strong>and</strong> their communities.These success s<strong>to</strong>ries are <strong>to</strong>o few <strong>and</strong> far between.Some low-income communities have won improvedaccess <strong>to</strong> healthy food, but many more still facea significant “grocery gap.” The promising foodaccess models described in this report provideimportant lessons for those who seek <strong>to</strong> improveresident <strong>and</strong> community health through access<strong>to</strong> healthy food. They point <strong>to</strong> new strategies<strong>and</strong> policy interventions that can lead <strong>to</strong> win-winsolutions for food retailers <strong>and</strong> communities.Percent of people reporting theyconsumed NO fruit or vegetables theprevious day by theUnited Hospital Fund NeighborhoodsPercent of People7.0 - 14.014.1 - 25.8Community DistrictSource: NYC Department of Health <strong>and</strong> Mental HygieneSupermarket <strong>Access</strong> IndexPrevalence of Diabetes <strong>and</strong> Obesityreported in neighborhoods defined bythe United Hospital Fund (UHF)ManhattanThe BronxPercent Residents with:Diabetes Obesity4.8% - 5.8% 8.8% - 18.3%5.9% - 9.9% 18.4% - 23.7%10% - 11.2% 23.8% - 26.7%11.3% - 18.3% 26.8% - 31.6%QueensBrooklynStaten Isl<strong>and</strong>QueensSource: NYC Department of City PlanningSource: NYC Department of Health <strong>and</strong> Mental HygieneThese three maps of New York City show that many areas with high supermarket need also have highpercentages of people consuming no fruits <strong>and</strong> vegetables <strong>and</strong> high rates of diabetes <strong>and</strong> obesity.<strong>Healthy</strong> <strong>Food</strong>, <strong>Healthy</strong> Communities21