Turning Sri Lanka's Urban Vision into Policy and Action - UN HABITAT
Turning Sri Lanka's Urban Vision into Policy and Action - UN HABITAT
Turning Sri Lanka's Urban Vision into Policy and Action - UN HABITAT
Create successful ePaper yourself
Turn your PDF publications into a flip-book with our unique Google optimized e-Paper software.
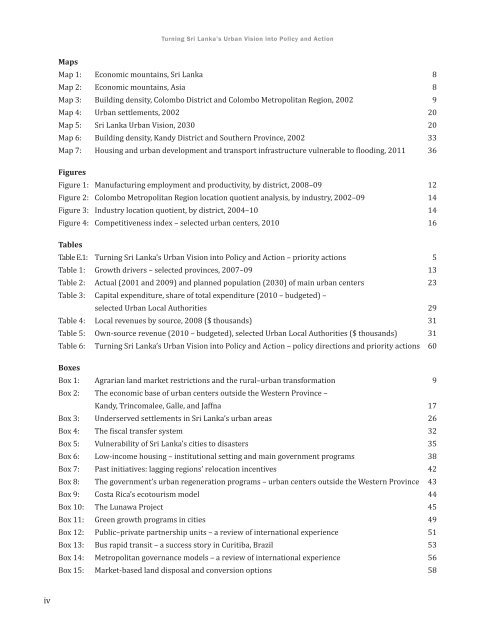
<strong>Turning</strong> <strong>Sri</strong> Lanka’s <strong>Urban</strong> <strong>Vision</strong> <strong>into</strong> <strong>Policy</strong> <strong>and</strong> <strong>Action</strong>MapsMap 1: Economic mountains, <strong>Sri</strong> Lanka 8Map 2: Economic mountains, Asia 8Map 3: Building density, Colombo District <strong>and</strong> Colombo Metropolitan Region, 2002 9Map 4: <strong>Urban</strong> settlements, 2002 20Map 5: <strong>Sri</strong> Lanka <strong>Urban</strong> <strong>Vision</strong>, 2030 20Map 6: Building density, K<strong>and</strong>y District <strong>and</strong> Southern Province, 2002 33Map 7: Housing <strong>and</strong> urban development <strong>and</strong> transport infrastructure vulnerable to flooding, 2011 36FiguresFigure 1: Manufacturing employment <strong>and</strong> productivity, by district, 2008–09 12Figure 2: Colombo Metropolitan Region location quotient analysis, by industry, 2002–09 14Figure 3: Industry location quotient, by district, 2004–10 14Figure 4: Competitiveness index – selected urban centers, 2010 16TablesTable E.1: <strong>Turning</strong> <strong>Sri</strong> Lanka’s <strong>Urban</strong> <strong>Vision</strong> <strong>into</strong> <strong>Policy</strong> <strong>and</strong> <strong>Action</strong> – priority actions 5Table 1: Growth drivers – selected provinces, 2007–09 13Table 2: Actual (2001 <strong>and</strong> 2009) <strong>and</strong> planned population (2030) of main urban centers 23Table 3: Capital expenditure, share of total expenditure (2010 – budgeted) –selected <strong>Urban</strong> Local Authorities 29Table 4: Local revenues by source, 2008 ($ thous<strong>and</strong>s) 31Table 5: Own-source revenue (2010 – budgeted), selected <strong>Urban</strong> Local Authorities ($ thous<strong>and</strong>s) 31Table 6: <strong>Turning</strong> <strong>Sri</strong> Lanka’s <strong>Urban</strong> <strong>Vision</strong> <strong>into</strong> <strong>Policy</strong> <strong>and</strong> <strong>Action</strong> – policy directions <strong>and</strong> priority actions 60BoxesBox 1: Agrarian l<strong>and</strong> market restrictions <strong>and</strong> the rural–urban transformation 9Box 2: The economic base of urban centers outside the Western Province –K<strong>and</strong>y, Trincomalee, Galle, <strong>and</strong> Jaffna 17Box 3: Underserved settlements in <strong>Sri</strong> Lanka’s urban areas 26Box 4: The fiscal transfer system 32Box 5: Vulnerability of <strong>Sri</strong> Lanka’s cities to disasters 35Box 6: Low-income housing – institutional setting <strong>and</strong> main government programs 38Box 7: Past initiatives: lagging regions’ relocation incentives 42Box 8: The government’s urban regeneration programs – urban centers outside the Western Province 43Box 9: Costa Rica’s ecotourism model 44Box 10: The Lunawa Project 45Box 11: Green growth programs in cities 49Box 12: Public–private partnership units – a review of international experience 51Box 13: Bus rapid transit – a success story in Curitiba, Brazil 53Box 14: Metropolitan governance models – a review of international experience 56Box 15: Market-based l<strong>and</strong> disposal <strong>and</strong> conversion options 58iv


