NEELI COMMUNITY - AP Online
NEELI COMMUNITY - AP Online
NEELI COMMUNITY - AP Online
Create successful ePaper yourself
Turn your PDF publications into a flip-book with our unique Google optimized e-Paper software.
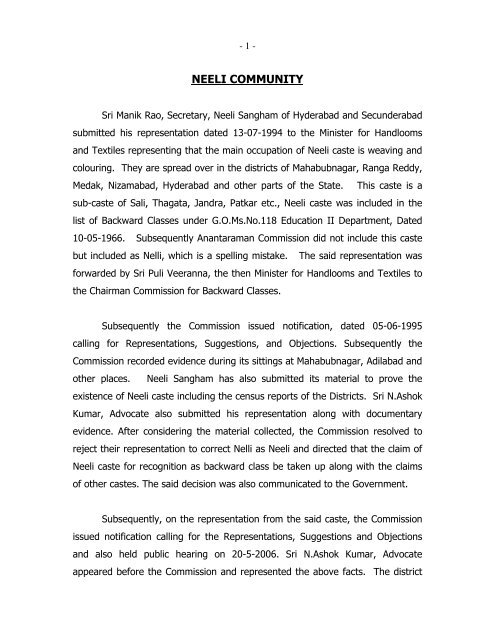
- 1 -<strong>NEELI</strong> <strong>COMMUNITY</strong>Sri Manik Rao, Secretary, Neeli Sangham of Hyderabad and Secunderabadsubmitted his representation dated 13-07-1994 to the Minister for Handloomsand Textiles representing that the main occupation of Neeli caste is weaving andcolouring. They are spread over in the districts of Mahabubnagar, Ranga Reddy,Medak, Nizamabad, Hyderabad and other parts of the State. This caste is asub-caste of Sali, Thagata, Jandra, Patkar etc., Neeli caste was included in thelist of Backward Classes under G.O.Ms.No.118 Education II Department, Dated10-05-1966. Subsequently Anantaraman Commission did not include this castebut included as Nelli, which is a spelling mistake. The said representation wasforwarded by Sri Puli Veeranna, the then Minister for Handlooms and Textiles tothe Chairman Commission for Backward Classes.Subsequently the Commission issued notification, dated 05-06-1995calling for Representations, Suggestions, and Objections. Subsequently theCommission recorded evidence during its sittings at Mahabubnagar, Adilabad andother places. Neeli Sangham has also submitted its material to prove theexistence of Neeli caste including the census reports of the Districts. Sri N.AshokKumar, Advocate also submitted his representation along with documentaryevidence. After considering the material collected, the Commission resolved toreject their representation to correct Nelli as Neeli and directed that the claim ofNeeli caste for recognition as backward class be taken up along with the claimsof other castes. The said decision was also communicated to the Government.Subsequently, on the representation from the said caste, the Commissionissued notification calling for the Representations, Suggestions and Objectionsand also held public hearing on 20-5-2006. Sri N.Ashok Kumar, Advocateappeared before the Commission and represented the above facts. The district
- 2 -gazette and the government orders from time to time produced by them wouldamply prove that Neeli caste is engaged in weaving and dyeing. This caste wasrecognized and found in the list of Backward Classes in the year 1953 and 1966.Subsequently the Anantaraman Commission included Nelly caste underGroup – D at S. No 22. On the representation of Neeli community, thisCommission examined and collected evidence extensively.The Commission formulated a format, which was adopted by the surveyteam. The Commission personally visited the places of their habitation and alsodeputed a survey team to conduct socio-economic household sample survey andthe survey team visited Hyderabad, Nizamabad and Medak Districts to conducthousehold sample survey and the survey results are as follows:Survey Results1. IntroductionThe survey staff of the Commission conducted Local enquiries andInvestigations including door-to-door household sample survey during June, July,& Aug of 2007 in Hyderabad, Nizamabad & Medak districts. The samplehousehold Survey covered 85 Households of this community. The traditionaloccupation of this community is Coloring & Weaving.2. Social StatusAll the 85 Households comprising 386 persons are living in rural 53% andUrban 47% with house holds size 4.54. The sex ratio of the community is 91Female per 100 Male so also the same for the age group up to 14 years is 98.
- 3 -Results on Traditional Occupation (T.O.)Item Remarks No ofHouseholdsa) Traditional occupation in Yes9practiceNo76b) Feeling of the caste people Superior0on Traditional Occupation Inferior9Normal76c) T.O treated by others Superior0Inferior10Normal75d) Social discrimination YesNoNormal72256Percentage10.689.40.010.689.40.011.088.28.225.965.9About 11 % of Households are attending to their Traditional Occupation,about 11 % of Households feeling inferior of their occupation, about 12 % ofhouseholds reported that their occupation treated inferior by others, about 8 %of households are socially discriminated by others in their locality.3. Educational Statusa) Sex wise literates and illiterates:(7 years & above)Sl. No Description Male Female Total1 Literates No%16588.210765.227277.52 Illiterates No%2211.85734.87922.5The Male literacy rate of the Community is 88.2, Female 65.2 and total77.5 as against the State Literacy rate 70.32, 50.43 and 60.47 respectively. Theliteracy rate of the community is above the state literacy rate.
- 4 -b) Educational level completed (7 years & above)Sl.No. Class Passed No.ofPercentage overpersons Population Literates1 Below 5 th 34 9.7 12.52 5 th class 31 8.8 11.43 7 th class 55 15.7 20.24 10 th class 61 17.4 22.45 Inter 48 13.7 17.76 Degree 30 8.5 11.07 P.Gr. 7 2.0 2.68 Pro.Tech. 6 1.7 2.2All Classes 271 77.5 100.0The education level completed upto 10 th Class passed is 51.6 %, the Post-Metric passed 25.9 % put together 77.5 % literacy rate of the Community.c) Literates and dropouts (7 years and above)Sl.No.AgeGroupPopulationTotalLiteratesPercentage ofLiteratesAmong OverAge TotalGroup Pop.DropoutsPercent ofdropoutsOverPersonsOverLiterates1 7-14 52 48 92.3 13.7 4 7.7 8.32 15-24 97 86 88.7 24.5 34 35.1 39.53 25-39 104 82 78.8 23.4 62 15.6 75.64 40-59 73 40 54.8 11.4 38 52.1 95.05 60+ 25 15 60.0 4.3 10 40.0 66.7All 351 271 77.3 148 42.2 54.6The dropout rate of the community over literates is 54.6 % and dropoutrate of age group 7-14 years is 7.7 % over population or 8.3 % over literates.
- 5 -d) Drop-outs from School/College studies with reasons (All-ages)Sl.No. Reason for Dropouts No. of Persons Dropout Rate Percentage.over pop.1 Failed 12 7.74 3.112 Education not required 14 9.03 3.633 Marriage 32 20.65 8.294 To work 55 35.48 14.255 Poverty 33 21.29 8.556 Health & others 9 5.81 2.33All 155 100.0 40.164. Employment StatusThe entire surveyed population of ‘Neeli’ community basing on theireconomic activity is divided into Working group and Non Working group. TheWorking group of people is consisting of Daily wage earners, Self-employed,Regular salaried and part-time workers. So also the Non-Working group of peopleconsisting of children, students, aged, retired, ill health, unemployed, housewives,and households.a) Working and Non-Working groups of people by sex is as follows.WorkersNon-WorkersMale Female Total Male Female TotalNumber 110 43 153 92 141 233PercentageOver total54.5 23.4 39.6 45.5 76.6 60.4It is noticed that the Male workers constitute 54.5 whereas Female is 23.4as against the total working percentage of 39.6 as against the State workparticipation rates 56.23, 35.11, 45.80 respectively. The work participation ratesof Male & Female are seen below the state work rates.
- 6 -b) Statement showing Economic activity among working people.S. No Economic activity Sex Number Percent toTotal pop.1 Daily wage in Agri. Male 10 5.0Female 4 2.2Total 14 3.62 Daily wage in Non Agri. MaleFemaleTotal3 Self employed in Agri MaleFemaleTotal4 Self employed in Non-Agri MaleFemaleTotal5 Regular salaried in Govt MaleFemaleTotal6 Regular salaried in Pvt. MaleFemaleTotal7 Part time workers MaleFemaleTotal135184154016561801822325314176.42.74.62.00.51.319.88.714.58.90.04.710.91.66.51.57.64.4Percent toWorkers-Population9.19.39.211.811.611.73.62.33.336.437.236.616.40.011.420.07.016.32.732.611.1Grand Total 153 39.6 100.0The working population of the community is distributed among the aboveeconomic activities. The higher workforce of the community is engaged in ‘Selfemployed in Non-agriculture’ i.e., 14.5 % over population or 36.6 % overworkers. About 5 % of workers over population are employed in regular salariedin Govt. services and about 6.5 % in private sector.
- 7 -5. Economic statusDescriptionNo.ofHouseholdsPercentage over hhs.a) Possessing Agrl. Land 20 23.5b) Type of House (residing)i) Puccaii) Semi puccaiii) Kutcha/Huts3445640.052.97.1c) Having Ration cards:i) Whiteii) Pinkiii) No cardd) Facilities/Amenities:i) Phone – Having connectedNot having Phoneii) Drinking water in the –premises of householdsiii) Electricity connectioniv) Toilet within the premisesYesNoYesYesNov) Percapita income =...Per Annum Rs.12, 320/-vi) Avg. Land holding =... Acres. 0.45 Acres.No6222143425926814513472.925.91.250.649.469.430.695.34.760.040.0About 23.5 % of households are possessing agriculture lands with averageland holding is 0.45 acres. About 73 % of Households having white ration cares,about 49.4 % of households without Telephone connected, and about 40 % ofHouseholds with latrine facility within their house premises.The Per capita Income of the Community is Rs.12,320/- p.a as against theState Per capita Income of Rs.25,695/-
- 8 -Though the literacy rate is more than the State average, dropouts aremore. About 73% of households are having white ration cards. Their percapita income is at Rs.12,320/- as against the State per capita income ofRs.25,695/-. They are not politically represented and their employment ingovernment services is very low, to some extent they are segregated and lookeddown by others.Edgar Thurston and People of India Series also referred to this caste.The word Neeli means blue color. Some of them migrated from Andhra Pradeshto Maharastra and distributed in Aurangabad, Sholapur and Bombay districts.The Neeli people are mostly engaged in largely handloom units and weavingcloth on contract basis. Master weavers supply them with raw materials forweaving cloth on contract basis. They are also engaged in dyeing and printing.People of India, National Series Volume VI, and India’s Communities byK.S.Singh referred at page 2625 Neeli Community as follows:“The word Neeli meaning blue color. Their main occupation is dyeing.The Neeli are mostly engaged in larger handloom units and weaving cloth oncontract basis. Most weavers supply them with raw materials for weaving thecloth on contract basis. They are also engaged in dyeing and printing’’.The caste representatives produced clinching evidence that Neeli castewas recognized as a backward class long ago. They produced Government ofHyderabad Gazette dated 11-06-1953 to which G.O. No.10 Revenue DepartmentGovernment Order dated 30-05-1953 wherein the list of Backward Classes arementioned and at S. No. 77 Neeli caste was declared as backward class inHyderabad state out of 129 in the list. Subsequently for the purpose of admissionto the integrated MBBS course in the medical colleges in the Telangana area forthe academic year 1963-64 G.O.Ms No. 1885 Health, Housing and Municipal
- 9 -Administration Department dated 21-06-1963 recognized Neeli caste as abackward class and included at S. No. 37. Kaka Kalerkar Commission appointedby the Government of India recommended Neeli caste for inclusion in the list ofBackward Classes. Subsequently when G.O.Ms No. 1880 Education (II)Department dated 29-07-1966 when the list was prepared with regard toBackward Classes the caste Nelli at S.No. 60 Anantharaman Commission foundNelli caste in Adilabad district only. Subsequently when Annu Rao, Professor T.V.Hanurav conducted survey on behalf of Indian Statistical Institute Hyderabad hefound Nelli people were in four districts. The representatives of the casterepresented that it is a spelling mistake that occur for Nelli as Neeli. The NationalCommission accepted the plea and corrected as Neeli in the OBCs list. From theabove facts it is evident that the caste is called as Neeli, which was wrongly speltas Nelli.Taking into consideration of the written and oral representations, thesurvey report and other materials collected by the Commission including thedistrict gazettes, this Commission come to the conclusion that Neeli caste peopleare socially and educationally backward for the purpose of Articles 15(4) and16(4) of the constitution of the India fit to be included in the list of BackwardClasses under Group – B at S. No… Since this Commission found that there areno caste people such as Nelli in existence, the entry at 22 Nelli found in Group –D should be deleted from this list.


