Regional comparisons table (PDF, 79 KB) - Active NZ
Regional comparisons table (PDF, 79 KB) - Active NZ
Regional comparisons table (PDF, 79 KB) - Active NZ

You also want an ePaper? Increase the reach of your titles
YUMPU automatically turns print PDFs into web optimized ePapers that Google loves.
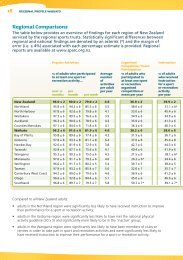
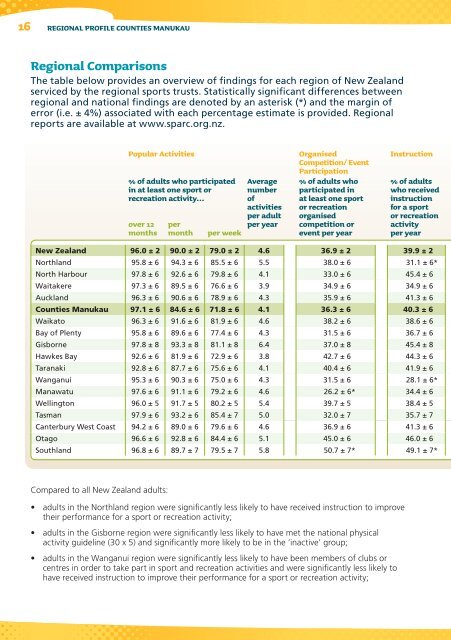
16REGIONAL PROFILE COUNTIES MANUKAU<strong>Regional</strong> ComparisonsThe <strong>table</strong> below provides an overview of findings for each region of New Zealandserviced by the regional sports trusts. Statistically significant differences betweenregional and national findings are denoted by an asterisk (*) and the margin oferror (i.e. ± 4%) associated with each percentage estimate is provided. <strong>Regional</strong>reports are available at www.sparc.org.nz.Popular Activities% of adults who participatedin at least one sport orrecreation activity...over 12monthspermonthper weekAveragenumberofactivitiesper adultper yearOrganisedCompetition/ EventParticipation% of adults whoparticipated inat least one sportor recreationorganisedcompetition orevent per yearInstruction% of adultswho receivedinstructionfor a sportor recreationactivityper yearNew Zealand 96.0 ± 2 90.0 ± 2 <strong>79</strong>.0 ± 2 4.6 36.9 ± 2 39.9 ± 2Northland 95.8 ± 6 94.3 ± 6 85.5 ± 6 5.5 38.0 ± 6 31.1 ± 6*North Harbour 97.8 ± 6 92.6 ± 6 <strong>79</strong>.8 ± 6 4.1 33.0 ± 6 45.4 ± 6Waitakere 97.3 ± 6 89.5 ± 6 76.6 ± 6 3.9 34.9 ± 6 34.9 ± 6Auckland 96.3 ± 6 90.6 ± 6 78.9 ± 6 4.3 35.9 ± 6 41.3 ± 6Counties Manukau 97.1 ± 6 84.6 ± 6 71.8 ± 6 4.1 36.3 ± 6 40.3 ± 6Waikato 96.3 ± 6 91.6 ± 6 81.9 ± 6 4.6 38.2 ± 6 38.6 ± 6Bay of Plenty 95.8 ± 6 89.6 ± 6 77.4 ± 6 4.3 31.5 ± 6 36.7 ± 6Gisborne 97.8 ± 8 93.3 ± 8 81.1 ± 8 6.4 37.0 ± 8 45.4 ± 8Hawkes Bay 92.6 ± 6 81.9 ± 6 72.9 ± 6 3.8 42.7 ± 6 44.3 ± 6Taranaki 92.8 ± 6 87.7 ± 6 75.6 ± 6 4.1 40.4 ± 6 41.9 ± 6Wanganui 95.3 ± 6 90.3 ± 6 75.0 ± 6 4.3 31.5 ± 6 28.1 ± 6*Manawatu 97.6 ± 6 91.1 ± 6 <strong>79</strong>.2 ± 6 4.6 26.2 ± 6* 34.4 ± 6Wellington 96.0 ± 5 91.7 ± 5 80.2 ± 5 5.4 39.7 ± 5 38.4 ± 5Tasman 97.9 ± 6 93.2 ± 6 85.4 ± 7 5.0 32.0 ± 7 35.7 ± 7Canterbury West Coast 94.2 ± 6 89.0 ± 6 <strong>79</strong>.6 ± 6 4.6 36.9 ± 6 41.3 ± 6Otago 96.6 ± 6 92.8 ± 6 84.4 ± 6 5.1 45.0 ± 6 46.0 ± 6Southland 96.8 ± 6 89.7 ± 7 <strong>79</strong>.5 ± 7 5.8 50.7 ± 7* 49.1 ± 7*Compared to all New Zealand adults:• adults in the Northland region were significantly less likely to have received instruction to improvetheir performance for a sport or recreation activity;• adults in the Gisborne region were significantly less likely to have met the national physicalactivity guideline (30 x 5) and significantly more likely to be in the ‘inactive’ group;• adults in the Wanganui region were significantly less likely to have been members of clubs orcentres in order to take part in sport and recreation activities and were significantly less likely tohave received instruction to improve their performance for a sport or recreation activity;
REGIONAL PROFILE COUNTIES MANUKAU 17Club/CentreInvolvementSport or PhysicalActivity ClubVolunteeringPhysical Activity Levels% of adults whowere members ofany type of clubor centre to takepart in sportand recreationactivity% of adults whowere members ofa sport or physicalactivity club totake part in sportand recreationactivity% ofadults whovolunteeredfor a sport orrecreationactivity% of adults who...met the‘30 x 5’Guidelinedid ‘someactivtiy’were‘inactive’34.9 ± 2 17.9 ± 2 25.3 ± 2 48.2 ± 2 39.1 ± 2 12.7 ± 234.6 ± 6 16.3 ± 6 19.2 ± 6 44.5 ± 6 39.9 ± 6 15.6 ± 640.2 ± 6 22.5 ± 6 22.5 ± 6 42.5 ± 6 45.8 ± 6 11.7 ± 529.2 ± 6 13.3 ± 5 25.7 ± 6 54.3 ± 6 35.7 ± 6 9.9 ± 436.7 ± 6 15.1 ± 5 22.2 ± 5 44.0 ± 6 40.3 ± 6 15.7 ± 534.5 ± 6 13.5 ± 5 20.8 ± 5 51.0 ± 6 35.0 ± 6 14.0 ± 533.9 ± 6 16.3 ± 5 28.3 ± 6 45.9 ± 6 46.4 ± 6 7.7 ± 431.7 ± 6 19.5 ± 6 23.0 ± 6 47.5 ± 6 37.2 ± 6 15.4 ± 525.5 ± 8 14.1 ± 7 28.2 ± 8 35.2 ± 8* 38.6 ± 8 26.2 ± 8*41.0 ± 6 25.3 ± 6 28.2 ± 6 53.3 ± 6 37.0 ± 6 9.7 ± 537.5 ± 6 24.6 ± 6 31.7 ± 6 47.0 ± 7 40.7 ± 6 12.2 ± 524.7 ± 6* 12.0 ± 5 30.3 ± 6 43.0 ± 6 40.3 ± 6 16.8 ± 530.7 ± 6 15.3 ± 6 19.2 ± 6 43.6 ± 7 42.3 ± 7 14.2 ± 537.6 ± 5 19.4 ± 5 21.5 ± 5 47.6 ± 5 42.7 ± 5 9.7 ± 430.3 ± 6 15.7 ± 6 32.7 ± 7 49.8 ± 7 40.1 ± 7 10.1 ± 534.8 ± 6 18.4 ± 5 28.1 ± 6 53.2 ± 6 32.5 ± 6 14.3 ± 536.4 ± 6 24.0 ± 6 32.0 ± 6 51.1 ± 6 36.4 ± 6 12.5 ± 536.7 ± 7 19.6 ± 6 37.4 ± 7* 52.6 ± 7 33.1 ± 7 14.3 ± 6• adults in the Manawatu region were significantly less likely to have participated in an organisedcompetition or event; and• adults in the Southland region were significantly more likely to have participated in an organisedcompetition or event, were significantly more likely to have received instruction to improvetheir performance for a sport or recreation activity, and were significantly more likely to havevolunteered for a sport or recreation activity.