Edexcel IGCSE Geography Chapter 1 - Pearson Schools
Edexcel IGCSE Geography Chapter 1 - Pearson Schools
Edexcel IGCSE Geography Chapter 1 - Pearson Schools

Create successful ePaper yourself
Turn your PDF publications into a flip-book with our unique Google optimized e-Paper software.
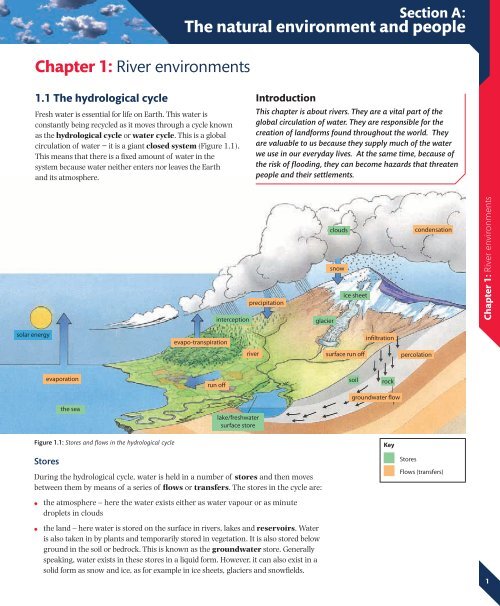
Section A:The natural environment and people<strong>Chapter</strong> 1: River environments1.1 The hydrological cycleFresh water is essential for life on Earth. This water isconstantly being recycled as it moves through a cycle knownas the hydrological cycle or water cycle. This is a globalcirculation of water − it is a giant closed system (Figure 1.1).This means that there is a fixed amount of water in thesystem because water neither enters nor leaves the Earthand its atmosphere.IntroductionThis chapter is about rivers. They are a vital part of theglobal circulation of water. They are responsible for thecreation of landforms found throughout the world. Theyare valuable to us because they supply much of the waterwe use in our everyday lives. At the same time, because ofthe risk of flooding, they can become hazards that threatenpeople and their settlements.interceptionprecipitationcloudssnowice sheetglaciercondensation<strong>Chapter</strong> 1: River environmentssolar energyevapo-transpirationinfiltrationriversurface run offpercolationevaporationthe seaFigure 1.1: Stores and flows in the hydrological cyclerun offlake/freshwatersurface storesoil rockgroundwater flowKeyStoresDuring the hydrological cycle, water is held in a number of stores and then movesbetween them by means of a series of flows or transfers. The stores in the cycle are:StoresFlows (transfers)●●the atmosphere – here the water exists either as water vapour or as minutedroplets in cloudsthe land – here water is stored on the surface in rivers, lakes and reservoirs. Wateris also taken in by plants and temporarily stored in vegetation. It is also stored belowground in the soil or bedrock. This is known as the groundwater store. Generallyspeaking, water exists in these stores in a liquid form. However, it can also exist in asolid form as snow and ice, as for example in ice sheets, glaciers and snowfields.1
●the sea – it is estimated that over 95% of the Earth’s water is stored in the sea.This is overwhelmingly held in liquid form (water), but also in the form of ice, forexample the icebergs in high-latitude seas.While the amount of water in the global hydrological cycle cannot change, theproportion held in the different stores can. The latter changes are triggered bychanges in the Sun’s energy. For example, an increase in the Sun’s energy will leadto more evaporation and possibly to the melting of ice sheets and glaciers.<strong>Chapter</strong> 1: River environmentsLocate and names the stores on a tracingor copy of Figure 1.2.Flows (or transfers)The transfers of water that take place between stores do so by means of a variety offlows as follows (Figure 1.2):●●●●evaporation – we might say that the hydrological cycle starts with evaporationby the heat of the Sun. Water is converted from a liquid into a gas (watervapour). This takes place from the surface of the sea and from water surfaces(ponds, lakes, etc.) on land. Evaporation is particularly important in the transferof water from the sea store into the atmospheretranspiration – plants take up liquid water from the soil and ‘breathe’ it intoatmosphere as water vapourcondensation – this is the change in the atmosphere when water vapour coolsand changes to liquid. The liquid takes the form of water droplets that appear inthe atmosphere as cloudsprecipitation – this is the transfer of water in any form (rain, hail or snow) fromthe atmosphere to the land or sea surfaceprecipitationrun offevaporationinfiltrationgroundwatersurfacewaterFigure 1.2 The hydrological cycle flows simplified2
●●●●overland flow – most of the precipitation that hits the ground moves under gravityand eventually enters a stream, river or lake. This is also known as run offinfiltration and percolation – this is the transfer of water downwardsthrough the soil and rock into the aquifer or groundwater storethroughflow – this takes place between the ground surface and the top of thegroundwater store. Under the influence of gravity, water moves slowly throughthe soil until it reaches a stream or rivergroundwater flow – this takes place in the aquifer and is the undergroundtransfer of water to rivers, lakes and the sea.All of these transfers fit together to form a circle involving the three major stores(the atmosphere, the land and the sea). We might imagine that the cycle starts andfinishes in the sea. However, some of the water that falls as rain on the land maynever reach the sea. Instead it may be returned directly back to the atmospherefrom the land by the transpiration of plants and evaporation from both soil andwater bodies.1.2 Drainage basins and their featuresEvery river has its own drainage basin or catchment area. Each drainage basinis a system. There is a movement of water within it that is rather like a small-scalehydrological cycle. The drainage basin cycle involves stores and flows (see Figure1.3). However, the important difference between the drainage basin and thehydrological cycle is that the former is an open system. A drainage basin hasexternal inputs and outputs. The amount of water in the system in the basin variesover time. In the hydrological cycle the amount of water remains exactly the same.Be sure you know the difference betweenthese 8 flows and where they fit into thehydrological cycle.<strong>Chapter</strong> 1: River environmentsprecipitationenergyfromthe Sunevaporationand transpirationfrom vegetationevaporationfrom watersurfacesprecipitationlakeinterceptionKeysoilWatershedStoresInputsOutputssoilinflitrationgroundwateroverland flowthroughflowsurfacewaterbaseflowthroughflowriverriverflowriverdischargeFlowsFigure 1.3: The drainage basin cycle3
The inputs of a drainage basin are:●●energy from the Sunprecipitation formed from moisture picked up outside the basin● possibly water from tributary drainage basins – this is not shown in Figure 1.3;an explanation is given below.Most of the flows and stores are broadly the same as in the hydrological cycle.The outputs are:●●the river’s dischargethe water in its basin from which evaporation and transpiration take place andwhich eventually falls as precipitation in another drainage basin.<strong>Chapter</strong> 1: River environmentsWhy is the hydrological cycle a closedsystem and the drainage basin cycle anopen system?For more on systems, see:• <strong>Chapter</strong> 2.6 (page 54)• <strong>Chapter</strong> 5.2 (page 116)• <strong>Chapter</strong> 5.5 (page 123)sourceABconfluencetributarymouthABKeydrainage basinswatershedlowlanduplandFigure 1.4: Basic features of the drainage basinAs Figure 1.4 shows, it is possible to draw a dividing line between neighbouringdrainage basins. It follows the tops of the hills and is called the watershed. Themain river has its source in the higher parts of the basin close to the watershed.This is where most precipitation falls. Smaller streams or tributaries enter themain river channel at locations known as confluences. The mouth or estuary ofthe river is where it flows out into the sea.Drainage basins can be of at least three broad types. Not all of them simply collectand deliver water directly to the sea. Some of them are just parts of much largerdrainage basins. For example, the basin of the River Negro in Brazil is a tributary orpart of the huge drainage basin of the River Amazon. The water it collects isconveyed to the Amazon and then eventually to the sea. Some drainage basins donot lead, either directly or indirectly, to the open sea. Rather they lead to ‘inland’seas or lakes such as the Caspian Sea, the Aral Sea or Lake Victoria in Kenya.The drainage network is the system of surface and underground channels thatcollect and transport the precipitation falling on the drainage basin. Figure 1.44
shows the channel networks of two drainage basins, A and B. Basin A’s network isless dense (has fewer channels) than B’s, though the main channel is shorter.Channel networks can be mapped and their lengths and densities (number ofchannels per unit area) measured. The network can change over short periods oftime. For example, during flooding drainage basins often have many more andlonger channels than they do in periods of low or normal rainfall.Each drainage basin is unique in its combination of a range of features. Thesefeatures include size, shape, rock type, relief and land use. The features becomefactors that determine how quickly or slowly water moves through the basin.rapid run off–steep slopes;impermeable rockurban area–speedsup rate of runofflittle run off–permeable rock;rivers havedisappearedundergroundwoodland–slowsrate of run offAre you sure you know the differencebetween permeable and impermeablerocks?<strong>Chapter</strong> 1: River environmentsKeygritlimestoneclayFigure 1.5: Factors affecting run offFigure 1.5 shows how some of these features can affect overland flow or run off.Rock type and relief are physical factors over which people have little control.However, land use can be easily changed by people. Woodland can hold water andslow overland flow. However, once it is cleared for cultivation, run off will speed up.The built-up areas of towns and cities can speed up run off even more. Rainwaterhits solid surfaces such as roofs, pavements and roads. It is then quickly channelledinto drains which speed its delivery into a stream or river.1.3 Hydrographs and river regimesIt can be important to know how quickly any rain falling in a drainage basin orcatchment area will reach the drainage network. It is also important to know howmuch a river’s channel can hold. If the rainwater reaches the river quickly, thechannel may not be able to cope and flooding will occur. The amount of watercarried by a river at any one time is known as its discharge. This is measured incumecs − that is, in cubic metres of water per second moving past a particularpoint along the river’s course.5
50 00040 00030 00020 00010 0000Average monthly discharge in cubic metres per secondJan Feb Mar Apr May June July Aug Sept Oct NovDecRiver discharges vary throughout the year, frommonth to month, from day to day. These variationsmake up what is termed the river regime. In mostrivers, the regime closely reflects local climaticconditions, particularly the rainfall regime. Figure 1.6shows the average monthly discharge of the RiverGanges as it passes through Bangladesh. This diagramis a hydrograph. Clearly, mean (average) discharge ishigh between June and October. This period of highdischarge from the river coincides with the monsoonseason, during which total rainfall can exceed 275 cm.<strong>Chapter</strong> 1: River environmentsFigure 1.6: A hydrograph of the River Ganges in BangladeshDischarge (cumecs)1501401301201101009080706050403020100Oct Nov Dec Jan Feb Mar Apr May Jun Jul Aug Sep2001 2002Figure 1.7: Hydrograph showing the regime of the Thames at Reading, 2001–2002rainfallrainfall peakAchannel water levelat AFigure 1.8: A storm hydrographdischarge of riverlag timerainstormBbase flowchannel water levelat Blevel of waterdischarge abovewhich the riverwill floodhigh riverdischargelow riverdischargeFigure 1.7 shows the regime of the River Thames(England) during one year. Unlike the Ganges, thehighest discharges generally occur in the winter, inFebruary and March. Another feature of thehydrograph is its ‘jaggedness’. Discharge clearly variesfrom day to day. The peaks reflect the impact of passingshowers and short periods of heavy rainfall.The majority of the world’s drainage basins are hometo many people. The big attraction of such areas topeople was their fertile soils and the ability to growfood. Today much money is invested, not just infarmland, but also in homes, businesses and transportin these drainage basins. Thus it is important that weknow how rivers will behave following a period ofheavy rainfall. How great will be the risk of flooding –and over what area? This is where a storm hydrographcomes in useful.A storm hydrograph records the changing dischargeof a river after a passing rainstorm. The bars in theleft-hand corner of Figure 1.8 show the input of rain.It takes time for the rain to reach the river and causeriver levels to rise once it has hit the ground. This delaybetween peak rainfall and peak discharge is called thelag time. The shorter the lag time, the quicker thewater reaches the river channel. A short lag time willcause the river discharge to rise steeply. The steeper therise in discharge, the greater the chances of flooding. Itis possible to mark on the storm hydrograph the levelof discharge above which the river will flood. Once thestorm and its peak discharge have passed, the amountof water in the river starts to decrease.The storm hydrograph shows that discharge of theriver as being made up of two flows:●●the base flow − the ‘normal’ discharge of the riverthe storm flow – the additional discharge of theriver directly related to the passing of the rainstorm.6
There are a number of factors affecting the critical time lag of a storm. These include:●●●the amount and the intensity of the rain – heavy rain will not sink into the ground;instead it will become overland flow or run off and quickly reach the rivertemperatures are significant because they affect the form of precipitation. Forexample, if temperatures are below freezing, precipitation will be in the form ofsnow. This can take weeks to melt. If the ground remains frozen, melting snowon the surface can reach the river quicklyland use − trees and plants will intercept and delay the rain reaching theground. Bare soil and rock will speed up runoff and reduce the time lag. So toowill urban areas covered by tarmac and concrete●●●steep slopes will cause rapid surface runoff, so water will reach the river morequickly. Flat and gently sloping land may lead to water sinking into the soil. Thiswill delay it reaching the riverrock type – impermeable rocks will not allow rainwater to sink into it, so willspeed up runoff. Permeable rock will allow infiltration and percolation of waterinto the bedrock. This in turn will slow the delivery of the water to the riverdams and reservoirs regulate and even out discharges. They hold back dischargeand so reduce the risk of flooding downstream (Figure 1.9).Discharge (cubic metres per second)15001000500impact of damand waterabstraction<strong>Chapter</strong> 1: River environmentsstorm hydrograph0Jan Feb Mar Apr May Jun Jul Aug Sep Oct Nov DecMonthsFigure 1.9: The impact of a dam and water abstraction on a river’s storm hydrographIn your own words, describe thedifferences between the two hydrographsin Figure 1.9. Try to explain thosedifferences.1.4 River processesWeathering and mass movementRivers play a major part in shaping landforms. They do this work by means of threeprocesses – erosion, transport and deposition. These river processes act in a sort ofpartnership with two other processes – weathering and mass movement. Let ustake a look at these two processes before looking more closely at the work thatrivers actually do.Weathering involves elements of the weather, particularly rainfall andtemperatures (Table 1.1).7
Physical weatheringChemical weatheringBiological weatheringThis breaks rock down into smaller and smaller pieces.It is done by changes in temperature and by rainfallfreezing and thawing in rock cracks.This causes rock to decay and disintegrate. It is largelydone by slightly acidic rainfall seeping into porous rock.The roots of plants, especially trees, growing in cracks inthe rocks gradually split the rock apart.Table 1.1: Different types of weathering<strong>Chapter</strong> 1: River environmentsWhat made the landslide in Figure 1.10into a serious hazard and natural disaster?For more on hazards, see <strong>Chapter</strong> 3.Figure 1.10: A landslide – a hazardous form of mass movementAll this destructive activity takes place where rocks outcrop (are above the surfaceof the surrounding land). Once rocks are really broken down, the weatheredmaterial starts to move down the slope under the influence of gravity. This is massmovement. It takes several different forms. In river valleys, there are two maintypes of mass movement:●●slumping – this occurs when the bottom of a valley side slope is cut away by theriver flowing at its base. This makes the slope unstable and weathered materialslumps down towards the river. Slumping is also helped when the weatheredmaterial on the slope is saturated by heavy rain. The water does two things. Itmakes the weathered material heavier and acts as a lubricant. Figure 1.10 is anexample of sudden slumping leading to a major landslide.soil creep – weathered material moves slowly down slope under the influenceof gravity. It collects at the bottom of the valley side and is eroded by the river.8
ErosionThere are several different ways in which rivers erode their channels and valleys(Table 1.2).HydraulicactionAbrasionCorrosionWater hits the river bed and banks with such force that material isdislodged and carried away. This is particularly important duringperiods when the river’s discharge is high.The material being carried by a river is rubbed against the the sidesand floor of the channel. This ‘sandpaper’ action widens anddeepens the channel.Minerals in the rocks forming the sides of the river channel aredissolved by the water flowing past them.Table 1.2: The processes of river erosionAttrition is another river process. It involves particles of material being carried bya river becoming rounder and smaller as they constantly collide with each other.This process doesn’t erode river channels and valleys.TransportThis is the movement of material (known as the load) by the river. The load ismade up of material that has been washed or fallen into river. It also made up ofmaterials eroded by the river itself from the sides of the channel. The load can betransported in a number of different ways (Figure 1.11).solutionWhy is attrition not included in Table 1.2?<strong>Chapter</strong> 1: River environmentslarge bouldersrolled on the bedmaterial dissolved in the watersmall boulders bouncedalong the bedtractionlighter materialcarried along byriver flowsaltationFigure 1.11: Ways in which rivers transport their loadsuspensionExplain why the size of load materialaffects the way it is transported by a river.9
V-shaped valley –cross-sectionriver has been cut downby vertical erosionDepositionDeposition is the laying down of material transported by the river. This occurswhen there is a decrease in the energy, speed and discharge of the river. Thisis most likely to happen when a river enters a lake or the sea. It will alsohappen wherever there is a decrease in the gradient of the river’s channel.<strong>Chapter</strong> 1: River environmentsAKeyS – interlockingspursBhard cap rock –difficult to erodesofter rock –easier to erodeChard rockoriginal positionof waterfallmass movement ofmaterial down thevalley sidesriver cutting downriver cutting downriver swings fromside to sidegorgewaterfall retreatsplunge poolpresent waterfallgorgedirection ofwaterfall retreat1.5 River landformsThe long profile of a river runs from its source to the point where it entersthe sea, a lake or joins another and larger river. The character of the longprofile changes downstream. Overall it has a smooth concave shape. It is steepand in places irregular where the river is flowing well above sea level inupland country. The irregularities occur where hard rock outcrops run acrossthe valley. Natural lakes and reservoirs can also disrupt the smoothness of thelong profile. However, the profile becomes much gentler and smoother as theriver runs through lowland country and reaches its destination. Changes inthe character of river landforms are associated with these changes in the longprofile. For this reason, we should distinguish between upland and lowlandriver landforms.Upland landformsThe main river landforms found in upland areas are: steep V-shaped valleys,interlocking spurs, waterfalls and gorges (see Figure 1.12). They have allbeen formed mainly by the processes of river erosion already described in Part1.4. The processes of weathering and mass movement have also played a part.In the uplands, the long profile is steep and the river flows fast. Much of theriver’s energy is spent cutting downwards. The processes of hydraulic action(erosive force exerted by water) and abrasion, in particular, erode the river bedand thus make the valley deeper (Figure 1.12A). Because of the steepness anddeepness of the valley, there is mass movement of material down the sides ofthe valley. Some of this material becomes river load and helps the abrasionprocess. The valley floor is narrow and often completely occupied by the river.Interlocking spurs are formed where the river swings from side to side(Figure 1.12B). Again the main work of the river is vertically downwardsinto its bed. This means that the river cuts down to flow between spurs ofhigher land on alternate sides of the valley.Waterfalls occur where a band of hard rock outcrops that is much moreresistant to erosion than the softer rock below it (Figure 1.12C and D). Thissofter rock is readily eroded by the force of the water as it falls over the hardcap rock. Gradually, the falling water excavates a plunge pool at the bottomof the falls. Slowly the hard rock is eroded back by the river and so thewaterfall gradually retreats upstream leaving a gorge below it. The gorge isprotected from being widened by its capping of hard rock. The Iguaça Falls inSouth America are a spectacular example and attract many tourists(Figure 1.13).DFigure 1.12: The origin of river landforms in upland areas10
KeyDifference inheight betweenX and Y is 82 metresBRAZILNinternational borderroadairporthotelIguaçu NationalPark, southern BrazilIguaça RiverARGENTINAARGENTINAYIguaçuXFalls0 2 4 6 8 10 kmFigure 1.13: Map and photograph of the Iguaçu FallsLowland landformsThe river and its landforms change when the river leaves the uplands and flowsacross lowlands (Figure 1.14). The river channel becomes wider, deeper andsmoother. Because of this, both the velocity (speed) and discharge of the rivercontinue to increase, despite the gentler gradient. The river course in plan (map)view becomes less straight and is characterised by a series of meanders. The valleycross section is wider and flatter. The floor is occupied by a floodplain with itsdistinctive levees, meanders and ox-bow lakes (Figure 1.15). Near the end of itscourse, the flood plain spreads out to become either a delta or an estuary.<strong>Chapter</strong> 1: River environmentsPlan of the riverUplandsLowlandsdeltadistributariesmeanderox-bowlakeChannelcrosssectionChannelcrosssectionsmaller loadmaterialwide and deeprockValleycrosssectionriverValleycrosssectionalluvium or siltleveesfloodplainFigure 1.14: River and valley features11
layers of deposits build upin great thicknessthe river’s energy is reduced when itleaves the channelleveeleveeriver in floodsilt or alluviumFigure 1.15: The formation of a floodplain and levees<strong>Chapter</strong> 1: River environmentsslowerflow oninsidebendsfastestflow onoutsidebendsdeposits of sandand silt in channelDuring its lowland course, the river is still an agent of erosion. However, verticalerosion is less important because the river is too close to sea level. More importantis lateral erosion where the river wears away the sides of the channel, especiallyon the outside of meanders. The river becomes an agent of deposition as well.Such a large load of material has been picked up that, once the river loses energy, itdrops some of that load, usually mud, stones and other organic matter. Thegreatest thickness of river-deposited material, known as alluvium, is on the floodplain. As its names suggests, the flood plain is an area of flat land formed byflooding. Every time the river leaves its channel, its velocity (speed) decreases. Oncethis happens, alluvium is deposited across the valley floor. A great thickness ofalluvial material builds up. The largest amount of deposition is always on the banksof the channel, which builds up to a greater height than the rest of the floodplainto form levees (Figure 1.15).steep river bankslip-off sloperiver cliffox-bowlakecut offoutside benderodedmore sharplyby river currentsealed bydepositsnarrow neckof landriver nowflows straightxmuchlargermeanderyABCdeposited materialon the slip-off slopeChannel cross-section x–yxfastest waterflow hererivercliffyFigure 1.16: Formation of meanders and oxbowsA study of the formation of meanders and ox-bow lakes shows how the riverboth deposits and erodes laterally (Figure 1.16). The force of the water undercutsthe bank on the outside of a bend to form a steep bank to the channel, called ariver cliff or bluff. An underwater current with a spiral flow carries the erodedmaterial to the inside of the bend where the flow of water is slower. Here thematerial is deposited to form a gentle bank, called a slip-off slope or point bar.12
As lateral erosion continues, the bend of a meander becomes even more pronounced(Figure 1.16). Especially in times of flood, when the river’s energy is much greater,the narrow neck of the meander may be breached (broken and crossed) so that theriver flows straight again. The redundant meander loop retains some water andbecomes an ox-bow lake. Deposition during the flooding helps to seal off the edgesand ends of the lake.Figure 1.17: Mississippi meanders and ox-bow lakesLateral erosion on the outside banks of meanders helps to widen the flood plain.Flood plains have great value for people. Flat land with rich, thick alluvial soils andnearby, plentiful water is attractive to agriculture, industry and urban settlements.Rivers meander naturally. The meanders migrate across the flood plain as theoutside of the meander erodes laterally (sideways). Figure 1.17 shows a small partof the complicated meander pattern of the Mississippi River.Try researching two facts about theMississippi River:• the actual length of the river from itssource to the sea• the straight-line distance from itssource to the sea.What does this tell you about the amountof meandering the river does?<strong>Chapter</strong> 1: River environmentsFigure 1.18: Satellite image of part of the Ganges−Brahmaputra delta. It also showshuge amounts of silt being deposited in the waters of the Bay of Bengal.13
For more information about deltas, seeCase studies on pages 30 and 51.Not all rivers build up deltas as theyenter the sea. Many have open mouthsor estuaries.The delta is the final landform of the river’s journey from its source to the sea orlake. Deltas are vast areas of alluvium at the mouths of rivers. The Ganges−Brahmaputra delta is one of the largest in the world (Figure 1.18). It is located atthe head of the Bay of Bengal. The rivers that have built it up carry hugequantities of sediment, derived mainly from the Himalayas, down to the delta. It isestimated that they deliver about 1.7 billion tonnes of sediment each year. Theflows of the combined rivers are slowed as they meet the denser sea water in theBay. The result is that much of the load being carried is dropped. In fact, it isdeposited faster than the tides can remove it out to sea. The river flow is blocked byso much deposition that the rivers split up into smaller channels known asdistributaries. These distributaries help deposit sediment over a wide area,creating new land where there was once sea.Case study: The River Tay (UK) and its valley<strong>Chapter</strong> 1: River environmentsLook at an atlas map of the British Isles tolocate the drainage basin of the River Tay.In the uplandsThe River Tay is fed by streams which drain the slopes of the GrampianMountains in the Highlands of Scotland. Precipitation in the upland parts ofthe drainage basin is high (well over 1000 mm a year) and slopes are steep.55NA54535251508889B© Crown copyright90 91 92Figure 1.19: Part of the upland course of the River Tay0 1 km14
The height of the drainage basin and the steep slopesresult in large amounts of run off. The Tay is alreadyabout 100 metres across in that part of its course asshown on the Ordnance Survey map extract (Figure1.19). The curving nature of the river course suggeststhat it is flowing between interlocking spurs.The valley cross-section is shown in Figure 1.20A. It isV-shaped and steep-sided. The river fills the valley floor.The cross-section shows that the river is still flowing atsome height above sea level. Erosion by the riverappears to be vertical rather than lateral.In the lowlandsFigure 1.20B shows the valley cross-section near the sea.The flat and low-lying land is the flood plain. It is 0.6 kmwide where the tributary River Earn meets the mainRiver Tay. Notice the big meander loop on the tributarythrough grid squares 1718 and 1717 (Figure 1.21). Theblack dashes marked around its banks show the levees.2221NCmetresmetres500400300200100sea levelA500400300200100sea levelCA In the uplandsRiver TayLine of section = A ➞ B on Figure 1.19BB In the lowlandsRiver TayRiver EarnLine of section = C ➞ D on Figure 1.21 DFigure 1.20: Cross sections across the Tay valley<strong>Chapter</strong> 1: River environments2019181716D© Crown copyright151617 18 19 20 21 22 230 1 kmFigure 1.21: Part of the floodplain and estuary of the River Tay15
The River Tay shows many of the typical estuary features that can be found atthe mouths of rivers (Figure 1.21). They include:●●a wide channel – up to 2 kmsand and mud banks (Abernethy Bank)● some areas of marsh (in grid square 2119)●channels of deeper water (North Deep).1.6 Water uses, demand and supply<strong>Chapter</strong> 1: River environmentssalt water 97%other 0.5%atmosphere0.05%rivers and lakes0.45%soil androck 22%Figure 1.22: The world’s waterFresh water 3%glaciers andice sheets77%How might global warming changeFigure 1.22?UsesOnly 3% of all the water on Earth is fresh water; the rest is saltwater in the seas(Figure 1.22). Over 75% of the fresh water is locked up in glaciers and ice sheets,and 20 per cent is groundwater. The world’s remarkably small amount of freshwater is:●●●essential to all life,vital to the process of economic development,unevenly distributed with some areas ‘water-rich’ and others ‘water-poor’.Freshwater is needed for the following purposes:●●●●domestic use − e.g. bathing and showering; flushing toilets; drinking andcooking; washing clothes and dishes; watering the gardenindustrial use − e.g. producing a litre of beer uses 300 litres of water; producinga hamburger uses on average 2400 litres of water; the production of one tonneof paper uses 400 000 litres of water. See also Figure 1.29 on page 21agricultural use − e.g. irrigating crops; providing drinking water for livestockleisure use – e.g. sport fishing on rivers; sailing on lakes and ponds; wateringgolf courses.All forms of water use involve two key elements:●●demand – this is the need for water for a range of uses. It is also often referredto as consumption. In other words, the amount of water consumed reflects thelevel of demandsupply – that is meeting the demand for water by tapping various sources, suchas groundwater, lakes and rivers.For any country or area within it, it is possible to compare water demand and watersupply. This comparison is known as the water balance (Figure 1.25 on page 18).16DemandWater demand and consumption have increased dramatically during the last 100years with global demand doubling every 20 years (Figure 1.23). The major factorbehind the rising demand has been the continuing growth of the world’s population.Between 1990 and 2010, the world population grew from 5.3 billion to an estimated6.8 billion. However, the rise in the demand and consumption of water is not just dueto growing numbers of people. Development also plays an important part.
●●●The rising standard of living that is part of developmentincreases the domestic use of water. More houses with pipedwater, flush toilets, showers and baths, washing machines,and even swimming pools mean much higher waterconsumption.The rise in agricultural productivity needed to feed agrowing population increases the use of water, particularlyfor irrigation.Industrialisation is a key part of development. Most factoriesare large consumers of water. Water is used for coolingmachinery. It is also used in the generation of electricity forpowering industry.Given the link between development and water consumption, wecan recognise two ‘worlds of water’. There are big differencesbetween water consumption in high-income countries (HICs)01950 1960 1970 1980 1990 2000and in low-income countries (LICs). Water consumption in HICs Figure 1.23: World water consumption, 1950−2000is very high. On average, each person in an HIC uses about 1200cubic metres of water each year. This is about three times as much as a person in aLIC where consumption is around 400 cubic metres per year.There are also some big differences in the use of that water (Figure 1.24). In LICsmost water is used by agriculture and relatively little by industry or in the home. InHICs industry uses the most water followed closely by agriculture. Domestic use ofwater is relatively small, but the percentage is over three times greater than in LICs.SupplyHaving looked at one side of the water equation, let us now look at the other –water supply. In many parts of the world, the water needed to meet the increasingdemand comes from three main sources:●●●rivers and lakes – possibly this was the source of supply used by the earliesthumansreservoirs – these are artificial lakes created by building a dam across a valleyand allowing it to flood. The water collected and stored behind the dam canbecome an important water supplyaquifers and wells − much of the world’s fresh water supply lies underground.It is stored in porous rocks known as aquifers. This groundwater can beextracted by drilling wells or boreholes down to the aquifer. The water is thenraised to the surface by buckets, pumps or under its own pressure.Cubic Km/year50004000300020001000AgricultureIndustryDomesticLIC water consumption4%5%HIC water consumption14%91%AgricultureIndustryDomestic39%<strong>Chapter</strong> 1: River environmentsWater surplus and deficitIf we were to draw up two world maps, one showing the distribution of waterdemand or consumption and the other, water supply, we would find that the twomaps show quite different patterns. If we laid one map on top of the other, wewould be able to pick out three types of area:●●areas where the water balance is negative – in other words where water demandexceeds supply. These are referred to as water-deficit areasareas where the water balance is positive – in other words water-surplus areaswhere the supply or availability of water exceeds demand47%Figure 1.24: Water consumption in LICs and HICs17
●areas where water demand and supply are roughly the same – water-neutralareas where the water balance is literally evenly balanced.<strong>Chapter</strong> 1: River environmentsFigure 1.25: Water-surplus and waterdeficitareas of the worldThe various shades of green in Figure 1.25show those parts of the world wherewater supply just about meets waterdemand. Describe the main areas wherethis is the case.WaterdeficitWatersurplusFigure 1.25 shows the results of overlaying the two world maps – one of demandand the other of supply. Once again we see that there are ‘two worlds of water’.There are, in fact, very few truly water-surplus areas. However, there are largeareas where the water balance is slightly in surplus. These are typically remote,mountainous regions with high annual rainfall, few people and low water demand.On the other hand, there are many water-deficit areas. These are most obvious inAfrica and the Middle East, in Australia and parts of North and South America.Many of these areas are in deficit because they receive little precipitation during thecourse of a year. Others are in deficit because of large populations and risingdevelopment. Good examples of such an area is India.There are ways of moving water from surplus to deficit areas. The most widelyused way is by long-distance pipelines. However, water can also be transported bymotor vehicles and even tanker ships.Case study: Meeting the rising demand for water in England and WalesDaily water consumption in England and Wales is about 120 litres per personper day. That is not a particularly high figure. It compares with 309 litres forFrance and 185 litres for Germany.Water consumption in Britain has been rising in harmony with the growth ofpopulation. However, it has been given a number of pushes over the last200 years. First, it was the growth in manufacturing in the early 19th century.With deindustrialisation in the second half of the 20th century, manufacturing18
uses less water (now 14%) (Figure 1.26). Other consumers now account formore water use. Most notable is the use of water in the generation ofelectricity (now 43%). More water is being used today to irrigate crops (14%)and British citizens are using more water in their homes (20%). More homestoday have washing machines, dishwashers and swimming pools.domestic20%agricultureand fisheries14%services9%manufacturing14%Water is important in making electricityin two ways:energy andwater43%Figure 1.26: Water use in the UKN• it is used directly to turn the turbinesthat generate the electricity, as in HEP• it is converted into steam by theburning of fossil fuels and the steamturns the turbines.<strong>Chapter</strong> 1: River environmentsMajor reservoirsRiversTransfers of water by pipelineFigure 1.27; Water demand and supply in England and Wales0 50 kmOver 1000 mm rainfall per year(high water supply)Less than1000 mm rainfall peryear (low water supply)Major urban areas(high water demand)It would be wrong to think that there areno reservoirs in the drier parts ofEngland. For example, London has anumber of them on its northern andwestern outskirts. These are used both tocollect water and store recycled water.Research the names of some largereservoirs in ‘dry’ England.19
Water stress can be a seasonal ortemporary condition, as during a climate’sdry season or during occasional droughts.Conversely, water stress can be relievedtemporarily by periods of unusuallyheavy rainfall.SeriousModerateLowNot assessedN<strong>Chapter</strong> 1: River environmentsFigure 1.28: England – levels of water stressSuggest some ways of saving water andusing it more efficiently.The problem that faces England and Wales is that the distribution pattern ofwater demand is different from that of water supply (Figure 1.27). The highestwater demand is in SE England which happens to be the driest part of thecountry. Water is most readily available (the rainfall is highest) in upland areasthat are mainly located in Wales and the north of England. The mismatchbetween demand and supply creates different levels of water stress (Figure1.28). Clearly the greatest water stress lies in the south-east of England. It isbeing tackled as follows:●●●extracting as much water as possible from the aquifers of SE Englandconstructing reservoirs in the north and west of the country to collect asmuch rainfall as possible. Famous reservoirs schemes include Lake Vyrnwy inWales and Kielder in NE Englandtransfering this collected water by pipeline to the main areas of water deficit,i.e. the major cities of the Midlands and South.There is no doubt that meeting the rising demand for water is a challengefor the UK. Attempts are being made to reduce water consumption byencouraging a much more efficient use of the available water and toeliminate water wastage (see Part 1.7).20
1.7 Water qualityIn Part 1.6, we looked at water demand and supply simply in terms of quantities.Quantity is important. Figure 1.29 below shows how much water is used to providethings that we need or use in everyday life.It takes ...10 litresof water to make one sheet ofPAPER40 litresof water to make one slice ofBREAD140 litresof water to make one cup ofCOFFEE1 300 litresof water to make one cup ofWHEAT40 litresof water to make one pair ofJEANS15 500 litresof water to make one kilogram ofBEEF<strong>Chapter</strong> 1: River environments4 800 litresof water to make one kilogram ofPORK16 600 litresof water to make one kilogram ofLEATHER200 litresof water to make one kilogram ofPLASTIC40 litresof water to make one glass ofWINE70 litresof water to make oneAPPLEFigure 1.29: The amount of water it takes...80 litresof water per dollar ofINDUSTRIAL PRODUCTHowever, in producing most of the items shown, water quality is also significant. Thisis obviously the case where water is being used for domestic purposes such asdrinking, cooking and washing. It also applies to the growing of crops and rearing oflivestock. Clean water is a priority. Polluted water threatens human health and is thecause of diseases such as cholera, bilharzia, typhoid and diarrhoea.Select one of the high water consumersin Figure 1.29 and research the reasonsfor its high consumption.21
Water quality varies from place to place for a variety of reasons. For example, waterquality is generally poorer in dry climates or where the climate has a marked dryseason. During dry periods, any water that remains on the surface becomesstagnant and can be a breeding ground for diseases. Pollution is another keyfactor that affects water quality, and this varies greatly from place to place. Levelsof pollution are particularly high in urban areas and especially in LIC cities.Sources of water pollutionThere are many sources of water pollution. It is helpful to group them under theheadings of the three main water users – agriculture, industry and domestic uses.Figure 1.30 shows some of them in what we might call the ‘cycle of water pollution’.<strong>Chapter</strong> 1: River environmentsmoisture formscloud and rainmountainstreams flowingwith clean waterpaper and pulp mill inforest area puts chemicalwaste into riverindustrial area:waste from factories aresewage works: treated waste discharged into riverenters river. In one year 60 outof 400 sewage works on theThames broke the law byover-polluting the rivermountain valley dammedto make reservoir. Drinkingwater piped to towns and citiesfarms: liquid from silage andslurry from farm animals entersriver. Fertiliser and pesticidesenter ground water and riverNational Rivers Authorityoffices: responsible forcontrolling pollutionpower station:warm water fromstation enters riverfishing boats’ catch isreduced and some fishare deformed because ofpollutantsoil refinery: oil spillages cancause oil slicks, harmful tobirds and marine lifeoilslickwater from the sea, lakes,rivers and vegetation isevaporated by heat from thesun. The cycle begins againoffshore dumping of sewagesludge gets incorporated intothe marine food chain. This canbe returned to the land whenfish stocks are harvestedcoastal marshes:breeding grounds forbirds. These are oftencontaminated bywater-born pollutantsSEAsewagebargeuntreatedsewagedischargedinto the seabathing beachurban pollutionsewagesoaked Beaches22Figure 1.30: The cycle of water pollution
Agriculture●●●Liquid from farm silage and slurry from farm animals enters riversFertilisers and pesticides seep into the groundwaterDeforestation – run off carries soil and silt into rivers, with serious effects onaquatic life and humans who drink the waterIndustry●●●Taking cooling water for an electric power station from a river and returning itto the source at a higher temperature upsets river ecosystemsSpillages from industrial plants such as oil refineriesWorking of metallic minerals and the heavy use of water in processing ore −toxic substances eventually find their way into riversDomestic purposes●●●The discharge of untreated sewage from houses – even treated sewage pollutesUse of river for washing clothes and bathingEmptying highly chlorinated water from swimming poolsAccess to safe waterSafe water is water that is safe for human consumption. It is not contaminated bypollutants and is free from disease. It is estimated that more than 1 billion people inthe world do not have access to safe water.Can you think of ways in whichrecreation and tourism pollute water?<strong>Chapter</strong> 1: River environments% of populationwho have accessto safe water90%No dataFigure 1.31: Access to safe waterFigure 1.31 shows that the countries with the lowest access to clean water (i.e. lessthan 50% of the population enjoying safe water) are mainly located in Africa andin parts of southern Asia. As a consequence, many people suffer ill health and anearly death. In most HICs, more than 90% of the population have access to cleanwater. It is surprising that the map shows there is no data about clean water for anumber of European countries.Describe the main features shown byFigure 1.31.23
<strong>Chapter</strong> 1: River environmentsFigure 1.32: Three stages in the supply of cleanwater – collection (reservoir), treatment(waterworks) and delivery (standpipe)Managing the supply of clean waterManaging the supply of clean water involves three main stages (Figure 1.32):Collection − Reference has already been made in Part 1.6 to the main sources ofwater, namely:●●●riversreservoirs and lakesaquifers and wells.This is where water is collected from.Treatment − It is very rare to use water that does not need some form ofpurification. Rivers are often highly polluted. Reservoir water can be polluted byfalls of acid rain and the seepage of pollutants from surrounding hillsides.Groundwater used to be thought of as being pure. However, it is now known thatsuch water can be badly contaminated by chemicals in the rocks. In parts ofBangladesh, groundwater is contaminated by arsenic, a highly toxic chemical.Water treatment aims to remove pollutants from the ‘raw’ collected water and soproduce water that is pure enough for human consumption (Figure 1.32).Substances that are removed during the process of drinking water treatmentinclude suspended solids (e.g. silt, soil), bacteria, algae, viruses, fungi, minerals (e.g.iron, manganese and sulphur), and synthetic chemical pollutants (e.g. fertilisers).A combination of processes is used worldwide in the treatment of water for humanconsumption. The combination varies according to the nature of the raw water.The processes include:●●●●●chlorination – to control any biological growth (e.g. algae)aeration – to remove dissolved iron and manganesesedimentation – to remove suspended solidsfiltration – to remove very fine sedimentsdisinfection – to kill bacteria.Delivery – In many countries, particularly HICs, water is delivered from thetreatment works to the point of consumption (the home, factory, etc.) by means ofpipes. The costs of installing pipe networks for the distribution of water are high, sotoo are the costs of maintaining the network. Unless the network is properlymaintained, there can be large losses of water from leaking pipes.In the urban areas of many LICs, water is more often delivered by standpipes (pipesthrough which water is pumped vertically) in the streets. In villages, wells areimportant water sources. Often well water is used untreated. Where water iscollected in buckets and carried from a well or standpipe into the home, there arefurther risks of pollution. Buckets and plastic containers may be dirty. Water left inopen buckets in the home are vulnerable to pollution by dust, insects and animals.A universal problem with the delivery of water by standpipes and wells is the timespent collecting the water (Figure 1.32).24
There is a fourth and relatively new way of delivering water – in plastic bottles filled at asource such as a spring. This is a very expensive way to deliver water because of thecost of the plastic containers, and of filling and transporting them to the point of sale. Itis interesting to note that the biggest sales of bottled water occur in HICs. Some peopleare worried that drinking piped domestic water might be risky. In other words, they areconcerned about water quality and the efficiency of water treatment, even in HICs.What do you think are the advantagesand disadvantages of bottled water?Water management is not just about ensuring a good supply of clean water. Damsand reservoirs can serve a number of different purposes, such as generatingelectricity, supplying irrigation water, flood control and improving navigation. Thismulti-purpose use of water, or river management is well illustrated by the ThreeGorges Dam project in China.Case study: The Three Gorges Dam project (China)The project, started in 1997, has been undertaken mainly for electricityproduction and flood control. Figure 1.33 shows the location of the project inthe middle of China and on its longest river, the Yangtze. The dam wasfinished in 2009 and is the largest in the world. It is 185 m high and almost2 km wide. The reservoir of water that will build up behind the dam isexpected to be up to 600 km long. Hydro-electric generators at the dam willproduce about 10% of China’s present electricity needs. China badly needsthis electricity if it is to continue to industrialise. In the interests of reducingglobal warming, China needs to burn less coal.NIn what ways will the Three GorgesDam project help the growth of industryin China?<strong>Chapter</strong> 1: River environmentsC H I N ABeijingYangtzeRiverThree Gorges Dam projectChongqingdamYichangWuhanShanghai0 500kmFigure 1.33: The location of the Three Gorges Dam projectThe major disadvantage of building such a massive reservoir is that more than1 million people have lost their homes and had to be resettled. By the time itis full, the reservoir will have drowned 13 cities, 140 towns and 1350 villages.The flooding of the Yangtze valley has meant losing some of the country’s bestand most fertile farmland. It is also likely that silt will be trapped behind thedam, making the farmland lower down the Yangtze less fertile over time.25
Tonnes of industrial and human waste will also be trapped behind the dam.A major concern is whether the dam will be able to withstand the earthquakesthat often occur in this part of China. If the dam were to collapse manymillions of people would die.<strong>Chapter</strong> 1: River environmentsMake a list of the disadvantages of theThree Gorges Dam project.Figure 1.34: The completed Three Gorges DamEnvironmentalists have questioned the wisdom of the whole project. Theyargue that a series of smaller hydro-electric dams on the tributaries of theYangtze would have been a more efficient way of generating electricity andmanaging the flood-prone river. However, one long reservoir does offerimproved, year-round navigation, as well as water for industry and agriculture.Any domestic use of the reservoir’s water will require proper treatment.1.8 Flooding – causes and controlFlooding occurs when the amount of water moving down a river exceeds thecapacity of the river’s channel. The excess water overflows the banks and spills outacross the flood plain. Flooding is a hazard that can cause great damage to theenvironment and people.CausesRivers usually flood as a result of a combination of causes. This combination caninvolve both natural (physical) and human factors. In many cases, natural floodingis made worse by people and their activities.Most flooding is related to spells of very heavy rainfall. The critical factor is howquickly this rainfall reaches the river from where it falls on surrounding land andmountains. The shorter the lag time (see Figure 1.8 on page 6) and therefore thefaster it does so, the greater the chances of flooding.26
FACTORPhysicalWeatherRockSoilReliefDrainagedensityVegetationHumanDeforestationUrbanisationAgricultureClimatechangeTable 1.3: Factors causing floodingImpactIntense rainfall greater than the infiltration capacity of the ground.Prolonged rainfall leading to saturation of the ground.Rapid snow melt as temperatures suddenly rise above freezingImpermeable rocks limiting percolation and encouraging rapidsurface run off or overland flowLow infiltration rate in certain soils, e.g. claysSteep slopes causing fast run offHigh drainage density means many tributary streams carry therainwater quickly to the main riverLow density vegetation absorbs little water and does notseriously impede run offCutting down trees reduces interception and speeds up run offConcrete and tarmac surfaces together with drains mean quickerdelivery of rainwater to the riverThe risk of flooding increased by leaving the soil bare, overgrazing,monoculture and ploughing down rather than across slopesIncreasing temperatures, partly due to the burning of fossil fuels,cause more melting of ice sheets and glaciers, as well as morerainfall and more frequent stormsTable 1.3 lists some of the factors that reduce the lag time and therefore increase thechances of flooding.Which of the factors in Table 1.3 are likelyto have the greatest effect on lag times? Itwould help if you were to look back topage 6 about the storm hydrograph.<strong>Chapter</strong> 1: River environmentsFlooding can also result from persistent rain over a relatively long period of time.Gradually, the water table (level of water underground) rises and the soil becomessaturated. Downward infiltration ceases and water simply accumulates in shallowdepressions and on low-lying land.Figure 1.35: Floods in Sheffield, June 200727
The difference between these threefloods is that the Sheffield flood resultedfrom several days of persistently heavyrainfall. The Lynmouth and Boscastlefloods resulted from much more intenserainfall occurring over an upland area ina shorter time.In June 2007, the city of Sheffield in the UK received 269 mm of rain. The averagetotal rainfall for that month is normally 67 mm. Sixty percent of that June rainfallfell in just three days. The fact that this rainfall fell on an impermeable urbansurface located in a hollow at the foot of the steep-sided Pennine Hills greatlyincreased the seriousness of the flooding when the River Don burst its banks(Figure 1.35). Summer floods are relatively uncommon in the UK, but those that dooccur seem to have a greater impact. Notable examples include the floods atLynmouth, Devon (August, 1952) and Boscastle, Cornwall (August, 2004).Consequences of floodslandslidessoil erosionsoil contaminationby sewage<strong>Chapter</strong> 1: River environmentsloss of wildlifehabitatsEffects onenvironmentdestruction ofsettlementsvegetationdestroyeddeath andinjuryloss ofbelongingsdamage topropertycrops andanimals lostEffects onpeopledisruptionto transportcontamination ofwater supply and lossof services, e.g. gasinsuranceclaimsdiseaseand stressFigure 1.36: The effects of flooding on the environment and peopleFigure 1.36 shows some of the more common impacts of flooding. River floods cancertainly cause a lot of damage. As with all natural hazards, there are both immediateand long-term effects. The immediate effects of a flood on people include loss of life,destruction of property and crops, homelessness, the disruption of transport andcommunications and the loss of water supply and sewage disposal services.28
In the longer term, there is the cost of replacing what has been lost and damaged.One particular challenge is removing the huge amounts of silt deposited by thefloodwaters as they go down. In HICs the risks may be covered by insurance. In thecase of the Sheffield flood in 2007, the estimated repair bill was £30 million.Two-thirds of this was needed for repairing damaged roads. Repairing some 1200damaged homes cost over £3 million. The sums involved in fixing up the damagecaused by this localised flood are nothing like the estimated costs of the greatMississippi flood in the same year. The cost of repairs here amounted to around$150 billion.The poor in LICs, however, may lose everything in floods. With cropland ruined andanimals lost, widespread famine can result. Stagnant floodwater polluted byhuman excrement can also become a serious health hazard. It is in these conditionsthat diseases like typhoid and cholera thrive. The need for emergency food andhealth aid in these circumstances becomes urgent. The best hope of recovery lies inthe help provided by international aid organisations.ControlFlood control and flood management can involve three different types of action(Figure 1.37).flood basinafforestationdamreservoirSuggest reasons why floods in HICs areoften more costly than those in LICs.<strong>Chapter</strong> 1: River environmentslimit of floodingsluice gateswetlandflood relief channelchannelstraighteningfloodembankments(levées)Figure 1.37: Some forms of flood managementConstruction − This is the building of hard-engineering structures such asdams, flood embankments (raised artificial banks), sluice gates and relief channels(spillways). Basically these structures either hold back or help to safely dispose offlood water. These structures are generally expensive to build.Adjustment or mitigation − There is an increasing trend towards flood controlschemes that try to avoid or minimise potential flood damage. In other words, itrequires working with nature rather than against it. This is sometimes referred asthe soft-engineering approach to flood control. For example, it might involveIt is important that you are clear about:• the difference between hardengineering and soft engineering• why soft engineering is moreenvironmentally friendly.29
estoring a river to its natural state or preserving marshes and wetlands on floodplains to act as valuable temporary stores of floodwater (like sponges). Otheractions include stricter planning controls to ensure that there is little building onthe flood plain. People in flood-risk areas should be encouraged to take out floodinsurance. Putting in place better flood warning systems would help; so too wouldpublicising what to do in an emergency.<strong>Chapter</strong> 1: River environmentsHow might improved weather forecastinghelp the prediction of floods?Prediction − Prediction of river floods (their extent and depth) is important to floodcontrol. Knowing how high, or wide a river can flood, helps people to decide, forexample, how high river embankments need to be built. It also helps to avoid buildinghouses, factories and services in areas of where there is a high risk of flooding.The problem with prediction is that floods vary. Small floods are likely to occurfairly regularly – say, once every five years. Large floods may be expected lessfrequently – possibly once every 50 years. Perhaps once every 1000 years therewill be truly exceptional flood of a huge scale. The question for river managers is todecide for which level of flood they should provide protection. This is known asrisk assessment. Protecting against the regular five-year flood is going to berelatively cheap and easy. However, is it worth investing huge sums of money toprovide protection against the hugely damaging ‘once-in-a-1000-years flood’? Inmany cases, river managers will take a middle course and aim to be able to dealwith the medium threats of the 50 to 100-year floods. Clearly, where the risk isunder assessed, protection is likely to prove inadequate.Case study: Flood management in BangladeshNC H I N ADelhiNGangesHIE PM AKathmanduA LL AY ATsangpoSPadmaTIBETLhasaBHUTANJamunaASSAMDhakaBramaputraMeghnaBANGLADESHI N D I ABay of BengalMYANMAR0 300 kmFigure 1.38: Catchment area of the rivers of BangladeshEighty percent of Bangladesh and 90% of its over 100 million people live lessthan one metre above sea-level on the floodplains and delta of three verylarge rivers − the Ganges, Brahmaputra and Meghna (Figure 1.38). Bangladeshis the world’s most flood-affected country. Flood management in this LIC isliterally a matter of life or death. Major causes of the annual flooding include30
the monsoon climate with its heavy summer rainfall and tropical storms withthe tidal surges that they cause. Melting Himalayan snow in summer anddeforestation in Nepal are two other flood risk factors.The Bangladeshi Flood Action Plan (FAP) funded by the World Bank began in1990 and involves:●●●●building up embankments to protect the main cities, towns, roadsand farmland (Figure 1.39)dredging channels that have been silted up so that they hold more floodwaterstraightening river channels to prevent erosion of banks or meandersconstructing dams upstream to control flood waters before they reachthe delta●●●●allowing controlled release of floodwater from river channels via spillwaysthat have been constructed to allow the controlled release of flooding watersbuilding huge reservoirs to hold some of the floodwaterimproving flood forecasting and public warning transmission systemsbuilding emergency shelters on areas of slightly higher ground.The FAP involves a mix of hard- and soft-engineering action, but more of theformer. It is a long-term project and will continue to require more fundsthan the Bangladeshi government can afford. Achieving effective floodmanagement there is being made more challenging by two developments:●●the threat of global warming – itonly needs a slight rise in sea levelin the Bay of Bengal and much ofBangladesh will be flooded by thesea. Bangladesh badly needs toimprove its coastal defences. On topof that, any rise in sea levelwill make it even more difficultfor Bangladesh to get rid ofits floodwaterthe three rivers of the Bangladesh’sdelta area all flow for considerabledistances through neighbouringIndia (Figure 1.38). Relationsbetween Bangladesh and India arenot always good. India could helpBangladesh by improving control ofthe floodwaters of these riversbefore they reach Bangladesh.Equally India could pass thefloodwaters on at an even fasterrate and increase even more theflood risks in Bangladesh.Figure 1.39: Mud embankments being builtby handIn your own words, suggest a definitionfor the term ‘ flood management’.<strong>Chapter</strong> 1: River environments31
End of chapter checkoutChecklists<strong>Chapter</strong> 1: River environmentsNow you have read the chapter,you should know:✓✓ how water moves between the land, seaand air in the hydrological cycle✓✓ the main features of a drainage basin✓✓ how to interpret what a hydrograph shows✓✓ what a river regime is, and the factorsaffecting it✓✓ how running water affects thedevelopment of landforms throughthe processes of erosion, transport anddeposition✓✓ how valleys and their distinctive featuresare formed✓✓ the importance of water in our everydaylives✓✓ the reasons for the rising demand forwater✓✓ why there are areas of water shortage andwater surplus✓✓ the reasons why water quality varies✓✓ the main sources of water pollution✓✓ how water is treated and delivered toconsumers✓✓ the causes of flooding✓✓ how the risk of flooding is controlledMake sure you understand these key terms:Abstraction: the taking of water from rivers,lakes and from below the watertable.Base flow: the usual level of a river.Channel network: the pattern of linked streamsand rivers within a drainage basin.Dam: a large structure, usually of concrete,sometimes earth, built across a river to hold backa large body of water (reservoir) for human use.Discharge: the quantity of water flowing in ariver channel at a particular location and time.Erosion: the wearing away and removal ofmaterial by a moving force, such as running water.Deposition: the dropping of material that wasbeing carried by a moving force, such as runningwater.Flood plain: the flat land lying either side of ariver which periodically floods.Hydrograph: a graph showing the discharge of ariver over a given period of time.Hydrological cycle: the global movement ofwater between the air, land and sea.Interlocking spur: a series of ridges projectingout on alternate sides of a valley and aroundwhich a river winds.Levee: a raised bank of material deposited by ariver during periods of flooding.Mass movement: the movement of weatheredmaterial down a slope due to the force of gravity.Meander: a winding curve in a river’s course.Oxbow: a horseshoe-shaped lake once part of ameandering river, but now cut off from it.Pollution: the presence of chemicals, dirtor other substances which have harmful orpoisonous effects on aspects of the environment,such as rivers and the air.Reservoir: an area where water is collected andstored for human use.River regime: the seasonal variations in thedischarge of a river.Stores: features, such as lakes, rivers and aquifers,that receive, hold and release water.Stormflow: the increase in stream velocitycaused by a period of intense rainfall.Stream velocity: the speed at which water isflowing in a river channel at a given locationand time.Transfers: the movement of water betweenstores in the hydrological cycle.Transport: the movement of a river’s load.Waterfall: where a river’s water falls vertically,as where a band of hard rock runs across theriver channel.Watershed: the boundary between neighbouringdrainage basins.Weathering: the breakdown and decay of rockby natural processes, without the involvement ofany moving force.See the Glossary in the ActiveBook for moredefinitions32QuestionsTry testing yourself with these questions:1 Draw a simplified labelled diagram of the hydrological cycle.2 a) What is the difference between a ‘store’ and a ‘flow’?b) Name the three main stores of the hydrological cycle.c) Name six different types of flow.3 a) Name two inputs and two outputs of the drainage basin cycle.b) What is:● a watershed a confluence?4 Explain how each of the following affects the drainage network:● rock type•land use.5 a) What is meant by the term ‘lag time’?b) Describe how lag time is affected by each of following factors:● slope• temperature● precipitation• vegetation.6 Referring to Figures 1.16 and 1.17, compare the regime of the Gangeswith that of the Thames.7 a) What is the difference between ‘weathering’ and ‘mass movement’?b) Describe the four main ways that rivers transport load.8 a) How does a river change when it leaves an upland area?b) Why is deposition greater along the lowland section of a river?9 a) What processes are responsible for the formation of a V-shaped valley?b) Describe three other landforms produced by rivers in upland areas.10 Draw a simplified, labelled diagram to show how meanders and ox-bowsare formed.11 Compare estuaries and deltas in terms of the way they are formed.12 a) Using Figure 1.19, draw a sketch map of the River Tay estuary east ofeasting 20.b) On your sketch map, show and label four features commonly found ina river estuary.c) What are the advantages and disadvantages of this estuary for shipping?13 a) What are the five main uses of fresh water?b) What are the main sources of fresh water?14 Why has the demand for water increased so much over the last 100 years?15 Why is water quality so important?16 Give four other causes of river pollution17 Explain how a) industry and b) agriculture pollute water.18 Draw a labelled diagram to show the stages in managing the supply ofclean water.19 a) Make a two-column list of the benefits and costs of the Three GorgesDam project in China.b) Which of the two columns do you think is more important?Give your reasons.20 a) Identify four physical factors that help cause flooding.b) Explain how deforestation and urbanisation also cause flooding.21 Give examples of a) the short-term and b) the long-term consequencesof flooding.22 a) What is meant by the term ‘flood adjustment’?b) What is the difference between ‘soft’ and ‘hard’ engineering in themanagement of floods?