Edexcel IGCSE Geography Chapter 1 - Pearson Schools
Edexcel IGCSE Geography Chapter 1 - Pearson Schools
Edexcel IGCSE Geography Chapter 1 - Pearson Schools

You also want an ePaper? Increase the reach of your titles
YUMPU automatically turns print PDFs into web optimized ePapers that Google loves.
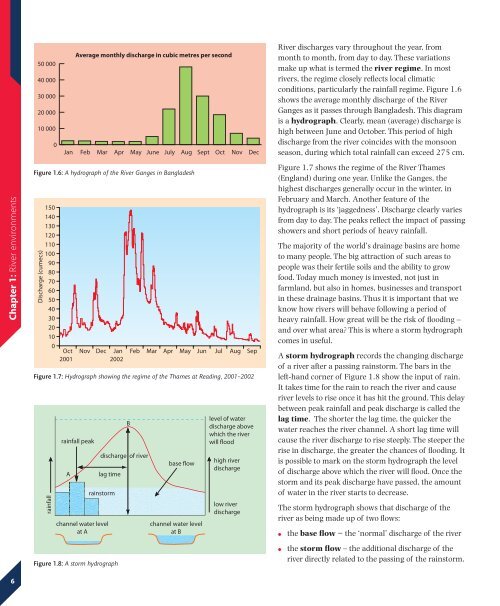
50 00040 00030 00020 00010 0000Average monthly discharge in cubic metres per secondJan Feb Mar Apr May June July Aug Sept Oct NovDecRiver discharges vary throughout the year, frommonth to month, from day to day. These variationsmake up what is termed the river regime. In mostrivers, the regime closely reflects local climaticconditions, particularly the rainfall regime. Figure 1.6shows the average monthly discharge of the RiverGanges as it passes through Bangladesh. This diagramis a hydrograph. Clearly, mean (average) discharge ishigh between June and October. This period of highdischarge from the river coincides with the monsoonseason, during which total rainfall can exceed 275 cm.<strong>Chapter</strong> 1: River environmentsFigure 1.6: A hydrograph of the River Ganges in BangladeshDischarge (cumecs)1501401301201101009080706050403020100Oct Nov Dec Jan Feb Mar Apr May Jun Jul Aug Sep2001 2002Figure 1.7: Hydrograph showing the regime of the Thames at Reading, 2001–2002rainfallrainfall peakAchannel water levelat AFigure 1.8: A storm hydrographdischarge of riverlag timerainstormBbase flowchannel water levelat Blevel of waterdischarge abovewhich the riverwill floodhigh riverdischargelow riverdischargeFigure 1.7 shows the regime of the River Thames(England) during one year. Unlike the Ganges, thehighest discharges generally occur in the winter, inFebruary and March. Another feature of thehydrograph is its ‘jaggedness’. Discharge clearly variesfrom day to day. The peaks reflect the impact of passingshowers and short periods of heavy rainfall.The majority of the world’s drainage basins are hometo many people. The big attraction of such areas topeople was their fertile soils and the ability to growfood. Today much money is invested, not just infarmland, but also in homes, businesses and transportin these drainage basins. Thus it is important that weknow how rivers will behave following a period ofheavy rainfall. How great will be the risk of flooding –and over what area? This is where a storm hydrographcomes in useful.A storm hydrograph records the changing dischargeof a river after a passing rainstorm. The bars in theleft-hand corner of Figure 1.8 show the input of rain.It takes time for the rain to reach the river and causeriver levels to rise once it has hit the ground. This delaybetween peak rainfall and peak discharge is called thelag time. The shorter the lag time, the quicker thewater reaches the river channel. A short lag time willcause the river discharge to rise steeply. The steeper therise in discharge, the greater the chances of flooding. Itis possible to mark on the storm hydrograph the levelof discharge above which the river will flood. Once thestorm and its peak discharge have passed, the amountof water in the river starts to decrease.The storm hydrograph shows that discharge of theriver as being made up of two flows:●●the base flow − the ‘normal’ discharge of the riverthe storm flow – the additional discharge of theriver directly related to the passing of the rainstorm.6