

ag-2013-14-w-eng
ag-2013-14-w-eng
ag-2013-14-w-eng
- No tags were found...

Create successful ePaper yourself
Turn your PDF publications into a flip-book with our unique Google optimized e-Paper software.
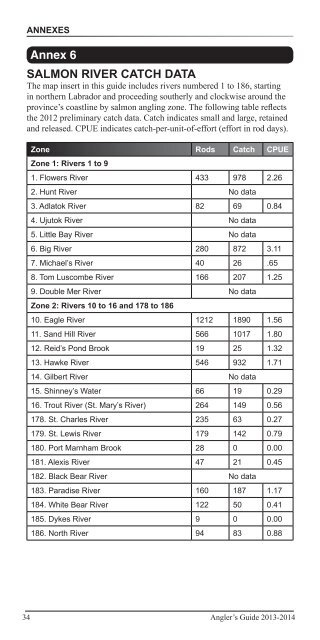
AnnexesAnnex 6Salmon RIVER CATCH DATAThe map insert in this guide includes rivers numbered 1 to 186, startingin northern Labrador and proceeding southerly and clockwise around theprovince’s coastline by salmon angling zone. The following table reflectsthe 2012 preliminary catch data. Catch indicates small and large, retainedand released. CPUE indicates catch-per-unit-of-effort (effort in rod days).Zone Rods Catch CPUEZone 1: Rivers 1 to 91. Flowers River 433 978 2.262. Hunt River No data3. Adlatok River 82 69 0.844. Ujutok River No data5. Little Bay River No data6. Big River 280 872 3.117. Michael’s River 40 26 .658. Tom Luscombe River 166 207 1.259. Double Mer River No dataZone 2: Rivers 10 to 16 and 178 to 18610. E<strong>ag</strong>le River 1212 1890 1.5611. Sand Hill River 566 1017 1.8012. Reid’s Pond Brook 19 25 1.3213. Hawke River 546 932 1.71<strong>14</strong>. Gilbert River No data15. Shinney’s Water 66 19 0.2916. Trout River (St. Mary’s River) 264 <strong>14</strong>9 0.56178. St. Charles River 235 63 0.27179. St. Lewis River 179 <strong>14</strong>2 0.79180. Port Marnham Brook 28 0 0.00181. Alexis River 47 21 0.45182. Black Bear River No data183. Paradise River 160 187 1.17184. White Bear River 122 50 0.41185. Dykes River 9 0 0.00186. North River 94 83 0.8834 Angler’s Guide <strong>2013</strong>-20<strong>14</strong>