Towards a Sustainable and Efficient State The Development ...
Towards a Sustainable and Efficient State The Development ...
Towards a Sustainable and Efficient State The Development ...

You also want an ePaper? Increase the reach of your titles
YUMPU automatically turns print PDFs into web optimized ePapers that Google loves.
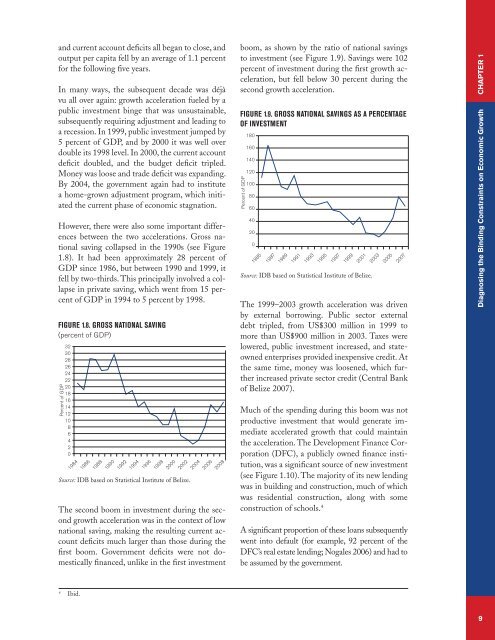
<strong>and</strong> current account deficits all began to close, <strong>and</strong>output per capita fell by an average of 1.1 percentfor the following five years.In many ways, the subsequent decade was déjàvu all over again: growth acceleration fueled by apublic investment binge that was unsustainable,subsequently requiring adjustment <strong>and</strong> leading toa recession. In 1999, public investment jumped by5 percent of GDP, <strong>and</strong> by 2000 it was well overdouble its 1998 level. In 2000, the current accountdeficit doubled, <strong>and</strong> the budget deficit tripled.Money was loose <strong>and</strong> trade deficit was exp<strong>and</strong>ing.By 2004, the government again had to institutea home-grown adjustment program, which initiatedthe current phase of economic stagnation.However, there were also some important differencesbetween the two accelerations. Gross nationalsaving collapsed in the 1990s (see Figure1.8). It had been approximately 28 percent ofGDP since 1986, but between 1990 <strong>and</strong> 1999, itfell by two-thirds. This principally involved a collapsein private saving, which went from 15 percentof GDP in 1994 to 5 percent by 1998.Figure 1.8. Gross National Saving(percent of GDP)Percent of GDP323028262422201816141210864201984198619881990199219941996199820002002200420062008Source: IDB based on Statistical Institute of Belize.<strong>The</strong> second boom in investment during the secondgrowth acceleration was in the context of lownational saving, making the resulting current accountdeficits much larger than those during thefirst boom. Government deficits were not domesticallyfinanced, unlike in the first investmentboom, as shown by the ratio of national savingsto investment (see Figure 1.9). Savings were 102percent of investment during the first growth acceleration,but fell below 30 percent during thesecond growth acceleration.Figure 1.9. Gross National Savings as a Percentageof InvestmentPercent of GDP180160140120100806040200198519871989199119931995Source: IDB based on Statistical Institute of Belize.<strong>The</strong> 1999–2003 growth acceleration was drivenby external borrowing. Public sector externaldebt tripled, from US$300 million in 1999 tomore than US$900 million in 2003. Taxes werelowered, public investment increased, <strong>and</strong> stateownedenterprises provided inexpensive credit. Atthe same time, money was loosened, which furtherincreased private sector credit (Central Bankof Belize 2007).Much of the spending during this boom was notproductive investment that would generate immediateaccelerated growth that could maintainthe acceleration. <strong>The</strong> <strong>Development</strong> Finance Corporation(DFC), a publicly owned finance institution,was a significant source of new investment(see Figure 1.10). <strong>The</strong> majority of its new lendingwas in building <strong>and</strong> construction, much of whichwas residential construction, along with someconstruction of schools. 4A significant proportion of these loans subsequentlywent into default (for example, 92 percent of theDFC’s real estate lending; Nogales 2006) <strong>and</strong> had tobe assumed by the government.199719992001200320052007chapter 1Diagnosing the Binding Constraints on Economic Growth4Ibid.9