Trade patterns and global value chains in East Asia: - IDE-JETRO
Trade patterns and global value chains in East Asia: - IDE-JETRO
Trade patterns and global value chains in East Asia: - IDE-JETRO

Create successful ePaper yourself
Turn your PDF publications into a flip-book with our unique Google optimized e-Paper software.
<strong>Trade</strong> Patterns <strong>and</strong> Global Value Cha<strong>in</strong>s <strong>in</strong> <strong>East</strong> <strong>Asia</strong>AcknowledgementsThis publication is the result of a cooperative effortbetween the WTO <strong>and</strong> <strong>IDE</strong>-<strong>JETRO</strong>. The writ<strong>in</strong>g of thebook <strong>and</strong> the preparation of the various statistical <strong>in</strong>putshas <strong>in</strong>volved staff from both organizations.Many people provided assistance dur<strong>in</strong>g its preparation.Special thanks are addressed to <strong>IDE</strong>-<strong>JETRO</strong> for hav<strong>in</strong>gprovided the <strong>Asia</strong>n International Input-Output (AIO)Tables used for the compilation of many <strong>in</strong>dicators shown<strong>in</strong> the publication. Acknowledgements are also due toAnthony Mart<strong>in</strong> <strong>and</strong> Helen Swa<strong>in</strong> of the WTO Information<strong>and</strong> External Relations Division for their comments<strong>and</strong> suggestions. We are also grateful to the WTODocuments Reproduction <strong>and</strong> Distribution Section.About the editors <strong>and</strong> contributorsThe publication was prepared <strong>and</strong> edited under thedirection of Hubert Escaith, WTO Chief Statistician,<strong>and</strong> Satoshi Inomata, Director of the International Input-Output Analysis Group, <strong>IDE</strong>-<strong>JETRO</strong>.Christophe Dega<strong>in</strong> <strong>and</strong> Andreas Maurer were responsiblefor the technical supervision of the project. ChristopheDega<strong>in</strong> also managed the publication process, assistedby Antonella Liberatore <strong>and</strong> Myriam Nafir.Contributors to the <strong>in</strong>itial manuscripts <strong>in</strong>cludeChristophe Dega<strong>in</strong> (Chapters I, VIII, IX), Florian Eberth(III, VIII, IX), Hubert Escaith (I, IV, VI), Farah Farooq (III,V), Satoshi Inomata (VI, VII, X), Andreas Maurer (II, V),Adel<strong>in</strong>a Mendoza (IV), Bo Meng (X) <strong>and</strong> Bekele Tamenu(II, III).Giacomo Frigerio was responsible for the graphic design<strong>and</strong> layout of the publication.DisclaimerThis publication <strong>and</strong> any op<strong>in</strong>ions reflected there<strong>in</strong> are the sole responsibility of the WTO Secretariat <strong>and</strong> <strong>IDE</strong>-<strong>JETRO</strong>.They do not express the op<strong>in</strong>ions or views of WTO members or of <strong>in</strong>stitutional stakeholders of <strong>IDE</strong>-<strong>JETRO</strong>.WTO members are frequently referred to as “countries”, although some members are not countries <strong>in</strong> the usualsense of the word but are officially “customs territories”. Geographical <strong>and</strong> other group<strong>in</strong>gs <strong>in</strong> this report do notimply any expression of op<strong>in</strong>ion by the authors concern<strong>in</strong>g the status of any country or territory, the delimitation of itsfrontiers or the rights or obligations of any WTO member <strong>in</strong> respect of WTO agreements. The colours, boundaries,denom<strong>in</strong>ations, <strong>and</strong> classifications used <strong>in</strong> the maps which feature <strong>in</strong> this publication do not imply any judgement ofthe legal or other status of any territory, nor any endorsement or acceptance of any boundary.Throughout this report, the Hong Kong Special Adm<strong>in</strong>istrative Region of Ch<strong>in</strong>a, the Republic of Korea <strong>and</strong> theSeparate Customs Territory of Taiwan, Penghu, K<strong>in</strong>men <strong>and</strong> Matsu are referred to as Hong Kong (Ch<strong>in</strong>a), Korea,Rep. of (<strong>in</strong> some figures), <strong>and</strong> Ch<strong>in</strong>ese Taipei, respectively.Note on geographical coverage<strong>East</strong> <strong>Asia</strong> <strong>in</strong> this publication covers Ch<strong>in</strong>a, Hong Kong (Ch<strong>in</strong>a), Indonesia, Japan, the Republic of Korea, Macao (Ch<strong>in</strong>a),Malaysia, the Philipp<strong>in</strong>es, S<strong>in</strong>gapore, Ch<strong>in</strong>ese Taipei, Thail<strong>and</strong> <strong>and</strong> Viet Nam. India is also <strong>in</strong>cluded <strong>in</strong> the study. Depend<strong>in</strong>gon data availability, the country coverage can vary across chapters. See Annex 1 for details on the composition ofgeographical <strong>and</strong> economic group<strong>in</strong>gs used <strong>in</strong> the publication.Statistical note<strong>Trade</strong> data sourced from statistical frameworks such as the balance of payments (BOP), customs or <strong>in</strong>put-output tablesdo not necessarily match each other due to differences <strong>in</strong> concepts.2
ForewordThis book is the result of cooperation between <strong>IDE</strong>-<strong>JETRO</strong> <strong>and</strong> the WTO <strong>in</strong> analys<strong>in</strong>g a fundamentalchange that has been tak<strong>in</strong>g place <strong>in</strong> the structure of<strong>in</strong>ternational trade. This change is referred to <strong>in</strong> variousways: vertical specialization, production shar<strong>in</strong>g, trade <strong>in</strong>tasks, or supply cha<strong>in</strong> trade, to cite just a few. What theseall <strong>in</strong>dicate is that much of trade these days comprisescomponents or <strong>in</strong>termediate goods <strong>and</strong> services thatpass from economy to economy before becom<strong>in</strong>g part ofa f<strong>in</strong>al traded product.This change has many implications for the way weunderst<strong>and</strong> trade policy. The dist<strong>in</strong>ction between “them”<strong>and</strong> “us” that has traditionally def<strong>in</strong>ed our way of th<strong>in</strong>k<strong>in</strong>gabout imports <strong>and</strong> exports is <strong>in</strong>creas<strong>in</strong>gly outmoded.Products are no longer “made <strong>in</strong> Japan”, or “made <strong>in</strong>France”; they are truly “made <strong>in</strong> the world”. This newreality has profound implications on several counts. Inparticular, it redef<strong>in</strong>es the nature of trade relations that arenow characterized by a much closer <strong>in</strong>ter-relationship.In order to underst<strong>and</strong> fully the true nature of these newtrad<strong>in</strong>g <strong>in</strong>teractions, <strong>and</strong> the actual contribution of tradeto national economies, we need to promote a conceptual<strong>and</strong> statistical shift <strong>in</strong> the way trade is most commonlyperceived <strong>in</strong> policy debates. The present research buildson complementary programmes developed separately at<strong>IDE</strong>-<strong>JETRO</strong>, with the construction of <strong>in</strong>ternational <strong>in</strong>putoutputmatrices, <strong>and</strong> at WTO, with the measurement oftrade <strong>in</strong> <strong>value</strong> added. By comb<strong>in</strong><strong>in</strong>g the expertise <strong>and</strong>data available <strong>in</strong> both organizations, this book illustrateshow the conjunction of technical, <strong>in</strong>stitutional <strong>and</strong> politicalchanges <strong>in</strong> <strong>East</strong> <strong>Asia</strong> <strong>in</strong> the past 30 years has led to theemergence of new production <strong>and</strong> trade networks.success story was the result of a close partnershipbetween private <strong>and</strong> public sectors, the latter facilitat<strong>in</strong>gthe work of the former. Build<strong>in</strong>g these <strong>in</strong>dustrialrelationships also paved the way for the emergence ofdeeper regional <strong>in</strong>tegration.Besides analys<strong>in</strong>g the new trad<strong>in</strong>g relations from<strong>in</strong>ternational <strong>and</strong> regional perspectives, the book alsoprovides <strong>in</strong>terest<strong>in</strong>g f<strong>in</strong>d<strong>in</strong>gs on the impact of <strong>in</strong>ternationaltrade on domestic economies. The role of trade <strong>in</strong>generat<strong>in</strong>g employment opportunities is reviewed, <strong>and</strong>shows, us<strong>in</strong>g the emblematic case of Ch<strong>in</strong>a, how anexport-led development strategy, <strong>in</strong>itially focused on afew <strong>in</strong>dustrial coastal zones, was able to progressively<strong>in</strong>clude the rest of the economy.<strong>East</strong> <strong>Asia</strong> has been at the heart of the new model govern<strong>in</strong>g<strong>global</strong> manufactur<strong>in</strong>g <strong>and</strong> <strong>in</strong>ternational trade. It providesa natural case study to explore the contours of this newterritory. But the relevance of the study transcends theregional dimension, <strong>and</strong> we hope that analysts <strong>and</strong> policymakers from other regions, especially <strong>in</strong> the develop<strong>in</strong>gworld, will read these results with <strong>in</strong>terest <strong>and</strong> adaptthem to their own national <strong>and</strong> regional contexts.Pascal LamyWTO Director-GeneralTakashi Shiraishi<strong>IDE</strong>-<strong>JETRO</strong> PresidentThe report makes it clear that bus<strong>in</strong>ess opportunities<strong>in</strong> develop<strong>in</strong>g countries have not only been l<strong>in</strong>ked tochanges <strong>in</strong> the <strong>global</strong> manufactur<strong>in</strong>g model, spurredby the United States <strong>and</strong> Japan, but have also beenstimulated by governments <strong>in</strong> develop<strong>in</strong>g countries.These governments have <strong>in</strong>vested massively to providethe necessary transportation <strong>and</strong> telecommunication<strong>in</strong>frastructure, while facilitat<strong>in</strong>g trade through various<strong>in</strong>stitutional <strong>and</strong> adm<strong>in</strong>istrative improvements. The <strong>Asia</strong>n3
<strong>Trade</strong> Patterns <strong>and</strong> Global Value Cha<strong>in</strong>s <strong>in</strong> <strong>East</strong> <strong>Asia</strong>IntroductionThe geographical fragmentation of production hascreated a new trade reality. Often referred to as<strong>global</strong> <strong>value</strong> <strong>cha<strong>in</strong>s</strong> or vertical specialization, thisfragmentation deepens the <strong>in</strong>terdependency of traderelations <strong>and</strong> has many implications for how weunderst<strong>and</strong> trade policy. This book sheds light on thenature of this <strong>in</strong>terdependency, <strong>and</strong> the contributionof trade to national economies. It illustrates theconjunction of technical, <strong>in</strong>stitutional <strong>and</strong> politicalchanges that led to the emergence of production <strong>and</strong>trade networks <strong>in</strong> <strong>East</strong> <strong>Asia</strong>, <strong>in</strong>clud<strong>in</strong>g their impact ontrade <strong>patterns</strong>.As shown <strong>in</strong> the diagram, the rise of <strong>global</strong> <strong>value</strong><strong>cha<strong>in</strong>s</strong> results from the conjunction of several factors.It started with a change <strong>in</strong> the consumption models of<strong>in</strong>dustrialized economies, which found a supply potential<strong>in</strong> some develop<strong>in</strong>g countries. The book also showshow this development approach, <strong>in</strong>itially centred on afew lead<strong>in</strong>g economies that had adopted an export-led<strong>in</strong>dustrialization strategy, enabled a larger number ofregional partners to embark on an <strong>in</strong>dustrialization paththat had deep implications for their domestic economies.This structural shift <strong>in</strong> the function<strong>in</strong>g of <strong>in</strong>ternationaltrade requires, <strong>in</strong> turn, that the tools used to analyse itsevolution, <strong>in</strong> particular trade statistics, be adapted.International dem<strong>and</strong>Development of<strong>in</strong>frastructure<strong>and</strong> trade policyIndustrial process<strong>in</strong>g zonesOffshor<strong>in</strong>g-outsourc<strong>in</strong>gstrategies <strong>and</strong> FDIGlobal Value Cha<strong>in</strong>s (GVCs)<strong>and</strong> world tradeIncrease of trade <strong>in</strong><strong>in</strong>termediate goodsNeed for new statisticalmeasures of <strong>in</strong>ternationaltradeDomestic/territorialimpact of GVCsThe first chapter recalls that <strong>global</strong>ization has gonethrough several phases; as a matter of fact, the historyof mank<strong>in</strong>d is often closely related to the evolution oftrade. In former times, when transportation was difficult,<strong>in</strong>ternational trade was limited to the most expensiveitems. With the <strong>in</strong>dustrial revolution <strong>in</strong> the 19th century,mass production <strong>and</strong> improved transportation made<strong>in</strong>ternational trade much easier, <strong>and</strong> most goods becametradable. More recently, a new phenomenon, “<strong>global</strong>manufactur<strong>in</strong>g”, is aga<strong>in</strong> boost<strong>in</strong>g the volume <strong>and</strong> diversityof products be<strong>in</strong>g exchanged. But it is also chang<strong>in</strong>g thevery nature of <strong>in</strong>ternational trade. Global manufactur<strong>in</strong>gis characterized by the geographical fragmentation ofproductive processes <strong>and</strong> the offshor<strong>in</strong>g of <strong>in</strong>dustrialtasks.The <strong>in</strong>creas<strong>in</strong>g fragmentation of <strong>value</strong> <strong>cha<strong>in</strong>s</strong> has ledto an <strong>in</strong>crease of trade flows <strong>in</strong> <strong>in</strong>termediate goods,especially <strong>in</strong> the manufactur<strong>in</strong>g sector. In 2009, trade<strong>in</strong> <strong>in</strong>termediate goods was the most dynamic sectorof <strong>in</strong>ternational trade, represent<strong>in</strong>g more than 50 percent of non-fuel world merch<strong>and</strong>ise trade. This trade<strong>in</strong> parts, components <strong>and</strong> accessories encourages thespecialization of different economies, lead<strong>in</strong>g to a “trade<strong>in</strong> tasks” that adds <strong>value</strong> along the production cha<strong>in</strong>.Specialization is no longer based on the overall balanceof comparative advantage of countries <strong>in</strong> produc<strong>in</strong>g af<strong>in</strong>al good, but on the comparative advantage of “tasks”that these countries complete at a specific step alongthe <strong>global</strong> <strong>value</strong> cha<strong>in</strong>.4
<strong>Trade</strong> Patterns <strong>and</strong> Global Value Cha<strong>in</strong>s <strong>in</strong> <strong>East</strong> <strong>Asia</strong>to de facto economic <strong>in</strong>tegration were first observed <strong>in</strong>Japan, <strong>and</strong> then gradually shifted towards Ch<strong>in</strong>a. Thechapter shows the grow<strong>in</strong>g role of Ch<strong>in</strong>a <strong>and</strong> the relativedecl<strong>in</strong>e of the United States <strong>and</strong> Japan as productionhubs. Other emerg<strong>in</strong>g <strong>East</strong> <strong>Asia</strong>n economies have alsosignificantly <strong>in</strong>creased their degree of <strong>in</strong>tegration <strong>in</strong>to theregional production system, contribut<strong>in</strong>g to strengthen<strong>in</strong>geconomic <strong>in</strong>terdependency <strong>in</strong> the <strong>Asia</strong>-US region.The diversity <strong>and</strong> complementarity of the regionalproduction system also fosters specialization when itcomes to trade <strong>in</strong> tasks. Reflect<strong>in</strong>g their particular roles<strong>in</strong> <strong>global</strong> <strong>value</strong> <strong>cha<strong>in</strong>s</strong>, some countries, like Japan or theRepublic of Korea, specialize <strong>in</strong> the export of products<strong>in</strong>volv<strong>in</strong>g high- or medium-skilled labour, while others,such as Ch<strong>in</strong>a or Viet Nam, focus on low-skilled, labour<strong>in</strong>tensiveactivities. When consider<strong>in</strong>g the totality ofthe <strong>value</strong> cha<strong>in</strong>, from conception to production <strong>and</strong>consumption, developed economies like the UnitedStates tend to create employment at both ends of thequalification spectrum, from highly-skilled eng<strong>in</strong>eers<strong>and</strong> professionals to low-skilled retail workers; however,low-skilled manufactur<strong>in</strong>g tasks are outsourced. Thenet balance of employment is also clearly <strong>in</strong>fluenced bythe overall macroeconomic situation of each economy;net job creation attributable to trade is much higher <strong>in</strong>export-led surplus countries than <strong>in</strong> <strong>in</strong>ward-orientedones, especially when the latter run structural tradedeficits.An exam<strong>in</strong>ation of the historical evolution of productionnetworks <strong>in</strong> the region, which is the purpose of ChapterVII, shows how <strong>Asia</strong>n economies have become<strong>in</strong>terconnected with each other <strong>and</strong> with the US market.In 1985, there were only four key players <strong>in</strong> the region:Indonesia, Japan, Malaysia <strong>and</strong> S<strong>in</strong>gapore. In the 1990s,the Republic of Korea, Ch<strong>in</strong>ese Taipei <strong>and</strong> Thail<strong>and</strong> alsoemerged as important l<strong>in</strong>ks <strong>in</strong> the production network.Japan was extend<strong>in</strong>g its supply <strong>cha<strong>in</strong>s</strong>, while outsourc<strong>in</strong>gfrom the United States was also strongly enter<strong>in</strong>g thepicture. After 2000, the emergence of Ch<strong>in</strong>a altered theregional network, <strong>and</strong> by 2005, the network’s centre ofgravity had clearly shifted there. The <strong>in</strong>termediate goodsimported by Ch<strong>in</strong>a come through relatively long <strong>and</strong>complex supply <strong>cha<strong>in</strong>s</strong>, characterized by a high degreeof fragmentation <strong>and</strong> sophistication. The competitivenessof Ch<strong>in</strong>ese exports is not only attributable to its lowproduction costs, but also to the complex <strong>in</strong>termediategoods imported from other countries, be they from <strong>Asia</strong>or the rest of the world.Chapter VIII is dedicated to the mapp<strong>in</strong>g of trade<strong>in</strong> <strong>in</strong>termediate goods, which constitutes the “bloodstream” that irrigates <strong>global</strong> <strong>and</strong> regional supply <strong>cha<strong>in</strong>s</strong>.<strong>Trade</strong> <strong>in</strong> <strong>in</strong>termediate goods now dom<strong>in</strong>ates worldtrade <strong>in</strong> non-fuel merch<strong>and</strong>ise. While Europe is still thebiggest trader <strong>in</strong> <strong>in</strong>termediate goods, <strong>Asia</strong> has beenrapidly clos<strong>in</strong>g the gap, <strong>and</strong> is now a close second.While <strong>in</strong>termediate goods constitute more than 60 percent of <strong>Asia</strong>’s total imports, <strong>Asia</strong> tends to export moref<strong>in</strong>al goods composed of the imported <strong>in</strong>termediateones. This regional characteristic, <strong>in</strong>herent <strong>in</strong> the region’srole as “Factory <strong>Asia</strong>”, is not equally displayed by eachcountry. Some economies, like Ch<strong>in</strong>a, India <strong>and</strong> VietNam, have dist<strong>in</strong>ctly higher shares of <strong>in</strong>termediate goods<strong>in</strong> their imports than <strong>in</strong> their exports, while the opposite istrue for the Republic of Korea, Japan <strong>and</strong> Ch<strong>in</strong>ese Taipei.Not only has trade <strong>in</strong> <strong>in</strong>termediate goods <strong>in</strong>creased, butthese goods are also <strong>in</strong>creas<strong>in</strong>gly complex.Some trade analysts have argued that the change fromtrade <strong>in</strong> goods to trade <strong>in</strong> tasks implied by the operationof <strong>global</strong> <strong>value</strong> <strong>cha<strong>in</strong>s</strong> is comparable to a paradigm shift <strong>in</strong>the analysis of <strong>in</strong>ternational trade. Because new conceptsalso <strong>in</strong>volve new measurements, Chapter IX exploressome of the changes required to complement exist<strong>in</strong>gstatistical <strong>in</strong>dicators. The complexity of productive <strong>and</strong>commercial relationships has blurred the relevance ofa series of macroeconomic <strong>in</strong>dicators, such as bilateraltrade balances. The concept of “country of orig<strong>in</strong>” isbecom<strong>in</strong>g <strong>in</strong>creas<strong>in</strong>gly difficult to apply to manufacturedgoods, as the various operations that comprise them,from the design of a product to the mak<strong>in</strong>g of itscomponents, their assembly <strong>and</strong> related market<strong>in</strong>g, arespread across the world. Nowadays, products are more“made <strong>in</strong> the world” than “made <strong>in</strong>” a specific country.One way of tak<strong>in</strong>g <strong>in</strong>to account the fragmentation of<strong>value</strong> <strong>cha<strong>in</strong>s</strong> <strong>and</strong> provid<strong>in</strong>g a decomposition of grossexports by domestic <strong>and</strong> foreign orig<strong>in</strong> is by measur<strong>in</strong>gthe <strong>value</strong> added imbedded <strong>in</strong> exports.Measur<strong>in</strong>g trade <strong>in</strong> <strong>value</strong> added uses both trade statistics<strong>and</strong> <strong>in</strong>ternational <strong>in</strong>put-output tables, such as thosedeveloped by <strong>IDE</strong>-<strong>JETRO</strong>, to separate the domestic contentof an export from the cost of the imported components.This methodology offers a new perspective for tradeanalysts, as it dramatically re-evaluates the importance ofsome economies as “countries of orig<strong>in</strong>”. The result is thatthe absolute <strong>value</strong> of some bilateral trade imbalances isreduced, notably that of Ch<strong>in</strong>a <strong>and</strong> the United States, whileoverall <strong>global</strong> balances rema<strong>in</strong> untouched.6
Vertical specialization, an <strong>in</strong>dicator compiled through<strong>in</strong>put-output tables, allows for an assessment of theforeign content <strong>in</strong>cluded <strong>in</strong> exports <strong>and</strong> hence the tradeoccurr<strong>in</strong>g with<strong>in</strong> <strong>in</strong>ternational production <strong>cha<strong>in</strong>s</strong>. Thelevel <strong>and</strong> growth of vertical specialization do not onlyvary substantially among the <strong>Asia</strong>n economies but alsowith<strong>in</strong> sectors.F<strong>in</strong>ally, Chapter X demonstrates, us<strong>in</strong>g Ch<strong>in</strong>a as anexample, how an export-led development strategy cantrickle down to the rest of the domestic economy. In2010, Ch<strong>in</strong>a became the second-largest economy <strong>in</strong>the world, surpass<strong>in</strong>g Japan <strong>in</strong> terms of nom<strong>in</strong>al grossdomestic product. This was the result of the rapideconomic growth which followed the launch of theReform <strong>and</strong> Open-door policy <strong>in</strong> 1978. The coastalregions of Ch<strong>in</strong>a enjoyed particularly strong growthas a result of preferential development policies heavilyorientated towards exports. However, their successhas led to significant regional disparities. A territorialrebalanc<strong>in</strong>g has been under way s<strong>in</strong>ce the early 2000s,<strong>and</strong> the centre of gravity of development has shiftedto the western regions <strong>and</strong> the North <strong>East</strong>. The nextchallenge for Ch<strong>in</strong>a is to reduce the regional <strong>in</strong>come<strong>in</strong>equalities <strong>and</strong> move from an export-dependenteconomy to a balanced system based more on domesticdem<strong>and</strong>.A glossary <strong>and</strong> a number of technical annexes at the endof the publication provide additional <strong>in</strong>formation on theterms <strong>and</strong> technical po<strong>in</strong>ts developed <strong>in</strong> the differentchapters.7
<strong>Trade</strong> Patterns <strong>and</strong> Global Value Cha<strong>in</strong>s <strong>in</strong> <strong>East</strong> <strong>Asia</strong>I. From mass dem<strong>and</strong>to <strong>global</strong> supply <strong>cha<strong>in</strong>s</strong>• Production <strong>and</strong> trade evolve <strong>in</strong> parallel, from craftsmanship <strong>and</strong> localmarkets, to <strong>global</strong> <strong>value</strong> <strong>cha<strong>in</strong>s</strong> <strong>and</strong> <strong>in</strong>ternational “trade <strong>in</strong> tasks”.• The emergence of “Factory <strong>Asia</strong>” reflects chang<strong>in</strong>g dem<strong>and</strong> for moreproduct variety <strong>in</strong> the US market.• Over time, the respective economic roles with<strong>in</strong> <strong>East</strong> <strong>Asia</strong> have changed,lead<strong>in</strong>g to a regional cluster<strong>in</strong>g of supply <strong>cha<strong>in</strong>s</strong> based on close<strong>in</strong>dustrial <strong>in</strong>terconnections.8
I. From massdem<strong>and</strong> to <strong>global</strong>supply <strong>cha<strong>in</strong>s</strong>II. Organizationof the <strong>global</strong>production processIII. Infrastructureservices <strong>in</strong> <strong>global</strong><strong>value</strong> <strong>cha<strong>in</strong>s</strong>ContentsIV. The evolutionof tariff policiesA. From trade <strong>in</strong> goods to trade <strong>in</strong> tasks: The rise of <strong>global</strong> <strong>value</strong> <strong>cha<strong>in</strong>s</strong>B. The emergence of “Factory <strong>Asia</strong>”: When supply meets dem<strong>and</strong>C. Grow<strong>in</strong>g vertical specialization <strong>in</strong> <strong>Asia</strong> <strong>and</strong> regional cluster<strong>in</strong>g of tasks101416V. Foreign direct<strong>in</strong>vestmentVI. IntegrateddiversityVII. An evolutionaryperspective onproduction networks<strong>in</strong> the <strong>Asia</strong>-US regionVIII. <strong>Trade</strong> <strong>in</strong><strong>in</strong>termediate goodsIX. Vertical trade<strong>and</strong> trade <strong>in</strong><strong>value</strong> addedX. Cross-regionalspillover ofeconomic growth9
<strong>Trade</strong> Patterns <strong>and</strong> Global Value Cha<strong>in</strong>s <strong>in</strong> <strong>East</strong> <strong>Asia</strong>A. From trade <strong>in</strong> goods to trade <strong>in</strong> tasks: The rise of <strong>global</strong> <strong>value</strong> <strong>cha<strong>in</strong>s</strong>S<strong>in</strong>ce ancient times, <strong>in</strong>ternational trade has allowedconsumers to purchase products that are not producedlocally. Production can be separated from consumption,often by great distances. The notion is summed up <strong>in</strong> thefamous example of English 18 th century economist DavidRicardo about Portuguese w<strong>in</strong>e be<strong>in</strong>g traded for Englishcloth. Countries did not need to grow grapes to enjoyw<strong>in</strong>e, he noted. Thanks to trade, they could “transform”the cloth they produced <strong>in</strong>to w<strong>in</strong>e.Before the development of mechanized transport, suchas railways <strong>and</strong> steam ships, <strong>in</strong>ternational trade wasreserved for the most expensive commodities, like spicesor silk. With mechanization, l<strong>and</strong> <strong>and</strong> sea transportbecame easier <strong>and</strong> more reliable, allow<strong>in</strong>g production<strong>and</strong> consumption to be more geographically dissociated.The 19th century <strong>in</strong>dustrial revolution saw also the riseof large <strong>in</strong>dustries, with workers perform<strong>in</strong>g specializedtasks <strong>and</strong> progressively supplant<strong>in</strong>g traditional craftsmen.While craftsmen worked close to their customers, usually<strong>in</strong> the same town, the <strong>in</strong>dustrial revolution created large<strong>in</strong>dustrial agglomerations able to serve national marketsthanks to a new network of railways <strong>and</strong> <strong>in</strong>tercity roads(see Figure 1).The key to higher <strong>in</strong>dustrial productivity was toconcentrate the various tasks <strong>in</strong>volved under a s<strong>in</strong>gleroof. By specializ<strong>in</strong>g <strong>in</strong> one or a small number of tasks,each worker could focus his/her energy <strong>and</strong> therebyperform more efficiently. But without proximity, it wouldhave been impossible to coord<strong>in</strong>ate the efforts of thevarious workers, or to comb<strong>in</strong>e their <strong>in</strong>puts <strong>in</strong>to a s<strong>in</strong>gleproduct. Thus, production rema<strong>in</strong>ed largely enclosedwith<strong>in</strong> national borders <strong>and</strong> trade <strong>patterns</strong> reflected therespective productive specializations. As World <strong>Trade</strong>Organization (WTO) Director-General Pascal Lamy hasnoted: “In the 19th century, when Ricardo developedwhat was to become the foundations of <strong>in</strong>ternationaltrade theory, countries exported what they produced. Infact, the <strong>in</strong>dustrial revolution took root <strong>in</strong> countries thathad coal m<strong>in</strong>es <strong>and</strong> iron ore. A Portuguese entrepreneurimport<strong>in</strong>g a steam eng<strong>in</strong>e from Engl<strong>and</strong> would knowthat everyth<strong>in</strong>g, from the steel of the wheels to the boilerpressure gauge, came from the United K<strong>in</strong>gdom.” 1Another <strong>in</strong>dustrial quantum leap took place <strong>in</strong> the1990s, thanks to the <strong>in</strong>formation technology (IT)revolution <strong>and</strong> the conjunction of a series of political <strong>and</strong><strong>in</strong>stitutional breakthroughs. Together these facilitatedthe <strong>in</strong>ternationalization of <strong>in</strong>dustrial processes, open<strong>in</strong>gthe way to what became <strong>global</strong> manufactur<strong>in</strong>g. Cheaper<strong>and</strong> faster <strong>in</strong>tercont<strong>in</strong>ental communication allowed farflungbus<strong>in</strong>esses <strong>and</strong> production centres to coord<strong>in</strong>atemore easily, lead<strong>in</strong>g to the unbundl<strong>in</strong>g of the productionprocess <strong>and</strong> its <strong>in</strong>ternational fragmentation. The USauthor Thomas Friedman has described these trendsas forces that have “flattened” the world. Among themare the birth of the Internet, the development of workflowsoftware, “<strong>in</strong>-form<strong>in</strong>g” <strong>and</strong> advances <strong>in</strong> digital, mobile,personal <strong>and</strong> virtual communication technologies.On the <strong>in</strong>stitutional side, tariff cuts <strong>and</strong> multilateralagreements boosted trade. For example, trade <strong>in</strong><strong>in</strong>termediary products, the backbone of geographicallyfragmented supply <strong>cha<strong>in</strong>s</strong>, was facilitated by <strong>in</strong>ternationalaccords, such as the WTO Information TechnologyAgreement (ITA) 2 on computers, semi-conductors <strong>and</strong> ahost of related goods. <strong>Asia</strong> also benefitted from regionaltrade pacts, <strong>in</strong>clud<strong>in</strong>g those established under theAssociation of Southeast <strong>Asia</strong>n Nations (ASEAN) <strong>and</strong>the <strong>Asia</strong> Pacific Economic Cooperation forum (APEC).The <strong>in</strong>tegrated factory floor, which had dom<strong>in</strong>atedmanufactur<strong>in</strong>g s<strong>in</strong>ce the 19th century, has been replacedwith a network of <strong>in</strong>dividual suppliers specializ<strong>in</strong>g <strong>in</strong>specific services or phases of production. In this secondgreat unbundl<strong>in</strong>g, as def<strong>in</strong>ed by Richard Baldw<strong>in</strong> of theGraduate Institute of International Studies <strong>in</strong> Geneva,production is “sliced <strong>and</strong> diced” <strong>in</strong>to separate fragmentsthat can be spread around the globe. 3 Pr<strong>in</strong>cetonUniversity economists Gene Grossman <strong>and</strong> EstebanRossi-Hansberg 4 have called this new paradigm“trade <strong>in</strong> tasks”. Countries no longer export exclusivelyf<strong>in</strong>ished products, but tend to specialize <strong>in</strong> specificstages of the production process. These various stepsto obta<strong>in</strong> f<strong>in</strong>ished products can be associated throughthe notion of a “<strong>value</strong> cha<strong>in</strong>”, which refers to the entiresequence of productive (i.e. <strong>value</strong>-added) activities, 5from the conception of a product to its manufactur<strong>in</strong>g<strong>and</strong> commercialization. The possibility of slic<strong>in</strong>g up<strong>and</strong> optimiz<strong>in</strong>g <strong>value</strong> cha<strong>in</strong> activities among multiplecompanies <strong>and</strong> various geographical locations haseven spawned a broader term - the “<strong>global</strong> <strong>value</strong> cha<strong>in</strong>”(GVC). With specialization <strong>in</strong> specific tasks <strong>and</strong> theirclose <strong>in</strong>tegration <strong>in</strong>to a highly coord<strong>in</strong>ated bus<strong>in</strong>essmodel, these <strong>cha<strong>in</strong>s</strong> of related activities result <strong>in</strong> the10
Box 2. About the verticality of production <strong>and</strong> tradeBasically, vertical <strong>in</strong>tegration is a synonym for corporate ownership <strong>and</strong> control. One of the pioneers was Henry Ford, who soughtto m<strong>in</strong>imize costs <strong>and</strong> <strong>in</strong>dustrial risks by acquir<strong>in</strong>g various firms <strong>in</strong>volved <strong>in</strong> the production process of his cars. This bus<strong>in</strong>essmodel was adopted by other large companies with the emergence of mass production <strong>in</strong> the early 20 th century. The aim was to<strong>in</strong>corporate <strong>in</strong>to a s<strong>in</strong>gle <strong>in</strong>dustrial structure the production of raw materials, the mach<strong>in</strong>es needed for their transformation, <strong>and</strong>transportation to <strong>and</strong> from the factories. Vertical <strong>in</strong>tegration was at the core of Japan’s <strong>in</strong>dustrialization, with conglomerates knownas “Zaibatsu” conta<strong>in</strong><strong>in</strong>g hold<strong>in</strong>g companies controll<strong>in</strong>g banks <strong>and</strong> <strong>in</strong>dustrial subsidiaries.Vertical <strong>in</strong>tegration is about corporate strategy <strong>and</strong> relates to the “make” or “buy” decision 7 companies <strong>in</strong>variably face. Whileoutsourc<strong>in</strong>g is an example of the “buy” approach (act of purchas<strong>in</strong>g from an external supplier), vertical <strong>in</strong>tegration <strong>in</strong>volves an“<strong>in</strong>sourc<strong>in</strong>g” or “make” option (choice of produc<strong>in</strong>g an item or keep<strong>in</strong>g a specific activity <strong>in</strong>ternally). Reduced operational costs<strong>and</strong> better coord<strong>in</strong>ation of the supply cha<strong>in</strong> are the key benefits sought by vertically <strong>in</strong>tegrated enterprises.Vertical <strong>in</strong>tegration can be achieved not only through direct ownership, but also by means of contractual relationships (at “arm’slength”) with suppliers.In Figure 3 below, the orange zone highlights the different functions that have been gathered with<strong>in</strong> the same company. Allcorrespond<strong>in</strong>g activities are controlled <strong>and</strong> managed <strong>in</strong>ternally. The assembly operation may be executed by a secondary companyowned by the ma<strong>in</strong> firm, or by one contractually dependent upon it; however, they both act as one unique entity with<strong>in</strong> the supplycha<strong>in</strong>.While vertical <strong>in</strong>tegration relates to structural l<strong>in</strong>kages between <strong>in</strong>dustrial firms <strong>and</strong> key bus<strong>in</strong>ess processes, the concept ofvertical specialization, as developed by Hummels et al. (2001), outl<strong>in</strong>es the degree of specialization of the different economies<strong>in</strong>volved <strong>in</strong> the <strong>in</strong>ternational production cha<strong>in</strong>. It is characterized <strong>and</strong> measured as the import content (<strong>in</strong> goods <strong>and</strong> services)embodied <strong>in</strong> exported goods (see Chapter IX for more details).Figure 3An example of vertical <strong>in</strong>tegrationI. From massdem<strong>and</strong> to <strong>global</strong>supply <strong>cha<strong>in</strong>s</strong>II. Organizationof the <strong>global</strong>production processIII. Infrastructureservices <strong>in</strong> <strong>global</strong><strong>value</strong> <strong>cha<strong>in</strong>s</strong>IV. The evolutionof tariff policiesV. Foreign direct<strong>in</strong>vestmentMaterialsComponentssuppliersVI. IntegrateddiversityProcurementResearch <strong>and</strong>DevelopmentVII. An evolutionaryperspective onproduction networks<strong>in</strong> the <strong>Asia</strong>-US regionOperations:• Intermediate manufactur<strong>in</strong>g• AssemblyMarket<strong>in</strong>gInternalsupplycha<strong>in</strong>VIII. <strong>Trade</strong> <strong>in</strong><strong>in</strong>termediate goodsSalesIX. Vertical trade<strong>and</strong> trade <strong>in</strong><strong>value</strong> addedMarket exchangeInternal processSource: WTO Secretariat.F<strong>in</strong>ishedproductscustomersX. Cross-regionalspillover ofeconomic growth13
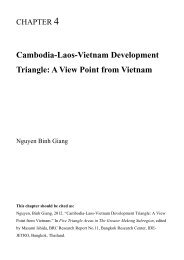
<strong>Trade</strong> Patterns <strong>and</strong> Global Value Cha<strong>in</strong>s <strong>in</strong> <strong>East</strong> <strong>Asia</strong>C. Grow<strong>in</strong>g vertical specialization <strong>in</strong> <strong>Asia</strong> <strong>and</strong> regional cluster<strong>in</strong>g of tasksWhen <strong>in</strong>vest<strong>in</strong>g <strong>in</strong> <strong>East</strong> <strong>Asia</strong>, <strong>in</strong>ternational firms pursuetwo different types of objective. Some respond to thelogic of trade <strong>in</strong> tasks <strong>and</strong> geographical fragmentationby stag<strong>in</strong>g production along a <strong>global</strong> supply cha<strong>in</strong>(vertical specialization). Others produce the same typeof goods that they do at home, with a view to enter<strong>in</strong>g the<strong>Asia</strong>n market us<strong>in</strong>g the “build-where-you-sell” strategy(horizontal diversification of production). Consumerelectronics correspond more to the vertical specializationpattern, where lead firms, sell<strong>in</strong>g br<strong>and</strong>ed products <strong>in</strong> f<strong>in</strong>almarkets, place orders for key components with suppliers<strong>and</strong> have them assembled <strong>in</strong> a third, low-cost, country. 8The automobile <strong>in</strong>dustry is a typical example of horizontaldiversification; a Toyota car produced <strong>in</strong> Thail<strong>and</strong> maydiffer only slightly from the same model built <strong>in</strong> Japan. 9The division between the two types of <strong>in</strong>vestment is notclear-cut, <strong>and</strong> many foreign affiliates operat<strong>in</strong>g <strong>in</strong> <strong>East</strong><strong>Asia</strong> have progressively adopted the characteristicsof both vertical <strong>and</strong> horizontal mult<strong>in</strong>ationals. 10 Verticalspecialization started first. In the 1970s, accord<strong>in</strong>g toSturgeon <strong>and</strong> Kawakami (2010), US semi-conductorfirms, whose production was very labour <strong>in</strong>tensive,located assembly plants <strong>in</strong> <strong>East</strong> <strong>and</strong> South-<strong>East</strong> <strong>Asia</strong>, <strong>and</strong>Japanese companies located low-cost transistor radioproduction <strong>in</strong> Ch<strong>in</strong>ese Taipei <strong>and</strong> <strong>in</strong> Hong Kong (Ch<strong>in</strong>a).As household <strong>in</strong>come <strong>in</strong> develop<strong>in</strong>g <strong>Asia</strong> rose, so didforeign direct <strong>in</strong>vestment for horizontal diversification. In2001, only 40 per cent of Japanese companies’ overseasproduction <strong>in</strong> <strong>Asia</strong> went to local consumers. Now theproportion is 62 per cent <strong>and</strong> grow<strong>in</strong>g as export-oriented<strong>in</strong>dustries based <strong>in</strong> low-cost <strong>Asia</strong>n countries build adomestic market <strong>and</strong> related consumption capacity.Both horizontal <strong>and</strong> vertical production <strong>patterns</strong> cancoexist, <strong>and</strong> the flexibility <strong>in</strong> sourc<strong>in</strong>g components fromvarious countries, while export<strong>in</strong>g the result<strong>in</strong>g f<strong>in</strong>algoods, is closely l<strong>in</strong>ked to trade policies. As shown <strong>in</strong>Figure 6, Japanese automobile assemblers procure keyparts from four ASEAN countries, tak<strong>in</strong>g advantage ofthe ASEAN Free <strong>Trade</strong> Area (AFTA).Figure 6Complementary parts supply system of an automobile assembler <strong>in</strong> ASEANthail<strong>and</strong>• Press parts• Frame panels• Electronic parts• Interior parts• Eng<strong>in</strong>e partsAFTAphilipp<strong>in</strong>es• Eng<strong>in</strong>e fuel system• Emission dress parts• Eng<strong>in</strong>e electronic parts• Suspension parts• MT missionAFTA-CEPT AFTA-CEPT AFTA-CEPTmalaysia• Instrumental panelassembly• Bumper• Drive shaftAFTA<strong>in</strong>donesia• Cyl<strong>in</strong>der head assembly• Cyl<strong>in</strong>der block• Eng<strong>in</strong>e valve• Steer<strong>in</strong>g h<strong>and</strong>le• AT missionNote: the ASEAN Free <strong>Trade</strong> Area - Common Effective Preferential Tariff (AFTA-CEPT) is a cooperative arrangement among ASEAN member states to reduce <strong>in</strong>traregionaltariffs <strong>and</strong> remove non-tariff barriers.Source: Hiratsuka (2010).16
EndnotesI. From massdem<strong>and</strong> to <strong>global</strong>supply <strong>cha<strong>in</strong>s</strong>1Inaugural speech to the conference on “Globalization of theIndustrial Production Cha<strong>in</strong>s <strong>and</strong> Measur<strong>in</strong>g International <strong>Trade</strong><strong>in</strong> Value Added” at the Senate <strong>in</strong> Paris on 15 October 2010.2The M<strong>in</strong>isterial Declaration on <strong>Trade</strong> <strong>in</strong> InformationTechnology Products (ITA) was concluded at the WTOS<strong>in</strong>gapore M<strong>in</strong>isterial Conference <strong>in</strong> December 1996. The ITAelim<strong>in</strong>ates duties on IT products covered by the Agreement.Develop<strong>in</strong>g country participants were granted additional timeto implement their commitments for some products.3See Baldw<strong>in</strong> (2006).4Grossman <strong>and</strong> Rossi-Hansberg (2006).5Sturgeon (2001).6Porter (1985).7The “make-or-buy” decision process was extensivelydeveloped by Williamson (1991).8The classical example is the iPod, designed <strong>and</strong> developedby a US firm <strong>and</strong> “made <strong>in</strong> Ch<strong>in</strong>a” out of US or Koreancomponents <strong>and</strong> licences which constitute most of the factorycost of the appliance.9“Leav<strong>in</strong>g home: Japan’s big companies are shipp<strong>in</strong>gproduction abroad”, The Economist, 18 Nov 2010.10See Hiratsuka (2010).II. Organizationof the <strong>global</strong>production processIII. Infrastructureservices <strong>in</strong> <strong>global</strong><strong>value</strong> <strong>cha<strong>in</strong>s</strong>IV. The evolutionof tariff policiesV. Foreign direct<strong>in</strong>vestmentVI. IntegrateddiversityVII. An evolutionaryperspective onproduction networks<strong>in</strong> the <strong>Asia</strong>-US regionVIII. <strong>Trade</strong> <strong>in</strong><strong>in</strong>termediate goodsIX. Vertical trade<strong>and</strong> trade <strong>in</strong><strong>value</strong> addedX. Cross-regionalspillover ofeconomic growth17
<strong>Trade</strong> Patterns <strong>and</strong> Global Value Cha<strong>in</strong>s <strong>in</strong> <strong>East</strong> <strong>Asia</strong>A. Outsourc<strong>in</strong>g <strong>and</strong> offshor<strong>in</strong>g: Firms go beyond national boundariesAs production becomes <strong>in</strong>creas<strong>in</strong>gly complex <strong>and</strong>fragmented, specialization on core activities <strong>and</strong>outsourc<strong>in</strong>g have become <strong>in</strong>evitable. As part of theiroverall bus<strong>in</strong>ess strategy, enterprises may outsource oneor more of their productive activities, either with<strong>in</strong> thecountry or abroad (offshor<strong>in</strong>g). A reliable <strong>and</strong> conducive<strong>in</strong>ternational trad<strong>in</strong>g environment ensures the unh<strong>in</strong>dered<strong>and</strong> efficient flow of <strong>in</strong>vestment, goods <strong>and</strong> servicesamong nations. Through successive negotiations underGATT/WTO, trade barriers have been significantlyreduced or elim<strong>in</strong>ated (see Chapter IV on tariff policies)<strong>and</strong> a stable, rules-based trad<strong>in</strong>g system has guaranteed<strong>and</strong> encouraged firms to engage <strong>in</strong>ternationally withconfidence. The availability of efficient <strong>and</strong> affordablelogistics, transport <strong>and</strong> communication services supportsthis <strong>global</strong> production system.Offshore sourc<strong>in</strong>g or cross-border productionarrangements may take place between enterprises thatare either related (mult<strong>in</strong>ationals enterprises (MNEs)<strong>and</strong> their affiliates) or that have no formal relationship <strong>in</strong>ownership (see Figure 1). In the latter case, enterprisesmay enter <strong>in</strong>to contractual agreements or establish jo<strong>in</strong>tventures. The fragmentation of the production processhas also created bus<strong>in</strong>ess opportunities for small <strong>and</strong>medium-sized enterprises (SMEs).Intra-firm trade is important for <strong>global</strong> manufactur<strong>in</strong>gactivities <strong>in</strong>volv<strong>in</strong>g either partly or wholly-owned affiliates.Data on <strong>in</strong>tra-firm trade are not systematically collected<strong>and</strong> only a h<strong>and</strong>ful of countries report <strong>in</strong>formationgathered from firm surveys. The available <strong>in</strong>formation<strong>in</strong>dicates, however, that this trade is quite substantial. In2008, for example, merch<strong>and</strong>ise exports of US MNEsto their foreign affiliates represented 18 per cent ofthe country’s total exports. Imports of MNEs from theirforeign affiliates accounted for 13 per cent of the totalUS merch<strong>and</strong>ise imports. 1Figure 1Typology of outsourc<strong>in</strong>g <strong>and</strong> offshor<strong>in</strong>g strategiesDomesticForeignOutsourc<strong>in</strong>gOffshor<strong>in</strong>gOther FirmsOutsourc<strong>in</strong>gOffshore-Outsourc<strong>in</strong>gSame CompanyIn-houseProductionForeign DirectInvestmentSource: WTO Secretariat.20
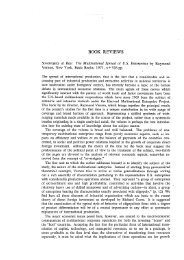
B. Process<strong>in</strong>g zones <strong>in</strong> develop<strong>in</strong>g countries: Where <strong>global</strong> manufactur<strong>in</strong>gtakes placeI. From massdem<strong>and</strong> to <strong>global</strong>supply <strong>cha<strong>in</strong>s</strong>Enterprises that outsource are usually located <strong>in</strong>advanced economies, while their correspond<strong>in</strong>gcounterparts are often <strong>in</strong> develop<strong>in</strong>g economies. Inmany countries, most of the process<strong>in</strong>g <strong>and</strong> assembl<strong>in</strong>gactivities take place <strong>in</strong> earmarked areas with specialadm<strong>in</strong>istrative <strong>and</strong> regulatory status to promote trade<strong>and</strong> <strong>in</strong>vestment. Although these areas can have differentnames <strong>in</strong> different countries, the most widely usedterm is “export process<strong>in</strong>g zone” (EPZ). As def<strong>in</strong>ed bythe International Labour Organization (ILO), EPZs are“<strong>in</strong>dustrial zones with special <strong>in</strong>centives set up to attractforeign <strong>in</strong>vestors, <strong>in</strong> which imported materials undergosome degree of process<strong>in</strong>g before be<strong>in</strong>g re-exported”. 2They have become all-embrac<strong>in</strong>g. Aga<strong>in</strong> accord<strong>in</strong>g toILO, EPZs “have evolved from <strong>in</strong>itial assembly <strong>and</strong> simpleprocess<strong>in</strong>g activities to <strong>in</strong>clude high tech <strong>and</strong> scienceparks, f<strong>in</strong>ance zones, logistics centres <strong>and</strong> even touristresorts”. 3 Many develop<strong>in</strong>g economies consider EPZs tobe an <strong>in</strong>tegral part of their export-led growth strategies.In 2006, the latest year for which estimates are available,3,500 EPZs were operat<strong>in</strong>g <strong>in</strong> 130 countries, provid<strong>in</strong>gwork for 66 million people (see Table 1).II. Organizationof the <strong>global</strong>production processIII. Infrastructureservices <strong>in</strong> <strong>global</strong><strong>value</strong> <strong>cha<strong>in</strong>s</strong>Table 1Estimates of the development of export process<strong>in</strong>g zonesIV. The evolutionof tariff policies1975 1986 1997 2002 2006Number of countries with EPZs 25 47 93 116 130Number of EPZs or similar type of Zones 79 176 845 3000 3500Employment (millions of workers)of which:......22.54366V. Foreign direct<strong>in</strong>vestmentCh<strong>in</strong>aOther countries with data availableSource: Boyenge (2007)....0.8...1.9184.530134026VI. IntegrateddiversityThe earliest EPZ was European, the Shannon Free Zoneof Irel<strong>and</strong>, which was established <strong>in</strong> 1959. The first <strong>Asia</strong>nEPZ, the K<strong>and</strong>la EPZ, was set up <strong>in</strong> India <strong>in</strong> 1965. In the1960s, Ch<strong>in</strong>ese Taipei attracted foreign firms to <strong>in</strong>vest<strong>in</strong> the assembly of semi-conductors, <strong>and</strong> <strong>in</strong> 1970, theRepublic of Korea <strong>in</strong>cluded EPZs <strong>in</strong> its export-led growthstrategy. In subsequent years EPZs <strong>and</strong> similar zonesmushroomed <strong>in</strong> the Philipp<strong>in</strong>es, Malaysia, Sri Lanka,Thail<strong>and</strong>, Bangladesh <strong>and</strong> Pakistan, to name but a few.In the early 1980s, follow<strong>in</strong>g its decision to vigorouslypursue an export-oriented policy <strong>and</strong> attract foreign<strong>in</strong>vestment, Ch<strong>in</strong>a established five special economiczones (SEZs), which effectively saw it jo<strong>in</strong> the <strong>global</strong>economic community.Outside <strong>Asia</strong>, EPZs have also become very important forSouth <strong>and</strong> Central America <strong>and</strong> the Caribbean region. InAfrica, a number of countries have embarked on policiesof open<strong>in</strong>g up their economies to foreign <strong>in</strong>vestorsthrough EPZs (see Figure 2).Based on balance of payments (BOP) statistics, it isestimated that about one-fifth of develop<strong>in</strong>g economies’exports come from EPZs, while the share on the importside is some 13 per cent (see Figure 3). Over the 2000-2008 period, Ch<strong>in</strong>a accounted for about 67 per centof all reported exports from <strong>in</strong>ward process<strong>in</strong>g – goodsimported duty-free for subsequent process<strong>in</strong>g <strong>and</strong> reexport– while Mexico represented another 18 per cent.VII. An evolutionaryperspective onproduction networks<strong>in</strong> the <strong>Asia</strong>-US regionVIII. <strong>Trade</strong> <strong>in</strong><strong>in</strong>termediate goodsIX. Vertical trade<strong>and</strong> trade <strong>in</strong><strong>value</strong> addedX. Cross-regionalspillover ofeconomic growth21
<strong>Trade</strong> Patterns <strong>and</strong> Global Value Cha<strong>in</strong>s <strong>in</strong> <strong>East</strong> <strong>Asia</strong>Figure 2Economies with export process<strong>in</strong>g zones <strong>and</strong> shares of goods for process<strong>in</strong>g <strong>in</strong> exports, 2006 or most recent year (percentage)FYR Macedonia60%Honduras55%Mexico45%Nicaragua40%Costa RicaDom<strong>in</strong>ican Republic65%Cape Verde14%Morocco25%54%Aruba Cote d’Ivoire95% 1%Albania60%Lebanon20%Egypt23%U.A.E.11%Bangladesh1%Ch<strong>in</strong>a47%Republic of Korea8%Philipp<strong>in</strong>es27%Indonesia5%Bolivia4%Chile3%Madagascar56%Swazil<strong>and</strong>7%Economies with EPZsSources: ILO <strong>and</strong> WTO Secretariat.Fiji5%22
Ch<strong>in</strong>a’s customs trade figures show that <strong>in</strong> 2009 nearlyhalf of its exports orig<strong>in</strong>ated from process<strong>in</strong>g zoneswhile one-third of its imports were bound to such zones.Around two-thirds of Ch<strong>in</strong>a’s process<strong>in</strong>g trade wasundertaken by foreign owned enterprises.As a result of such strong export-oriented activities <strong>in</strong>its EPZs, Ch<strong>in</strong>a became the world’s lead<strong>in</strong>g exporter ofmanufactured products <strong>in</strong> 2008, <strong>and</strong> the leader <strong>in</strong> totalmerch<strong>and</strong>ise exports <strong>in</strong> 2009.Currently, a considerable part of the exports of manydevelop<strong>in</strong>g economies orig<strong>in</strong>ate <strong>in</strong> EPZs (see Figure 2).The overall impact on their economies is substantial, withthe result<strong>in</strong>g <strong>value</strong> added (approximately the differencebetween the <strong>value</strong> of the exports of processed products<strong>and</strong> the cost of the imports of <strong>in</strong>termediate <strong>in</strong>puts)equall<strong>in</strong>g some 30 to 35 per cent of the exportedproducts.Figure 3Goods for <strong>in</strong>ward process<strong>in</strong>g <strong>in</strong> develop<strong>in</strong>g economies’ total exports <strong>and</strong> imports, 2000-2008(<strong>in</strong> billions of US$)I. From massdem<strong>and</strong> to <strong>global</strong>supply <strong>cha<strong>in</strong>s</strong>II. Organizationof the <strong>global</strong>production processIII. Infrastructureservices <strong>in</strong> <strong>global</strong><strong>value</strong> <strong>cha<strong>in</strong>s</strong>60005000ExportsIV. The evolutionof tariff policies400030002000V. Foreign direct<strong>in</strong>vestment100002000 2001 2002 2003 2004 2005 2006 2007 2008VI. Integrateddiversity60005000Goods result<strong>in</strong>g from <strong>in</strong>ward process<strong>in</strong>gOther goodsImportsVII. An evolutionaryperspective onproduction networks<strong>in</strong> the <strong>Asia</strong>-US region400030002000VIII. <strong>Trade</strong> <strong>in</strong><strong>in</strong>termediate goods100002000 2001 2002 2003 2004 2005 2006 2007 2008IX. Vertical trade<strong>and</strong> trade <strong>in</strong><strong>value</strong> addedGoods for <strong>in</strong>ward process<strong>in</strong>gOther goodsSources: IMF balance of payments statistics <strong>and</strong> WTO estimates.X. Cross-regionalspillover ofeconomic growth23
<strong>Trade</strong> Patterns <strong>and</strong> Global Value Cha<strong>in</strong>s <strong>in</strong> <strong>East</strong> <strong>Asia</strong>C. Bus<strong>in</strong>ess process outsourc<strong>in</strong>g <strong>and</strong> computer servicesOffshore outsourc<strong>in</strong>g is not conf<strong>in</strong>ed to the manufactur<strong>in</strong>gsector. Outsourced service activities range from simpleback <strong>and</strong> front office rout<strong>in</strong>es to more complex research<strong>and</strong> development (R&D) work. Data process<strong>in</strong>g,call centres, virtual assistance, legal support (legaltranscription, draft<strong>in</strong>g contracts, legal representation,etc), medical support (medical transcription, <strong>in</strong>terpret<strong>in</strong>gx-rays, etc), f<strong>in</strong>ance <strong>and</strong> account<strong>in</strong>g, software <strong>and</strong>applications development <strong>and</strong> R&D are all activities thatenterprises can assign to foreign firms. All these activitiesare designated as bus<strong>in</strong>ess process outsourc<strong>in</strong>g (BPO)or <strong>in</strong>formation technology-enabled services (ITES).Of the <strong>Asia</strong>n develop<strong>in</strong>g economies, it is India <strong>and</strong>the Philipp<strong>in</strong>es that are benefit<strong>in</strong>g <strong>in</strong>creas<strong>in</strong>gly fromoffshored computer <strong>and</strong> IT-enabled bus<strong>in</strong>ess services.It is estimated that India earned US$ 36.4 billiondur<strong>in</strong>g the 2008-09 f<strong>in</strong>ancial year from computer <strong>and</strong>ITES/BPO services. 4 This is equivalent to 34 per centof the total commercial services India exported <strong>in</strong> thisperiod. Computer services alone generated US$ 26.6billion, while BPO services brought <strong>in</strong> US$ 8.4 billion.In the Philipp<strong>in</strong>es, the ITES/BPO <strong>in</strong>dustry, whichis predom<strong>in</strong>antly composed of call centre services(account<strong>in</strong>g for nearly 70 per cent of related exports),is estimated to have grown by 46 per cent annuallybetween 2004 <strong>and</strong> 2008. 5 Accord<strong>in</strong>g to the Bus<strong>in</strong>essProcess Association of the Philipp<strong>in</strong>es (BPAP), theBPO <strong>in</strong>dustry is estimated to have earned US$ 7.3billion <strong>in</strong> revenue <strong>and</strong> provided 442,164 jobs.D. Logistics services <strong>and</strong> distribution: The unique role of Hong Kong (Ch<strong>in</strong>a)<strong>and</strong> S<strong>in</strong>gaporeFollow<strong>in</strong>g changes <strong>in</strong> the organization of production(i.e. outsourc<strong>in</strong>g/offshor<strong>in</strong>g), enterprises have become<strong>in</strong>creas<strong>in</strong>gly dependent on logistics services. Logisticsservices <strong>in</strong>clude core elements such as cargo h<strong>and</strong>l<strong>in</strong>g,storage <strong>and</strong> warehous<strong>in</strong>g, transport agency services<strong>and</strong> related freight logistics services as well as noncoreservices such as packag<strong>in</strong>g <strong>and</strong> supply-cha<strong>in</strong>consult<strong>in</strong>g.Due to their excellent <strong>in</strong>frastructure <strong>and</strong> connectivity,Hong Kong (Ch<strong>in</strong>a) <strong>and</strong> S<strong>in</strong>gapore play core roles <strong>in</strong> the<strong>global</strong> supply cha<strong>in</strong> by offer<strong>in</strong>g logistics <strong>and</strong> entrepôtservices. This is <strong>in</strong> addition to their productive capacity.Trad<strong>in</strong>g companies <strong>in</strong> Hong Kong (Ch<strong>in</strong>a) <strong>and</strong> S<strong>in</strong>gaporematch buyers <strong>and</strong> sellers <strong>in</strong> different markets. Besidesthis <strong>in</strong>termediation activity, companies <strong>in</strong> S<strong>in</strong>gapore <strong>and</strong>Hong Kong (Ch<strong>in</strong>a) also perform specialized services(such as quality control or simple manufactur<strong>in</strong>g orprocess<strong>in</strong>g, like sort<strong>in</strong>g or packag<strong>in</strong>g). This activity hasenabled Hong Kong (Ch<strong>in</strong>a) to become the world’slead<strong>in</strong>g re-export specialist. In 2009, re-exportsrepresented 95 per cent of Hong Kong’s (Ch<strong>in</strong>a) totalexports, or US$ 313 billion. In S<strong>in</strong>gapore as well, reexportsare fast ga<strong>in</strong><strong>in</strong>g <strong>in</strong> importance. The share of reexports<strong>in</strong> total exports rose from 34 per cent <strong>in</strong> 1990to 49 per cent <strong>in</strong> 2009. The comb<strong>in</strong>ed re-exports ofHong Kong (Ch<strong>in</strong>a) <strong>and</strong> S<strong>in</strong>gapore represented 11 percent of <strong>Asia</strong>’s total merch<strong>and</strong>ise trade <strong>in</strong> 2009.Numerous foreign affiliates <strong>in</strong> Hong Kong (Ch<strong>in</strong>a) <strong>and</strong>S<strong>in</strong>gapore serve as regional headquarters <strong>in</strong> the <strong>East</strong><strong>Asia</strong>n region, provid<strong>in</strong>g a wide range of bus<strong>in</strong>ess services(bus<strong>in</strong>ess coord<strong>in</strong>ation, sourc<strong>in</strong>g of raw <strong>and</strong> semi-f<strong>in</strong>ishedcomponents, technical support, f<strong>in</strong>anc<strong>in</strong>g, market<strong>in</strong>g, etc.)to their subsidiaries throughout the region.The share of <strong>in</strong>termediate goods <strong>in</strong> the total re-exportsof Hong Kong (Ch<strong>in</strong>a) has risen significantly <strong>in</strong> recentyears, from 48 per cent <strong>in</strong> 2000 to 58 per cent <strong>in</strong> 2008.This <strong>in</strong>crease reflects the importance of commercialexchanges between regional production networks.While the orig<strong>in</strong> of imports is relatively diversified, reexportsfrom Hong Kong (Ch<strong>in</strong>a) are ma<strong>in</strong>ly bound forCh<strong>in</strong>a (43 per cent of re-exports <strong>in</strong> raw materials <strong>and</strong>manufactures) (see Figure 4). Tak<strong>in</strong>g advantage of itsproximity to the coastal prov<strong>in</strong>ces, Hong Kong (Ch<strong>in</strong>a)has also shifted its manufactur<strong>in</strong>g tasks to the ma<strong>in</strong>l<strong>and</strong>by re-export<strong>in</strong>g an <strong>in</strong>creas<strong>in</strong>g share of <strong>in</strong>termediate<strong>in</strong>puts for outward process<strong>in</strong>g. Ch<strong>in</strong>ese Taipei, with ashare of 16 per cent, is also a major market for re-exportsof <strong>in</strong>termediate goods from Hong Kong (Ch<strong>in</strong>a).24
Figure 4Hong Kong’s (Ch<strong>in</strong>a) imports <strong>and</strong> re-exports of <strong>in</strong>termediate goods, by orig<strong>in</strong> <strong>and</strong> dest<strong>in</strong>ation (percentage)I. From massdem<strong>and</strong> to <strong>global</strong>supply <strong>cha<strong>in</strong>s</strong>1009080Orig<strong>in</strong>sII. Organizationof the <strong>global</strong>production process7060504030201001995 2009Republic of KoreaPhilipp<strong>in</strong>esCh<strong>in</strong>ese TaipeiMalaysiaJapanIndonesiaIndiaCh<strong>in</strong>aOthersIII. Infrastructureservices <strong>in</strong> <strong>global</strong><strong>value</strong> <strong>cha<strong>in</strong>s</strong>IV. The evolutionof tariff policiesHONG KONG(CHINA)V. Foreign direct<strong>in</strong>vestmentVI. Integrateddiversity100908070Dest<strong>in</strong>ationsVII. An evolutionaryperspective onproduction networks<strong>in</strong> the <strong>Asia</strong>-US region60504030VIII. <strong>Trade</strong> <strong>in</strong><strong>in</strong>termediate goods201001995 2009Ch<strong>in</strong>aOthersIX. Vertical trade<strong>and</strong> trade <strong>in</strong><strong>value</strong> addedSource: Based on UN Comtrade Database.X. Cross-regionalspillover ofeconomic growth25
<strong>Trade</strong> Patterns <strong>and</strong> Global Value Cha<strong>in</strong>s <strong>in</strong> <strong>East</strong> <strong>Asia</strong>Hong Kong (Ch<strong>in</strong>a) also plays a prom<strong>in</strong>ent part <strong>in</strong>the Ch<strong>in</strong>ese supply cha<strong>in</strong> system by facilitat<strong>in</strong>g thetranshipment of Ch<strong>in</strong>ese <strong>in</strong>termediate goods from oneCh<strong>in</strong>ese location to another, pr<strong>in</strong>cipally from one EPZ toanother.This is done through a round trip flow known as reimports,“goods imported <strong>in</strong> the same state as previouslyexported”. 6 Many Ch<strong>in</strong>ese EPZs f<strong>in</strong>d that it costs less<strong>and</strong> saves time to transport products through HongKong (Ch<strong>in</strong>a) because of its advanced logistics <strong>and</strong><strong>in</strong>frastructure capacity. The EPZs can also benefit fromtax rebates when goods are exported after process<strong>in</strong>g<strong>and</strong> from preferential tax regimes when <strong>in</strong>termediategoods are imported for process<strong>in</strong>g. Ch<strong>in</strong>a is by far theworld’s major re-importer. Its re-imports have risen morethan 12 times s<strong>in</strong>ce 2000 <strong>and</strong> are becom<strong>in</strong>g a significantcomponent of its trade (see Figure 5). They representedalmost 9 per cent of its total merch<strong>and</strong>ise imports <strong>in</strong>2009.Figure 5Re-imports of Ch<strong>in</strong>a10100990880Share (percentage)765437060504030Value (billions of US$)22011002000 2001 2002 2003 2004 2005 2006 2007 2008 20090Share of re-imports <strong>in</strong> Ch<strong>in</strong>atotal importsCh<strong>in</strong>a re-imports from Ch<strong>in</strong>aSource: Based on UN Comtrade Database.26
EndnotesI. From massdem<strong>and</strong> to <strong>global</strong>supply <strong>cha<strong>in</strong>s</strong>1See Barefoot <strong>and</strong> Mataloni, (2010).2See http://www.ilo.org/public/english/dialogue/sector/themes/epz/epzs.htm/.3Ibid.4See Reserve Bank of India (2008-2009)5See Bus<strong>in</strong>ess Process Association of the Philipp<strong>in</strong>es (2010).6See International Merch<strong>and</strong>ise <strong>Trade</strong> Statistics: Concepts<strong>and</strong> Def<strong>in</strong>itions 2010 (2010).II. Organizationof the <strong>global</strong>production processIII. Infrastructureservices <strong>in</strong> <strong>global</strong><strong>value</strong> <strong>cha<strong>in</strong>s</strong>IV. The evolutionof tariff policiesV. Foreign direct<strong>in</strong>vestmentVI. IntegrateddiversityVII. An evolutionaryperspective onproduction networks<strong>in</strong> the <strong>Asia</strong>-US regionVIII. <strong>Trade</strong> <strong>in</strong><strong>in</strong>termediate goodsIX. Vertical trade<strong>and</strong> trade <strong>in</strong><strong>value</strong> addedX. Cross-regionalspillover ofeconomic growth27
<strong>Trade</strong> Patterns <strong>and</strong> Global Value Cha<strong>in</strong>s <strong>in</strong> <strong>East</strong> <strong>Asia</strong>III. Infrastructure services<strong>in</strong> <strong>global</strong> <strong>value</strong> <strong>cha<strong>in</strong>s</strong>• Innovation <strong>and</strong> development <strong>in</strong> <strong>in</strong>frastructure services facilitate thesmooth function<strong>in</strong>g of the <strong>global</strong> <strong>value</strong> cha<strong>in</strong> system.• Conta<strong>in</strong>er port traffic <strong>in</strong> <strong>Asia</strong> has escalated, with Ch<strong>in</strong>a lead<strong>in</strong>g, followedby S<strong>in</strong>gapore, Hong Kong (Ch<strong>in</strong>a) <strong>and</strong> Japan.• India, the Philipp<strong>in</strong>es <strong>and</strong> Indonesia showed the highest <strong>in</strong>creases <strong>in</strong><strong>in</strong>formation <strong>and</strong> communication technology (ICT) expenditure.• The trad<strong>in</strong>g environment that exporters <strong>and</strong> importers face with<strong>in</strong> theirown countries impacts on the cost <strong>and</strong> timel<strong>in</strong>ess of <strong>in</strong>ternational trade.<strong>Asia</strong>n economies are more competitive.28
I. From massdem<strong>and</strong> to <strong>global</strong>supply <strong>cha<strong>in</strong>s</strong>II. Organizationof the <strong>global</strong>production processIII. Infrastructureservices <strong>in</strong> <strong>global</strong><strong>value</strong> <strong>cha<strong>in</strong>s</strong>ContentsIV. The evolutionof tariff policiesA. Infrastructure services: A condition for <strong>global</strong> <strong>value</strong> <strong>cha<strong>in</strong>s</strong>B. Merchant fleet <strong>and</strong> conta<strong>in</strong>erization: Key determ<strong>in</strong>ants of world tradeC. Air transport: The solution for time-sensitive <strong>in</strong>ternational trade <strong>and</strong> productionD. Information <strong>and</strong> communication technology (ICT)E. Cost <strong>and</strong> time to trade at the border3030313233V. Foreign direct<strong>in</strong>vestmentVI. IntegrateddiversityVII. An evolutionaryperspective onproduction networks<strong>in</strong> the <strong>Asia</strong>-US regionVIII. <strong>Trade</strong> <strong>in</strong><strong>in</strong>termediate goodsIX. Vertical trade<strong>and</strong> trade <strong>in</strong><strong>value</strong> addedX. Cross-regionalspillover ofeconomic growth29
<strong>Trade</strong> Patterns <strong>and</strong> Global Value Cha<strong>in</strong>s <strong>in</strong> <strong>East</strong> <strong>Asia</strong>A. Infrastructure services: A condition for <strong>global</strong> <strong>value</strong> <strong>cha<strong>in</strong>s</strong>Adequate <strong>in</strong>frastructure services at a reasonable costare a precondition for the development of <strong>global</strong> <strong>value</strong><strong>cha<strong>in</strong>s</strong>. Infrastructure services <strong>in</strong>clude transportation,telecommunications, f<strong>in</strong>ance <strong>and</strong> <strong>in</strong>surance. 1Transportation services cover sea, l<strong>and</strong> <strong>and</strong> air, as wellas support<strong>in</strong>g <strong>and</strong> auxiliary services. Telecommunicationsservices encompass the electronic transmission of<strong>in</strong>formation, <strong>in</strong>clud<strong>in</strong>g bus<strong>in</strong>ess network services <strong>and</strong>Internet access. F<strong>in</strong>ancial services deal with f<strong>in</strong>ancial<strong>in</strong>termediation, with auxiliary services provided by banks<strong>and</strong> stock exchanges, <strong>and</strong> with services provided byfactor<strong>in</strong>g, credit card <strong>and</strong> other enterprises.Innovations <strong>in</strong> <strong>in</strong>frastructure services have paved theway for improvements <strong>in</strong> <strong>in</strong>ternational transport, enabl<strong>in</strong>geconomies to <strong>in</strong>crease their engagement <strong>in</strong> the <strong>global</strong><strong>value</strong> cha<strong>in</strong> process. A dramatic <strong>in</strong>crease <strong>in</strong> the averagesize of merchant ships after the 1950s transformed bulkfreighters, with ships grow<strong>in</strong>g from an average of lessthan 20,000 deadweight tonnes (dwts) <strong>in</strong> 1960 to about45,000 dwts <strong>in</strong> the early 1990s. 2 Maritime transport alsounderwent a qualitative revolution with the <strong>in</strong>vention <strong>in</strong> themid 1950s of the conta<strong>in</strong>er by an American former truckdriver, Malcom McLean. As a result of such changes, thetime needed to move goods around the world shrank, asdid the cost. Freight rates are estimated to have decl<strong>in</strong>edby 65 per cent between the 1950s <strong>and</strong> 1990s.The quality of <strong>in</strong>frastructure services is <strong>in</strong>creas<strong>in</strong>glyseen as a determ<strong>in</strong>ant of the trade performance ofdevelop<strong>in</strong>g economies <strong>and</strong> an important factor <strong>in</strong> <strong>global</strong><strong>value</strong> <strong>cha<strong>in</strong>s</strong>. The follow<strong>in</strong>g sections focus pr<strong>in</strong>cipallyon two <strong>in</strong>ternational modes of transport (sea <strong>and</strong> air);however, the importance of l<strong>and</strong>-based modes (rail <strong>and</strong>road) should not be overlooked, as they provide thel<strong>in</strong>k between factories <strong>and</strong> ma<strong>in</strong> ports but also rema<strong>in</strong>the ma<strong>in</strong> modes of transport, particularly but not solelywith<strong>in</strong> Europe <strong>and</strong> North America. In 2008, for example,road <strong>and</strong> rail accounted for 45.9 per cent <strong>and</strong> 10.8 percent respectively of total goods transported with<strong>in</strong> the27 countries of the European Union, while <strong>in</strong>tra-maritimetransport accounted for 36.6 per cent. 3B. Merchant fleet <strong>and</strong> conta<strong>in</strong>erization: Key determ<strong>in</strong>ants of world tradeInternational trade <strong>and</strong> the shipp<strong>in</strong>g <strong>in</strong>dustry have longmoved <strong>in</strong> t<strong>and</strong>em. Despite competition from other modesof transport, seaborne trade cont<strong>in</strong>ues to <strong>in</strong>crease, aidedby the grow<strong>in</strong>g efficiency of shipp<strong>in</strong>g. Accord<strong>in</strong>g toMaritime International Secretariat Services (Marisec),approximately 90 per cent of world trade <strong>in</strong> terms ofvolume is carried by the <strong>in</strong>ternational shipp<strong>in</strong>g <strong>in</strong>dustry.Marisec calculates that there are around 50,000merchant ships trad<strong>in</strong>g <strong>in</strong>ternationally, transport<strong>in</strong>g everyk<strong>in</strong>d of cargo. The world fleet is registered <strong>in</strong> over 150nations <strong>and</strong> manned by over a million seafarers. 4The development of maritime transportation cannot bedissociated from conta<strong>in</strong>erization, a simple idea thatchanged the l<strong>and</strong>scape of <strong>in</strong>ternational trade. The ideaof tak<strong>in</strong>g the body of a tractor-trailer <strong>and</strong> us<strong>in</strong>g thissame conta<strong>in</strong>er from orig<strong>in</strong> to dest<strong>in</strong>ation changed notonly <strong>in</strong>ternational transportation, but also the outlook,management <strong>and</strong> organization of <strong>in</strong>ternational trade<strong>and</strong> <strong>global</strong> production. It is estimated that 100 millionconta<strong>in</strong>ers cross the oceans each year, carry<strong>in</strong>g mostof world trade. In the words of author <strong>and</strong> economistMarc Lev<strong>in</strong>son, before the existence of conta<strong>in</strong>erization“transport<strong>in</strong>g goods was so expensive that it did not payto ship many th<strong>in</strong>gs halfway across the country, muchless halfway around the world.” 5 Conta<strong>in</strong>erization, by<strong>in</strong>troduc<strong>in</strong>g st<strong>and</strong>ardization, automation, <strong>in</strong>ter-modality,traceability, <strong>and</strong> security from loss <strong>and</strong> damage, hasradically contributed to the development of the <strong>global</strong>supply cha<strong>in</strong> production system. Intermediate goodsmove faster to manufacturers <strong>and</strong> f<strong>in</strong>al goods reachcustomers quickly, safely <strong>and</strong> securely.In 2009, of the top 10 lead<strong>in</strong>g world ports <strong>in</strong> terms ofconta<strong>in</strong>er traffic, five were located <strong>in</strong> Ch<strong>in</strong>a, with one each <strong>in</strong>Hong Kong (Ch<strong>in</strong>a), the Republic of Korea <strong>and</strong> S<strong>in</strong>gapore. 6In 2008, these four economies represented 38 per centof the world’s conta<strong>in</strong>er port traffic. Figure 1 illustratesthe <strong>in</strong>crease <strong>in</strong> conta<strong>in</strong>er port traffic <strong>in</strong> all the selectedeconomies of the <strong>Asia</strong>n region. 7 Ch<strong>in</strong>a <strong>in</strong> particular hasregistered a remarkable average annual growth of 14 percent dur<strong>in</strong>g the 2000-2008 period. The five economieswith the most conta<strong>in</strong>er port traffic, i.e. Ch<strong>in</strong>a, Hong Kong(Ch<strong>in</strong>a), Japan, the Republic of Korea <strong>and</strong> S<strong>in</strong>gapore,are also the five that have traded the highest volumes of<strong>in</strong>termediate goods among the <strong>Asia</strong>n economies.30
<strong>Trade</strong> Patterns <strong>and</strong> Global Value Cha<strong>in</strong>s <strong>in</strong> <strong>East</strong> <strong>Asia</strong>Figure 2World air transport (freight), 1990-2008 (Index, 1990=100)3002502001501005001990199119921993199419951996199719981999200020012002200320042005200620072008Source: World Bank, World Development Indicators Database.D. Information <strong>and</strong> communication technology (ICT)Instant access to <strong>in</strong>formation for decision makers,e-commerce for consumers, logistics management<strong>and</strong> communication between the numerousstakeholders <strong>in</strong> the <strong>global</strong> <strong>value</strong> cha<strong>in</strong> all depend onthe availability <strong>and</strong> level of development of <strong>in</strong>formation<strong>and</strong> communication technology (ICT). Communication<strong>in</strong>frastructure is therefore one of the basic conditionsfor the growth <strong>and</strong> susta<strong>in</strong>ability of <strong>global</strong> <strong>value</strong><strong>cha<strong>in</strong>s</strong> <strong>and</strong> production networks. Access to market<strong>in</strong>formation aids <strong>in</strong>ternational transparency <strong>and</strong> pavesthe way for <strong>in</strong>ternational <strong>in</strong>tegration. Advances <strong>in</strong> ICT(from telex, to fax <strong>and</strong> to the Internet) enable fasterreactions <strong>and</strong> speed up the whole logistical Internetprocess.Figure 3 shows the development of ICT expenditureover the period 2003 to 2009. For Ch<strong>in</strong>a, Hong Kong(Ch<strong>in</strong>a), India, Indonesia, the Philipp<strong>in</strong>es <strong>and</strong> Thail<strong>and</strong>,expenditure more than doubled, while for the othereconomies, it still grew, but more slowly. However, itshould be noted that economies such as the Republicof Korea, Malaysia, S<strong>in</strong>gapore <strong>and</strong> the United Stateshad already atta<strong>in</strong>ed higher levels of ICT expenditureby 2003.32
Figure 3ICT expenditure (current US$) of selected <strong>Asia</strong>n economies <strong>and</strong> the United States (Index, 2003=100)I. From massdem<strong>and</strong> to <strong>global</strong>supply <strong>cha<strong>in</strong>s</strong>300280260240220II. Organizationof the <strong>global</strong>production processIII. Infrastructureservices <strong>in</strong> <strong>global</strong><strong>value</strong> <strong>cha<strong>in</strong>s</strong>200180160IV. The evolutionof tariff policies140120100V. Foreign direct<strong>in</strong>vestment2003200420052006200720082009Ch<strong>in</strong>aIndonesiaIndiaJapanKorea, Rep. ofMalaysiaPhilipp<strong>in</strong>esS<strong>in</strong>gaporeThail<strong>and</strong>Hong Kong (Ch<strong>in</strong>a)Viet NamUnited StatesVI. IntegrateddiversityNote: as the <strong>in</strong>dex is based on current dollars, the seem<strong>in</strong>gly poor performance of the Republic of Korea <strong>in</strong> 2008 <strong>and</strong> 2009 is ma<strong>in</strong>ly due to the depreciation of the Won.Source: World Bank, World Development Indicators Database.E. Cost <strong>and</strong> time to trade at the borderThe ability of enterprises <strong>and</strong> of economies to jo<strong>in</strong> the<strong>global</strong> supply cha<strong>in</strong> is heavily affected by the efficiencyof border processes <strong>and</strong> customs practices. The trad<strong>in</strong>genvironment that exporters face with<strong>in</strong> their own countriescan have a huge impact on their competitiveness.Domestic regulations <strong>and</strong> trade-related bureaucracyare among the cost factors that determ<strong>in</strong>e whether anenterprise can meet external dem<strong>and</strong> <strong>in</strong> a competitive<strong>and</strong> timely fashion. The World Bank’s Do<strong>in</strong>g Bus<strong>in</strong>essDatabase 9 identifies the documents required <strong>and</strong> thetime <strong>and</strong> costs <strong>in</strong>volved <strong>in</strong> export<strong>in</strong>g <strong>and</strong> import<strong>in</strong>g, <strong>and</strong>ranks countries on the ease of trad<strong>in</strong>g across borders.In its 2010 rank<strong>in</strong>g of 183 economies, S<strong>in</strong>gapore <strong>and</strong>Hong Kong (Ch<strong>in</strong>a) appear <strong>in</strong> first <strong>and</strong> second placerespectively, both <strong>in</strong> terms of the ease of do<strong>in</strong>g bus<strong>in</strong>ess<strong>in</strong> general <strong>and</strong> <strong>in</strong> trad<strong>in</strong>g across borders <strong>in</strong> particular. Oncost 10 to export criteria, Malaysia, S<strong>in</strong>gapore <strong>and</strong> Ch<strong>in</strong>aare the lowest-cost economies. On the import side,S<strong>in</strong>gapore <strong>and</strong> Malaysia are the least costly, with Ch<strong>in</strong>a<strong>in</strong> fourth place, beh<strong>in</strong>d the United Arab Emirates. Ch<strong>in</strong>areceives a good rank<strong>in</strong>g despite a modest performance <strong>in</strong>time to export (21 days) <strong>and</strong> import (24 days), comparedto S<strong>in</strong>gapore’s 5 <strong>and</strong> 4 days, respectively.VII. An evolutionaryperspective onproduction networks<strong>in</strong> the <strong>Asia</strong>-US regionVIII. <strong>Trade</strong> <strong>in</strong><strong>in</strong>termediate goodsIX. Vertical trade<strong>and</strong> trade <strong>in</strong><strong>value</strong> addedX. Cross-regionalspillover ofeconomic growth33
<strong>Trade</strong> Patterns <strong>and</strong> Global Value Cha<strong>in</strong>s <strong>in</strong> <strong>East</strong> <strong>Asia</strong>Figure 4 shows the evolution of cost <strong>and</strong> time to export atthe border <strong>in</strong> 2005 <strong>and</strong> 2008. 11 Cost to export <strong>in</strong>creasedslightly for almost all countries <strong>in</strong> the sample, with thenotable exception of Thail<strong>and</strong>, for which it fell by some26 per cent. Time to export decl<strong>in</strong>ed for all countries withthe exception of Ch<strong>in</strong>a (where it rose by three days); thebiggest decreases were <strong>in</strong> Thail<strong>and</strong>, India <strong>and</strong> HongKong (Ch<strong>in</strong>a) (a reduction of 10, 10 <strong>and</strong> seven days,respectively). Bigger trade volumes could expla<strong>in</strong> therise <strong>in</strong> Ch<strong>in</strong>a’s time to export. Larger trade volumes could<strong>in</strong>crease congestion <strong>and</strong> lessen the efficiency of trade<strong>in</strong>frastructure, lead<strong>in</strong>g to a positive estimated effect oftime costs on trade. As an example of the latter, whentrade volumes surged <strong>in</strong> Ch<strong>in</strong>a <strong>in</strong> 2003, the wait timeat Shanghai’s port exp<strong>and</strong>ed by two days on average. 12Figure 4Cost to export <strong>and</strong> time to export, 2005 <strong>and</strong> 2008120030100025US$ per conta<strong>in</strong>er800600400201510No. of days200500JapanIndiaPhilipp<strong>in</strong>esKorea, Rep. ofCh<strong>in</strong>eseTaipeiIndonesiaThail<strong>and</strong>Hong Kong(Ch<strong>in</strong>a)Viet NamCh<strong>in</strong>aS<strong>in</strong>gaporeMalaysiaCost to export2005Cost to export2008Time to export2005Time to export2008Same time to export2005-2008Source: World Bank, Do<strong>in</strong>g Bus<strong>in</strong>ess Database.Figure 5 shows the cost <strong>and</strong> time it takes to import at theborder. The cost to import has <strong>in</strong>creased for most of theeconomies <strong>in</strong> the sample, i.e. Ch<strong>in</strong>a, Hong Kong (Ch<strong>in</strong>a),Malaysia, the Philipp<strong>in</strong>es, S<strong>in</strong>gapore, Ch<strong>in</strong>ese Taipei <strong>and</strong>Viet Nam. India, Indonesia, the Republic of Korea <strong>and</strong>Thail<strong>and</strong>, however, have managed to reduce the costof import<strong>in</strong>g goods. Time to import has either rema<strong>in</strong>edsteady or decreased for all countries <strong>in</strong> the sample. Aspectacular 70 per cent drop is registered for HongKong (Ch<strong>in</strong>a); other significant decreases occurred forIndia <strong>and</strong> Thail<strong>and</strong> (down 50 per cent <strong>and</strong> 40 per centrespectively).34
<strong>Trade</strong> Patterns <strong>and</strong> Global Value Cha<strong>in</strong>s <strong>in</strong> <strong>East</strong> <strong>Asia</strong>IV. The evolution oftariff policies• <strong>Asia</strong>n economies have relatively low applied tariffs on imports, <strong>and</strong> theyare still decreas<strong>in</strong>g.• Some <strong>Asia</strong>n economies, e.g. Hong Kong (Ch<strong>in</strong>a) <strong>and</strong> Macao (Ch<strong>in</strong>a), arefully duty free.• <strong>Trade</strong> <strong>in</strong> <strong>Asia</strong> is dom<strong>in</strong>ated by semi-processed products, which have thelowest applied tariffs.• Low tariffs belie real trade liberalization because of non-tariff measures.36
I. From massdem<strong>and</strong> to <strong>global</strong>supply <strong>cha<strong>in</strong>s</strong>II. Organizationof the <strong>global</strong>production processIII. Infrastructureservices <strong>in</strong> <strong>global</strong><strong>value</strong> <strong>cha<strong>in</strong>s</strong>ContentsIV. The evolutionof tariff policiesA. An overview of <strong>Asia</strong>’s tariff commitments to the WTOB. Applied tariffs <strong>in</strong> <strong>Asia</strong> are low <strong>and</strong> still decreas<strong>in</strong>gC. Regional trade agreements accentuate the growth of <strong>Asia</strong>n tradeD. Tariffs <strong>in</strong> <strong>Asia</strong> vary significantly among sectorsE. Effective protection rates become highly “<strong>in</strong>effective” <strong>in</strong> <strong>global</strong> supply <strong>cha<strong>in</strong>s</strong>F. Non-tariff measures mitigate the benefits of low tariffs383941434445V. Foreign direct<strong>in</strong>vestmentVI. IntegrateddiversityVII. An evolutionaryperspective onproduction networks<strong>in</strong> the <strong>Asia</strong>-US regionVIII. <strong>Trade</strong> <strong>in</strong><strong>in</strong>termediate goodsIX. Vertical trade<strong>and</strong> trade <strong>in</strong><strong>value</strong> addedX. Cross-regionalspillover ofeconomic growth37
<strong>Trade</strong> Patterns <strong>and</strong> Global Value Cha<strong>in</strong>s <strong>in</strong> <strong>East</strong> <strong>Asia</strong>A. An overview of <strong>Asia</strong>’s tariff commitments to the WTOAs we saw <strong>in</strong> the previous chapter, the lower<strong>in</strong>g oftransaction costs through better <strong>in</strong>frastructure has beenkey to promot<strong>in</strong>g <strong>global</strong> <strong>value</strong> <strong>cha<strong>in</strong>s</strong> <strong>in</strong> <strong>Asia</strong>. Anotherkey element <strong>in</strong> facilitat<strong>in</strong>g trade is lower tariffs, or duties.At the WTO, a major focus of free trade negotiationshas been market access, or tariff, issues. Specifically,the negotiations aim to reduce the tariff ceil<strong>in</strong>gs towhich members are formally committed, known as their“bound” levels, <strong>and</strong> so <strong>in</strong>crease the transparency oftrade relations.A WTO member’s tariff commitment to the WTO laysdown the maximum duty that it can impose on specificimports (bound duty) <strong>and</strong> the number, or percentage,of products that it has formally agreed to b<strong>in</strong>d (b<strong>in</strong>d<strong>in</strong>gcoverage). Out of the 153 WTO Members, 111 have“bound” – set maximum tariffs – for at least 90 per centof their products. In <strong>Asia</strong>, Japan <strong>and</strong> Ch<strong>in</strong>ese Taipeiboth have almost full b<strong>in</strong>d<strong>in</strong>g coverage <strong>and</strong> low boundduty levels. It is also worth mention<strong>in</strong>g that only <strong>in</strong> <strong>Asia</strong>are there two economies that are duty free on boundproducts, even if the b<strong>in</strong>d<strong>in</strong>g coverage is much less than90 per cent. These are Hong Kong (Ch<strong>in</strong>a) <strong>and</strong> Macao(Ch<strong>in</strong>a).Figure 1 gives an overall picture of tariff commitmentson goods <strong>in</strong> terms of b<strong>in</strong>d<strong>in</strong>g coverage <strong>and</strong> bound dutylevels for all WTO members (the European Union isrepresented as one). The vertical left axis represents themember’s average bound duty level, while the verticalright axis shows the correspond<strong>in</strong>g b<strong>in</strong>d<strong>in</strong>g coveragerepresented by the shaded area. But while bound ratesare the rates to which members are formally committedunder WTO agreements, <strong>in</strong> practice they often applylower levels of duty. These actual levels are called“applied” tariffs.Figure 1Bound duty commitments of WTO members (percentage)All WTO members180Members with at least 90% b<strong>in</strong>d<strong>in</strong>g coverage(sorted by <strong>in</strong>creas<strong>in</strong>g average bound duty)Members with less than 90% b<strong>in</strong>d<strong>in</strong>g coverage(sorted by decreas<strong>in</strong>g b<strong>in</strong>d<strong>in</strong>g coverage)100160901408012070Average bound duty10080605040B<strong>in</strong>d<strong>in</strong>g coverage60304020201000Japan Ch<strong>in</strong>a Indonesia MalaysiaCh<strong>in</strong>eseTaipeiViet NamKorea,Rep. ofB<strong>in</strong>d<strong>in</strong>g coverageThail<strong>and</strong>IndiaS<strong>in</strong>gaporePhilipp<strong>in</strong>esHong Kong(Ch<strong>in</strong>a)Average Bound dutySource: WTO (2010a).38
B. Applied tariffs <strong>in</strong> <strong>Asia</strong> are low <strong>and</strong> still decreas<strong>in</strong>gI. From massdem<strong>and</strong> to <strong>global</strong>supply <strong>cha<strong>in</strong>s</strong>In the <strong>Asia</strong>n region, applied tariffs under the WTO’smost favoured nations (MFN) pr<strong>in</strong>ciple are generally low,mostly <strong>in</strong> the 5-10 per cent range (see Figure 2 for MFNapplied tariff levels). The MFN pr<strong>in</strong>ciple guards aga<strong>in</strong>stdiscrim<strong>in</strong>ation by ensur<strong>in</strong>g that all WTO member statesbenefit from the best tariff terms that any member isprepared to offer. India <strong>and</strong> the Republic of Korea deviateslightly from this pattern of low applied tariffs, with ratesof 12.9 per cent <strong>and</strong> 12.1 per cent, respectively. ButIndia has been cutt<strong>in</strong>g its applied tariffs, with averagerates down 19.5 percentage po<strong>in</strong>ts <strong>in</strong> 2009 comparedto 2001 levels.II. Organizationof the <strong>global</strong>production processIII. Infrastructureservices <strong>in</strong> <strong>global</strong><strong>value</strong> <strong>cha<strong>in</strong>s</strong>IV. The evolutionof tariff policiesV. Foreign direct<strong>in</strong>vestmentVI. IntegrateddiversityFigure 2Latest applied duties <strong>in</strong> the world (percentage)Source: WTO (2010a).Range of MFN applied duties<strong>in</strong> selected<strong>Asia</strong>n economiesDuty free - 2.5%2.5% - 5.0%5.0% - 7.5%7.5% - 10.0%10.0% - 12.5%12.5% - 15.0%15.0% +No available data<strong>in</strong> rest ofthe WorldVII. An evolutionaryperspective onproduction networks<strong>in</strong> the <strong>Asia</strong>-US regionVIII. <strong>Trade</strong> <strong>in</strong><strong>in</strong>termediate goodsIX. Vertical trade<strong>and</strong> trade <strong>in</strong><strong>value</strong> addedX. Cross-regionalspillover ofeconomic growth39
<strong>Trade</strong> Patterns <strong>and</strong> Global Value Cha<strong>in</strong>s <strong>in</strong> <strong>East</strong> <strong>Asia</strong>Figure 3 shows that major <strong>Asia</strong>n traders have significantlyreduced their applied tariffs. Ch<strong>in</strong>a, India <strong>and</strong> Viet Nam,the countries which lowered overall tariffs the most,relative to 2001, have also seen the highest annual ratesof trade growth. Some countries, like Indonesia <strong>and</strong> thePhilipp<strong>in</strong>es, have registered a slight <strong>in</strong>crease <strong>in</strong> tariffs.But while they are core actors <strong>in</strong> regional <strong>value</strong> <strong>cha<strong>in</strong>s</strong>deal<strong>in</strong>g with motor vehicles <strong>and</strong> parts, their applied tariffs<strong>in</strong> 2001 were already relatively low. The rate was 6.3 percent for Indonesia <strong>and</strong> 4.8 per cent for the Philipp<strong>in</strong>es,compared to 16.9 per cent for Ch<strong>in</strong>a <strong>and</strong> 25.7 per centfor India. Even Malaysia’s rate was 18.6 per cent.Figure 3Applied MFN tariff reduction <strong>and</strong> annual trade growth <strong>in</strong> selected <strong>Asia</strong>n economies, 2001-2009 (percentage)25 302025Tariff reduction151052015105Annual trade growth00-5-5Ch<strong>in</strong>a*Hong Kong(Ch<strong>in</strong>a)IndiaIndonesiaJapanKorea, Rep. ofMalaysiaPhilipp<strong>in</strong>esS<strong>in</strong>gaporeTaipei,Ch<strong>in</strong>ese*Thail<strong>and</strong>Viet Nam*Overall TariffReduction*Jo<strong>in</strong>ed the WTO after 2001.Tariff reduction <strong>in</strong> motorvehicles <strong>and</strong> partsSources: WTO, Integrated Database; UN Comtrade Database.Overall Annual <strong>Trade</strong>Growth (right axis)Annual trade growth <strong>in</strong> motorvehicles <strong>and</strong> partsFigure 4B<strong>in</strong>d<strong>in</strong>g overhang <strong>in</strong> 2009 for selected <strong>Asia</strong>n economies (percentage)6050403020100IndiaIndonesiaPhilipp<strong>in</strong>esThail<strong>and</strong>MalaysiaS<strong>in</strong>gaporeKorea, Rep of.Viet NamCh<strong>in</strong>aTaipei, Ch<strong>in</strong>eseJapanHong Kong(Ch<strong>in</strong>a)B<strong>in</strong>d<strong>in</strong>g overhangApplied tariffsSource: WTO (2010a).40
Bound tariffs serve to protect export-oriented enterprisesaga<strong>in</strong>st unexpected tariff surges. Many <strong>Asia</strong>n membershave formally high tariff commitments, but as we haveseen, their actual applied MFN rates are much lower(see Figure 4). The 10 members of the Association of<strong>Asia</strong> is a highly <strong>in</strong>tegrated trad<strong>in</strong>g bloc, with buoyant<strong>in</strong>tra-regional commerce (58 per cent of its trade <strong>in</strong>2009, see Figure 5). Furthermore, it has diversified itsextra-regional markets to reach beyond its traditionalpartners, the European Union <strong>and</strong> the United States.The share of extra-regional trade exclud<strong>in</strong>g theEuropean Union <strong>and</strong> the United States has <strong>in</strong>creasedfrom 12.9 per cent <strong>in</strong> 2001 to 18 per cent <strong>in</strong> 2009.The numerous regional trad<strong>in</strong>g agreements (RTAs)among <strong>Asia</strong>n economies have contributed to regional<strong>in</strong>tegration. The ASEAN Free <strong>Trade</strong> Area (AFTA) isan almost completely duty-free zone. Under AFTA’sSoutheast <strong>Asia</strong>n Nations (ASEAN), which jo<strong>in</strong>ed themultilateral trad<strong>in</strong>g system dur<strong>in</strong>g the Uruguay Round,<strong>and</strong> India, have the highest b<strong>in</strong>d<strong>in</strong>g overhangs (theoverhang is the gap between applied <strong>and</strong> bound rates).C. Regional trade agreements accentuate the growth of <strong>Asia</strong>n tradeCommon Effective Preferential Tariff (CEPT), fiveASEAN states – Indonesia, Malaysia, the Philipp<strong>in</strong>es,S<strong>in</strong>gapore <strong>and</strong> Thail<strong>and</strong> – started <strong>in</strong> 2010 to offerduty-free access on more than 99 per cent of tradedproducts (tariff l<strong>in</strong>es). Viet Nam’s target date for zeroCEPT tariffs is 2015. ASEAN countries also have freetrade agreements with Ch<strong>in</strong>a, India, Japan <strong>and</strong> theRepublic of Korea, among others, which are all <strong>in</strong> theimplementation phase. Most <strong>Asia</strong>n countries are partiesto at least one RTA. S<strong>in</strong>gapore is party to 18 RTAs ongoods. Indonesia, Malaysia, the Philipp<strong>in</strong>es, Thail<strong>and</strong><strong>and</strong> Viet Nam are parties to at least six more RTAs <strong>in</strong>addition to the AFTA (see Figure 6).I. From massdem<strong>and</strong> to <strong>global</strong>supply <strong>cha<strong>in</strong>s</strong>II. Organizationof the <strong>global</strong>production processIII. Infrastructureservices <strong>in</strong> <strong>global</strong><strong>value</strong> <strong>cha<strong>in</strong>s</strong>IV. The evolutionof tariff policiesV. Foreign direct<strong>in</strong>vestmentFigure 5<strong>Asia</strong>’s merch<strong>and</strong>ise trade by region (percentage)2001US$ 3.2 Trillion2009US$ 7.3 TrillionVI. IntegrateddiversityRest of the World12.9%Europe14.4%18.5%United States 3.7%Other <strong>Asia</strong>50.5%Intra-<strong>Asia</strong> 12Rest of the World18.0%13.0%Europe11.2%53.3%Intra-<strong>Asia</strong> 12VII. An evolutionaryperspective onproduction networks<strong>in</strong> the <strong>Asia</strong>-US regionVIII. <strong>Trade</strong> <strong>in</strong><strong>in</strong>termediate goodsUnited States4.5%Other <strong>Asia</strong>IX. Vertical trade<strong>and</strong> trade <strong>in</strong><strong>value</strong> addedNote: “Intra-<strong>Asia</strong> 12” comprises Ch<strong>in</strong>a, Hong Kong (Ch<strong>in</strong>a), India, Indonesia, Japan, the Republic of Korea, Malaysia, the Philipp<strong>in</strong>es, S<strong>in</strong>gapore, Ch<strong>in</strong>ese Taipei, Thail<strong>and</strong><strong>and</strong> Viet Nam.Source: UN Comtrade Database.X. Cross-regionalspillover ofeconomic growth41
<strong>Trade</strong> Patterns <strong>and</strong> Global Value Cha<strong>in</strong>s <strong>in</strong> <strong>East</strong> <strong>Asia</strong>Figure 6Regional <strong>Trade</strong> Agreements <strong>in</strong> goods notified to the GATT/WTO <strong>and</strong> <strong>in</strong> force by country/territory (number)Japan11India12Thail<strong>and</strong>10S<strong>in</strong>gapore18Ch<strong>in</strong>a9Republic of Korea6Ch<strong>in</strong>ese TaipeiHong Kong (Ch<strong>in</strong>a) 3Viet Nam 27 Philipp<strong>in</strong>es8Malaysia8Indonesia7Number of notified Regional<strong>Trade</strong> Agreements on goodsNo notification1-23-56-1011-1415-1920-2425-30Source: WTO, Regional <strong>Trade</strong> Agreements Database.42
D. Tariffs <strong>in</strong> <strong>Asia</strong> vary significantly among sectorsI. From massdem<strong>and</strong> to <strong>global</strong>supply <strong>cha<strong>in</strong>s</strong>Industrial tariffs 1 are lower <strong>in</strong> <strong>Asia</strong>n countries thanagricultural ones (see Figure 7). Agriculture tariffs<strong>in</strong> India <strong>and</strong> the Republic of Korea are among the 10highest <strong>in</strong> the world, with the latter’s tariff for agriculturalproducts be<strong>in</strong>g more than seven times the average tarifffor <strong>in</strong>dustrial products. While Japan’s <strong>in</strong>dustrial productstariff is relatively low, its duties on agricultural imports arecomparable to those of <strong>Asia</strong>n develop<strong>in</strong>g countries.The dom<strong>in</strong>at<strong>in</strong>g position of semi-processed products<strong>in</strong> <strong>Asia</strong>n trade is reflected <strong>in</strong> the tariffs that countries <strong>in</strong>the region impose. Tariffs on semi-processed productsare low compared to either raw materials or processedproducts. In the cases of the Republic of Korea <strong>and</strong>Thail<strong>and</strong>, tariffs on semi processed products areless than one-third of those for raw materials. As foragricultural products, duties on raw materials rema<strong>in</strong>high <strong>in</strong> most <strong>Asia</strong>n economies (see Figure 8). But thereis little evidence of tariff escalation, the practice ofimpos<strong>in</strong>g higher tariffs the more process<strong>in</strong>g is <strong>in</strong>volved<strong>in</strong> the imported product.II. Organizationof the <strong>global</strong>production processIII. Infrastructureservices <strong>in</strong> <strong>global</strong><strong>value</strong> <strong>cha<strong>in</strong>s</strong>Figure 7Agriculture vs. <strong>in</strong>dustrial tariffs <strong>in</strong> <strong>Asia</strong>, 2009 (percentage)IV. The evolutionof tariff policies504540V. Foreign direct<strong>in</strong>vestment353025VI. Integrateddiversity2015105VII. An evolutionaryperspective onproduction networks<strong>in</strong> the <strong>Asia</strong>-US region0Republic of KoreaAgricultureIndiaJapanIndustryThail<strong>and</strong>Ch<strong>in</strong>ese TaipeiViet NamCh<strong>in</strong>aMalaysiaPhilipp<strong>in</strong>esIndonesiaVIII. <strong>Trade</strong> <strong>in</strong><strong>in</strong>termediate goodsIX. Vertical trade<strong>and</strong> trade <strong>in</strong><strong>value</strong> addedSource: WTO (2010a).X. Cross-regionalspillover ofeconomic growth43
<strong>Trade</strong> Patterns <strong>and</strong> Global Value Cha<strong>in</strong>s <strong>in</strong> <strong>East</strong> <strong>Asia</strong>Figure 8Tariff escalation <strong>in</strong> selected <strong>Asia</strong>n economies, 2009 (percentage)35302520151050Republic of KoreaIndiaThail<strong>and</strong>Viet NamCh<strong>in</strong>ese TaipeiJapanCh<strong>in</strong>aPhilipp<strong>in</strong>esMalaysiaIndonesiaRaw Semi-processed ProcessedSource: WTO, Integrated Database.E. Effective protection rates become highly “<strong>in</strong>effective” <strong>in</strong> <strong>global</strong> supply<strong>cha<strong>in</strong>s</strong>Closely related to the issue of tariff escalation is thenotion of effective protection. When tariff escalation issteep, all firms that produce f<strong>in</strong>ished products will benefitfrom high protection. They will be able to sell dear <strong>and</strong>buy cheap. On the other h<strong>and</strong>, firms sell<strong>in</strong>g <strong>in</strong>termediategoods will scarcely benefit from high tariff protection,<strong>and</strong> will have to pay high duties for any processed goodsthey need to import. In the latter case, their effectiveprotection rate (EPR) will be low. It may even be negativeif the duty paid on the <strong>in</strong>puts is higher than any nom<strong>in</strong>alprotection received on the output.Effective protection becomes highly “<strong>in</strong>effective” whencountries participate <strong>in</strong> <strong>in</strong>ternational supply <strong>cha<strong>in</strong>s</strong>because an <strong>in</strong>creas<strong>in</strong>g volume of traded <strong>in</strong>dustrial outputis made of <strong>in</strong>termediate goods (see Chapter VIII). Effectiveprotection, computed for each <strong>in</strong>dustry accord<strong>in</strong>g to its<strong>in</strong>put-output structure, <strong>and</strong> the correspond<strong>in</strong>g tariffs, hasbeen decreas<strong>in</strong>g over time <strong>in</strong> <strong>East</strong> <strong>Asia</strong> <strong>and</strong> the UnitedStates. But some sectors, like textiles <strong>and</strong> cloth<strong>in</strong>g,automobiles, <strong>and</strong> some food <strong>in</strong>dustries, still benefitfrom high levels of effective protection (see Figure 9).However, accord<strong>in</strong>g to 2005 data, negative protectionis now relatively rare, unlike <strong>in</strong> previous decades.Overall, the trend towards lower applied tariffs has been<strong>in</strong>strumental <strong>in</strong> reduc<strong>in</strong>g negative protection.There is a tendency for highly protected sectors to seetheir effective protection rate reduced over time. Therate of correlation between the level of EPR <strong>in</strong> 1995 <strong>and</strong>the variation between 1995 <strong>and</strong> 2005 is negative <strong>and</strong>relatively large (-0.7) across all sectors <strong>and</strong> countries,<strong>in</strong>dicat<strong>in</strong>g a tendency towards a more neutral, flatter tariffstructure.44
Figure 9Effective protection rate (percentage) <strong>in</strong> 2005 <strong>and</strong> changes 1995-2005, United States <strong>and</strong> selected <strong>Asia</strong>neconomies1009080706050403020100-10-20I. From massdem<strong>and</strong> to <strong>global</strong>supply <strong>cha<strong>in</strong>s</strong>II. Organizationof the <strong>global</strong>production processIII. Infrastructureservices <strong>in</strong> <strong>global</strong><strong>value</strong> <strong>cha<strong>in</strong>s</strong>IV. The evolutionof tariff policies-30-40-50-60Iron oreShip-build<strong>in</strong>gElectronics <strong>and</strong> electronic productsOther metallic oreNon-metallic ore <strong>and</strong> quarry<strong>in</strong>gCrude petroleum <strong>and</strong> natural gasNon-ferrous metalForestryAll products (simple average)Leather <strong>and</strong> leather productsBeverageOther made-up textile productsKnitted productsMeat <strong>and</strong> dairy productsTires <strong>and</strong> tubesPlastic productsNon-food cropsWear<strong>in</strong>g apparelMotor vehiclesMilled gra<strong>in</strong> <strong>and</strong> flourV. Foreign direct<strong>in</strong>vestmentVI. IntegrateddiversityEffective protection rate 2005 Rate of variation 1995-2005Note: Simple average of effective protection rates calculated for 10 countries.Source: Elaborated on the basis of <strong>IDE</strong>-<strong>JETRO</strong> <strong>and</strong> WTO data.F. Non-tariff measures mitigate the benefits of low tariffsWhile tariffs have generally been fall<strong>in</strong>g, the trendtowards further trade liberalization is be<strong>in</strong>g mitigated by<strong>in</strong>creased use of what are termed non-tariff measures(NTMs). These are adm<strong>in</strong>istrative <strong>in</strong>struments that canaddress legitimate public policy concerns but maylimit imports. They can cover anyth<strong>in</strong>g from licens<strong>in</strong>g<strong>and</strong> quantitative controls to health <strong>and</strong> phytosanitarymeasures. Governments resort to NTMs for a variety ofreasons, sometimes us<strong>in</strong>g them as trade policy tools.In 2007, a multi-agency support team of experts 2 onnon-tariff measures proposed the follow<strong>in</strong>g def<strong>in</strong>ition ofNTMs: “Non-tariff measures (NTMs) are policy measures,other than ord<strong>in</strong>ary customs tariffs, that can potentiallyhave an economic effect on <strong>in</strong>ternational trade <strong>in</strong> goods,chang<strong>in</strong>g quantities traded, or prices or both.”Table 1 gives an overview of the types of NTMscommonly used. The pr<strong>in</strong>ciples of transparency <strong>and</strong> nondiscrim<strong>in</strong>ationare for the most part the only benchmarksby which NTMs <strong>and</strong> other trade policies are evaluatedunder WTO jurisdiction. Hence, the statistics on disputesettlement <strong>in</strong> Table 1 relate more to the issue of whetherthe NTMs or any other trade regulat<strong>in</strong>g <strong>in</strong>strumentsabide by WTO pr<strong>in</strong>ciples rather than to the “legitimacy”of these trade <strong>in</strong>struments per se.VII. An evolutionaryperspective onproduction networks<strong>in</strong> the <strong>Asia</strong>-US regionVIII. <strong>Trade</strong> <strong>in</strong><strong>in</strong>termediate goodsIX. Vertical trade<strong>and</strong> trade <strong>in</strong><strong>value</strong> addedX. Cross-regionalspillover ofeconomic growth45
<strong>Trade</strong> Patterns <strong>and</strong> Global Value Cha<strong>in</strong>s <strong>in</strong> <strong>East</strong> <strong>Asia</strong>Table 1Common Non-Tariff Measures practiced <strong>and</strong> dispute settlement cases <strong>in</strong>volv<strong>in</strong>g selected WTO MembersWTO memberLicens<strong>in</strong>g, prohibition <strong>and</strong>quantity controlsNon-Tariff MeasuresTechnical measures<strong>in</strong>clud<strong>in</strong>g santary <strong>and</strong>phytosanitary measuresPrice controlof which antidump<strong>in</strong>gDISPUTE SETTLEMENTNumber of requests forconsultation <strong>in</strong> disputeswhere member iscompla<strong>in</strong>ant/respondentCh<strong>in</strong>a 7/20Hong Kong (Ch<strong>in</strong>a) 1/0India 19/20Indonesia 5/4Japan 14/15Republic of Korea 14/14Malaysia 1/1Philipp<strong>in</strong>es 5/6S<strong>in</strong>gapore 1/0Ch<strong>in</strong>ese Taipei 3/0Thail<strong>and</strong> 13/3Viet Nam 1/0Sources: Mart<strong>in</strong>ez et al. (2009); WTO <strong>Trade</strong> Profiles (2010).46
EndnotesI. From massdem<strong>and</strong> to <strong>global</strong>supply <strong>cha<strong>in</strong>s</strong>1Refers to the non-agricultural sector, based on the WTOdef<strong>in</strong>ition which <strong>in</strong>cludes any product not <strong>in</strong> Annex 1 ofthe WTO Agreement on Agriculture (see www.wto.org/agriculture).2Multi-Agency Support Team (MAST), organized by UNCTAD<strong>and</strong> made up of experts from several organizations deal<strong>in</strong>gwith substantive analysis of non-tariff measures.II. Organizationof the <strong>global</strong>production processIII. Infrastructureservices <strong>in</strong> <strong>global</strong><strong>value</strong> <strong>cha<strong>in</strong>s</strong>IV. The evolutionof tariff policiesV. Foreign direct<strong>in</strong>vestmentVI. IntegrateddiversityVII. An evolutionaryperspective onproduction networks<strong>in</strong> the <strong>Asia</strong>-US regionVIII. <strong>Trade</strong> <strong>in</strong><strong>in</strong>termediate goodsIX. Vertical trade<strong>and</strong> trade <strong>in</strong><strong>value</strong> addedX. Cross-regionalspillover ofeconomic growth47
<strong>Trade</strong> Patterns <strong>and</strong> Global Value Cha<strong>in</strong>s <strong>in</strong> <strong>East</strong> <strong>Asia</strong>V. Foreign direct<strong>in</strong>vestment• <strong>Asia</strong> doubled its share of total FDI <strong>in</strong>flows from 1985 to 1995. In 2008, theshare was still nearly twice as high as <strong>in</strong> the mid-1980s.• Ch<strong>in</strong>a has emerged as an attractive dest<strong>in</strong>ation for FDI flows, but its shareis decl<strong>in</strong><strong>in</strong>g, while that of India is ris<strong>in</strong>g.• Merch<strong>and</strong>ise exports mirror <strong>in</strong>creas<strong>in</strong>g FDI <strong>in</strong>flows <strong>in</strong> most lead<strong>in</strong>g <strong>Asia</strong>neconomies.• FDI <strong>in</strong>flows to <strong>Asia</strong> are shift<strong>in</strong>g from the manufactur<strong>in</strong>g sector to services.48
I. From massdem<strong>and</strong> to <strong>global</strong>supply <strong>cha<strong>in</strong>s</strong>II. Organizationof the <strong>global</strong>production processIII. Infrastructureservices <strong>in</strong> <strong>global</strong><strong>value</strong> <strong>cha<strong>in</strong>s</strong>ContentsIV. The evolutionof tariff policiesA. The situation at a glanceB. A key factor <strong>in</strong> <strong>Asia</strong>’s trade growthC. Foreign direct <strong>in</strong>vestment: From manufactur<strong>in</strong>g to servicesD. Invest<strong>in</strong>g abroad: Turnover of Japanese <strong>and</strong> US foreign affiliates <strong>in</strong> <strong>Asia</strong> on the rise50525556V. Foreign direct<strong>in</strong>vestmentVI. IntegrateddiversityVII. An evolutionaryperspective onproduction networks<strong>in</strong> the <strong>Asia</strong>-US regionVIII. <strong>Trade</strong> <strong>in</strong><strong>in</strong>termediate goodsIX. Vertical trade<strong>and</strong> trade <strong>in</strong><strong>value</strong> addedX. Cross-regionalspillover ofeconomic growth49
<strong>Trade</strong> Patterns <strong>and</strong> Global Value Cha<strong>in</strong>s <strong>in</strong> <strong>East</strong> <strong>Asia</strong>A. The situation at a glanceForeign direct <strong>in</strong>vestment (FDI) contributes tothe structural <strong>and</strong> geographical diversification ofmult<strong>in</strong>ational enterprises. Its pr<strong>in</strong>cipal aims are to “sliceup” the production process <strong>and</strong> seize the comparativeadvantages particular to each participant <strong>in</strong> the supplycha<strong>in</strong> (“efficiency-seek<strong>in</strong>g FDI”), but also to ga<strong>in</strong> accessto foreign markets <strong>and</strong> sell directly to clients (“marketseek<strong>in</strong>gFDI”) (Figure 1). The impact on <strong>in</strong>ternationaltrade flows is a priori ambivalent as some <strong>in</strong>vestments willboost exchanges (<strong>in</strong> particular <strong>in</strong> <strong>in</strong>termediate goods),while others will reduce it (“build-where-you-sell”, seeChapter I). But FDI has been <strong>in</strong>strumental <strong>in</strong> the shiftto <strong>in</strong>ternational production networks, <strong>and</strong> economiesthat have experienced the largest FDI <strong>in</strong>flows have alsoseen the largest expansion <strong>in</strong> merch<strong>and</strong>ise exports. 1The fragmentation of production presents producers <strong>in</strong>develop<strong>in</strong>g countries with a golden opportunity to widentheir export markets. Indeed, develop<strong>in</strong>g economiesmake up three of the top six dest<strong>in</strong>ations for FDI flows,with Ch<strong>in</strong>a mov<strong>in</strong>g up to become the second largest FDIrecipient <strong>in</strong> 2009, 2 beh<strong>in</strong>d the United States.Figure 1Complementarity versus substitution between trade <strong>and</strong> FDICOUNTRY ACOUNTRY B“Market-seek<strong>in</strong>g”(horizontal) FDIMult<strong>in</strong>ationalenterprise(producer)Foreignsubsidiary(producer)F<strong>in</strong>ishedproductsF<strong>in</strong>ishedproductsMarket AMarket BF<strong>in</strong>ishedproductsComponents“Efficiency-seek<strong>in</strong>g”(vertical) FDIMult<strong>in</strong>ationalenterprise(producer,marketer)FDIForeignsubsidiary(assembler)F<strong>in</strong>ished products<strong>Trade</strong> flowsFDI flowsSource: WTO Secretariat.FDI flows to <strong>Asia</strong> have leapt s<strong>in</strong>ce the mid-1980s whenthey were just some US$ 5 billion a year. In 1990,these flows reached US$ 23 billion <strong>and</strong> by 2008 theyhad multiplied to US$ 307 billion, despite some largedecl<strong>in</strong>es dur<strong>in</strong>g <strong>and</strong> after the 1997-98 <strong>Asia</strong>n f<strong>in</strong>ancialcrisis. 3 <strong>Asia</strong>’s share of worldwide FDI <strong>in</strong>flows doubledbetween 1985 <strong>and</strong> 1995 – from 10 to 19 per cent– <strong>and</strong> has rema<strong>in</strong>ed at that high level ever s<strong>in</strong>ce (seeFigure 2). At the same time, <strong>Asia</strong>’s share <strong>in</strong> the exports of<strong>in</strong>termediate goods climbed from 26 per cent <strong>in</strong> 1995 to35 per cent <strong>in</strong> 2009.50
I. From massdem<strong>and</strong> to <strong>global</strong>supply <strong>cha<strong>in</strong>s</strong>II. Organizationof the <strong>global</strong>production processFigure 2Regional share of FDI <strong>in</strong>ward <strong>and</strong> outward flows <strong>in</strong> world – 1985, 1995 <strong>and</strong> 2008 (percentage)CIS505040302010046North America322924 24221985 1995 2008504030201003149Europe425035541985 1995 20085040403020100Middle <strong>East</strong>0 0 1 0 7 31985 1995 2008504030201001017<strong>Asia</strong>23 19 19161985 1995 2008Africa3020Central <strong>and</strong> South America5040301001 0 120 51985 1995 20085040302010041985 1995 2008141 20201008 1 1 26 71985 1995 2008Inward OutwardSource: UNCTAD Stat Database.III. Infrastructureservices <strong>in</strong> <strong>global</strong><strong>value</strong> <strong>cha<strong>in</strong>s</strong>IV. The evolutionof tariff policiesV. Foreign direct<strong>in</strong>vestmentVI. IntegrateddiversityVII. An evolutionaryperspective onproduction networks<strong>in</strong> the <strong>Asia</strong>-US regionVIII. <strong>Trade</strong> <strong>in</strong><strong>in</strong>termediate goodsIX. Vertical trade<strong>and</strong> trade <strong>in</strong><strong>value</strong> addedX. Cross-regionalspillover ofeconomic growth51
<strong>Trade</strong> Patterns <strong>and</strong> Global Value Cha<strong>in</strong>s <strong>in</strong> <strong>East</strong> <strong>Asia</strong>Figure 3 shows the evolution of the regional breakdown<strong>in</strong> <strong>value</strong> terms. Europe’s FDI <strong>in</strong>flows still tower over therest of the world, but <strong>Asia</strong> has become <strong>in</strong>creas<strong>in</strong>glyattractive, surpass<strong>in</strong>g North America <strong>in</strong> 2005, a year <strong>in</strong>which the latter suffered a sharp decl<strong>in</strong>e.Figure 3FDI <strong>in</strong>flows by region <strong>and</strong> world level (<strong>in</strong> billions of US$)1,6551,6001,5001,4001,3671,3001,2001,1001,0009979008007006005004003003182001000521985 1995 2000 2005 2008Europe North America <strong>Asia</strong> Central <strong>and</strong> South AmericaCIS Middle <strong>East</strong> Africa WorldSource: UNCTAD Stat Database.B. A key factor <strong>in</strong> <strong>Asia</strong>’s trade growthWhen measured <strong>in</strong> relation with the country’s grossdomestic product (GDP), Ch<strong>in</strong>a’s FDI <strong>in</strong>flows peaked<strong>in</strong> 1995. Its share of overall <strong>Asia</strong>n FDI has decl<strong>in</strong>ed,while others, such as India <strong>and</strong> Viet Nam, have become<strong>in</strong>creas<strong>in</strong>gly important dest<strong>in</strong>ations. Nevertheless, <strong>in</strong>terms of the levels of FDI, Ch<strong>in</strong>a <strong>and</strong> Hong Kong (Ch<strong>in</strong>a)still absorb the largest amounts <strong>in</strong> the region (see Figures4 <strong>and</strong> 5).Figure 5 shows the level of merch<strong>and</strong>ise exports <strong>and</strong> FDI<strong>in</strong>flows <strong>in</strong> 1985, 1995 <strong>and</strong> 2008. As already mentioned,there is not always a direct positive relationshipbetween FDI <strong>and</strong> exports. But it is <strong>in</strong>terest<strong>in</strong>g to notethe difference between mature <strong>in</strong>dustrial economies,such as Japan <strong>in</strong> 1995, <strong>and</strong> an emerg<strong>in</strong>g economy suchas Ch<strong>in</strong>a <strong>in</strong> 2008. Japan, as a large mature economy,dom<strong>in</strong>ated exports <strong>in</strong> 1995, but ranked relatively low on<strong>in</strong>ward FDI flows. Ch<strong>in</strong>a, on the other h<strong>and</strong>, is dom<strong>in</strong>antfor both exports <strong>and</strong> FDI flows <strong>in</strong> 2008. Interest<strong>in</strong>glyenough, India <strong>in</strong> 2008 is <strong>in</strong> the same situation Ch<strong>in</strong>awas <strong>in</strong> 1995, with relatively low exports but high FDI<strong>in</strong>flows.52
Figure 4FDI <strong>in</strong>flows received by selected <strong>Asia</strong>n economies (percentage of GDP <strong>and</strong> economies’ shares <strong>in</strong> <strong>Asia</strong>)I. From massdem<strong>and</strong> to <strong>global</strong>supply <strong>cha<strong>in</strong>s</strong>198519900,6 1,0-0,8As percentage of GDP19955,24,3 4,32000 2005 2008 20093,4 3,2 2,4 1,936,618,927,7Ch<strong>in</strong>aHong Kong(Ch<strong>in</strong>a)1985 1995 2000 2005 20082639As share <strong>in</strong> FDI <strong>in</strong>flows to <strong>Asia</strong>4121521042203519II. Organizationof the <strong>global</strong>production processIII. Infrastructureservices <strong>in</strong> <strong>global</strong><strong>value</strong> <strong>cha<strong>in</strong>s</strong>0,0 0,1 0,6 0,8 0,93,3 2,6India25 6413IV. The evolutionof tariff policiesJapan0,0 0,1 0,0 0,2 0,1 0,5 0,215,1 13,717,812,35,99,20,6S<strong>in</strong>gapore5105139 826 94V. Foreign direct<strong>in</strong>vestment2,9 1,8 0,9Indonesia53VI. IntegrateddiversityThail<strong>and</strong>0,43,0 1,2 2,8 4,6 3,1 2,30,2 0,3 0,21,7 0,8 0,90,0Korea, Rep. of264 3 534 3 43VII. An evolutionaryperspective onproduction networks<strong>in</strong> the <strong>Asia</strong>-US region0,02,88,6 4,1 3,88,94,9Viet NamMalaysia11 113VIII. <strong>Trade</strong> <strong>in</strong><strong>in</strong>termediate goods2,25,9 6,5 4,0 2,9 3,30,7Ch<strong>in</strong>ese Taipei230 3 224 1 21IX. Vertical trade<strong>and</strong> trade <strong>in</strong><strong>value</strong> addedPhilipp<strong>in</strong>es0,3 1,22,03,01,9 0,9 1,21Sources: UNCTAD Stat Database <strong>and</strong> World Bank, World Development Indicators Database.02 11X. Cross-regionalspillover ofeconomic growth53
<strong>Trade</strong> Patterns <strong>and</strong> Global Value Cha<strong>in</strong>s <strong>in</strong> <strong>East</strong> <strong>Asia</strong>Figure 5FDI <strong>in</strong>flows <strong>and</strong> merch<strong>and</strong>ise exports to/of selected <strong>Asia</strong>n economies – 1985, 1995 <strong>and</strong> 2008 (<strong>in</strong> millionsof US$)1985Exports200,0002,5002,000150,0001,500100,000 1,000FDI50,00050000 -500JapanCh<strong>in</strong>eseTaipeiKorea, Rep. ofHong Kong(Ch<strong>in</strong>a)Ch<strong>in</strong>aS<strong>in</strong>gapore1995IndonesiaMalaysiaIndiaThail<strong>and</strong>Philipp<strong>in</strong>esViet Nam500,00040,00035,000400,00030,000Exports300,00025,00020,000FDI200,000 15,000100,0000 0JapanHong Kong(Ch<strong>in</strong>a)Ch<strong>in</strong>aKorea, Rep. ofS<strong>in</strong>gaporeCh<strong>in</strong>eseTaipei2008MalaysiaThail<strong>and</strong>IndonesiaIndiaPhilipp<strong>in</strong>esViet Nam10,0005,0001,600,000120,0001,400,000100,0001,200,000Exports1,000,00080,000800,000 60,000FDI600,00040,000400,000200,00020,0000 0Ch<strong>in</strong>aJapanKorea, Rep. ofHong Kong(Ch<strong>in</strong>a)S<strong>in</strong>gaporeCh<strong>in</strong>eseTaipeiMalaysiaIndiaThail<strong>and</strong>IndonesiaViet NamPhilipp<strong>in</strong>esMerch<strong>and</strong>ise exportsFDI InflowsSources: ITC Investment Map <strong>and</strong> WTO Secretariat.54
C. Foreign direct <strong>in</strong>vestment: From manufactur<strong>in</strong>g to servicesI. From massdem<strong>and</strong> to <strong>global</strong>supply <strong>cha<strong>in</strong>s</strong>Increas<strong>in</strong>gly, companies are offshor<strong>in</strong>g not onlymanufactur<strong>in</strong>g but also parts of their bus<strong>in</strong>ess functions,such as account<strong>in</strong>g or similar activities. Mult<strong>in</strong>ationalcompanies are often the driv<strong>in</strong>g force beh<strong>in</strong>d thistrend, which is reflected <strong>in</strong> a shift <strong>in</strong> FDI flows fromthe so-called secondary (ma<strong>in</strong>ly construction <strong>and</strong>manufactur<strong>in</strong>g) to the tertiary (services) sector.A large part of FDI flows to Ch<strong>in</strong>a, Malaysia, Thail<strong>and</strong><strong>and</strong> Viet Nam still go to the secondary sector. Malaysia<strong>and</strong> Viet Nam are <strong>in</strong> fact exceptions to the generalregion-wide trend of shift<strong>in</strong>g to the tertiary sector: bothFigure 6FDI <strong>in</strong>ward flows by sector (<strong>in</strong> millions of US$)have witnessed surges reflect<strong>in</strong>g the consolidation ofMalaysia’s role <strong>in</strong> <strong>global</strong> <strong>value</strong> <strong>cha<strong>in</strong>s</strong>, or the relativelyrecent <strong>in</strong>sertion of Viet Nam. On the other h<strong>and</strong>,although S<strong>in</strong>gapore was receiv<strong>in</strong>g US$ 8.2 billionof FDI <strong>in</strong>flows to the manufactur<strong>in</strong>g sector <strong>in</strong> 2000,these slumped to US$ 1.5 billion <strong>in</strong> 2005. Dur<strong>in</strong>g thesame period, FDI flows to the tertiary sector <strong>in</strong>creasedfrom US$ 7.4 billion to US$ 18.9 billion. A similartrend was observed <strong>in</strong> India, where <strong>in</strong>vestments to thetertiary sector <strong>in</strong>creased from US$ 0.8 billion <strong>in</strong> 2000to US$ 16.7 billion <strong>in</strong> 2008 (see Figure 6).II. Organizationof the <strong>global</strong>production processIII. Infrastructureservices <strong>in</strong> <strong>global</strong><strong>value</strong> <strong>cha<strong>in</strong>s</strong>IV. The evolutionof tariff policiesJapanCh<strong>in</strong>a30000 80000 25002000060000 2000Viet Nam25002000Philipp<strong>in</strong>esV. Foreign direct<strong>in</strong>vestment10000040000 150020000 10000 50015001000500VI. Integrateddiversity-10000020052008-20000 02000 20062000 200502000 2008250002000015000100005000010000India2000 2008IndonesiaThail<strong>and</strong>Hong Kong (Ch<strong>in</strong>a)10000 1000005000500000-5000 02000 20082000 2008MalaysiaUnited States100004000003000020000100000-100000S<strong>in</strong>gapore2000 2005VII. An evolutionaryperspective onproduction networks<strong>in</strong> the <strong>Asia</strong>-US regionVIII. <strong>Trade</strong> <strong>in</strong><strong>in</strong>termediate goods50000-500080006000400020000300000200000100000PrimarySecondaryTertiaryUnspecified (merch<strong>and</strong>ise<strong>and</strong> services)IX. Vertical trade<strong>and</strong> trade <strong>in</strong><strong>value</strong> added-100002000 2005Source: ITC Investment Map.-20002000 200802000 2008X. Cross-regionalspillover ofeconomic growth55
<strong>Trade</strong> Patterns <strong>and</strong> Global Value Cha<strong>in</strong>s <strong>in</strong> <strong>East</strong> <strong>Asia</strong>D. Invest<strong>in</strong>g abroad: Turnover of Japanese <strong>and</strong> US foreign affiliates <strong>in</strong> <strong>Asia</strong>on the riseThe relationship between mult<strong>in</strong>ational firms <strong>and</strong> theirpartners abroad can range from simple jo<strong>in</strong>t ventures orcontractual arrangements to acquir<strong>in</strong>g shares, tak<strong>in</strong>g acontroll<strong>in</strong>g stake or launch<strong>in</strong>g a full takeover. So called“green field” FDI refers to cases where the affiliate isbuilt from scratch, rather than by tak<strong>in</strong>g control of anexist<strong>in</strong>g company. Because FDI implies a long-termcommitment <strong>and</strong> high f<strong>in</strong>ancial stakes, it is a complexdecision-mak<strong>in</strong>g process which <strong>in</strong>volves not onlyeconomic considerations, but also <strong>in</strong>stitutional, political<strong>and</strong> cultural ones. More than 50 per cent of affiliatescontrolled by Japanese companies are located <strong>in</strong> <strong>Asia</strong>.Their turnover grew steadily throughout the 2000s (seeFigure 7).Figure 7Turnover of Japan’s majority-owned affiliates <strong>in</strong> manufactur<strong>in</strong>g, 2000-2007 (Index, 2000=100)1000900800700600500400300200100<strong>Asia</strong>Ch<strong>in</strong>aHong Kong (Ch<strong>in</strong>a)IndonesiaIndiaKorea, Rep. ofMalaysiaPhilipp<strong>in</strong>esS<strong>in</strong>gaporeThail<strong>and</strong>Ch<strong>in</strong>ese Taipei0Source: OECD.Stat Database.Study of majority-owned affiliates of US companiesshows that US companies were particularly active <strong>in</strong>Ch<strong>in</strong>a, India <strong>and</strong> Indonesia, where turnover grew fastest(see Figure 8).Figure 8Turnover of US majority-owned affiliates <strong>in</strong> manufactur<strong>in</strong>g, 2000-2007 (Index, 2000=100)600<strong>Asia</strong>500Ch<strong>in</strong>aHong Kong (Ch<strong>in</strong>a)400Indonesia300IndiaPhilipp<strong>in</strong>es200S<strong>in</strong>gapore100Thail<strong>and</strong>Ch<strong>in</strong>ese Taipei020002001200220032004200520062007200820002001200220032004200520062007Source: OECD.Stat Database.56
EndnotesI. From massdem<strong>and</strong> to <strong>global</strong>supply <strong>cha<strong>in</strong>s</strong>1See Broadman (2005), Chapter 7.2UNCTAD, World Investment Report.3UNCTAD, FDI database.II. Organizationof the <strong>global</strong>production processIII. Infrastructureservices <strong>in</strong> <strong>global</strong><strong>value</strong> <strong>cha<strong>in</strong>s</strong>IV. The evolutionof tariff policiesV. Foreign direct<strong>in</strong>vestmentVI. IntegrateddiversityVII. An evolutionaryperspective onproduction networks<strong>in</strong> the <strong>Asia</strong>-US regionVIII. <strong>Trade</strong> <strong>in</strong><strong>in</strong>termediate goodsIX. Vertical trade<strong>and</strong> trade <strong>in</strong><strong>value</strong> addedX. Cross-regionalspillover ofeconomic growth57
<strong>Trade</strong> Patterns <strong>and</strong> Global Value Cha<strong>in</strong>s <strong>in</strong> <strong>East</strong> <strong>Asia</strong>VI. Integrated diversity:The production system<strong>and</strong> employment <strong>in</strong>the <strong>Asia</strong>-US region• Structural diversity <strong>and</strong> a high degree of complementarity arecharacteristic features of production systems <strong>in</strong> the <strong>Asia</strong>-US region.• The complementarity of production systems is both a cause <strong>and</strong> anoutcome of deepen<strong>in</strong>g economic <strong>in</strong>terdependency among countries. Theforces for regional <strong>in</strong>tegration were first centred on Japan, <strong>and</strong> graduallyshifted to Ch<strong>in</strong>a.• Global <strong>value</strong> <strong>cha<strong>in</strong>s</strong> translate <strong>in</strong>to “trade <strong>in</strong> tasks”, with partnersspecializ<strong>in</strong>g <strong>in</strong> specific skills accord<strong>in</strong>g to their comparative advantages.This creates new trade <strong>and</strong> job opportunities, the net balance of whichdepends on the labour <strong>in</strong>tensity of the products <strong>and</strong> the overall tradebalance of each economy.58
I. From massdem<strong>and</strong> to <strong>global</strong>supply <strong>cha<strong>in</strong>s</strong>II. Organizationof the <strong>global</strong>production processIII. Infrastructureservices <strong>in</strong> <strong>global</strong><strong>value</strong> <strong>cha<strong>in</strong>s</strong>ContentsIV. The evolutionof tariff policiesA. Structural diversity <strong>and</strong> complementarity of the <strong>Asia</strong>-US regionB. The impact of <strong>in</strong>ternational trade on employment6068V. Foreign direct<strong>in</strong>vestmentVI. IntegrateddiversityVII. An evolutionaryperspective onproduction networks<strong>in</strong> the <strong>Asia</strong>-US regionVIII. <strong>Trade</strong> <strong>in</strong><strong>in</strong>termediate goodsIX. Vertical trade<strong>and</strong> trade <strong>in</strong><strong>value</strong> addedX. Cross-regionalspillover ofeconomic growth59
<strong>Trade</strong> Patterns <strong>and</strong> Global Value Cha<strong>in</strong>s <strong>in</strong> <strong>East</strong> <strong>Asia</strong>A. Structural diversity <strong>and</strong> complementarity of the <strong>Asia</strong>-US regionAs shown <strong>in</strong> the previous chapter, <strong>global</strong> <strong>value</strong> <strong>cha<strong>in</strong>s</strong>foster the parallel development of trade <strong>and</strong> foreigndirect <strong>in</strong>vestment. Industrial clusters created by supply<strong>cha<strong>in</strong>s</strong> tend to grow up around specific tasks <strong>and</strong>bus<strong>in</strong>ess functions. The process is cumulative <strong>and</strong>, <strong>in</strong>time, modifies the production system of an economy.The last few decades have been marked by a series ofmajor events that have moulded the current l<strong>and</strong>scapeof <strong>Asia</strong>’s production systems. The Plaza Agreement <strong>in</strong>1985, for example, led to a sharp appreciation of the yenaga<strong>in</strong>st the US dollar. This made domestic productionrelatively expensive for Japanese manufacturers <strong>and</strong> thusdrove them to a massive relocation of production bases<strong>in</strong> neighbour<strong>in</strong>g <strong>Asia</strong>n countries. This movement wasre<strong>in</strong>forced a decade later by the <strong>Asia</strong>n currency crisis of1997, which forced some emerg<strong>in</strong>g economies <strong>in</strong> <strong>East</strong><strong>Asia</strong> to stop pegg<strong>in</strong>g their currencies to the US dollardue to a shortage of foreign reserves. The consequentshift to float<strong>in</strong>g exchange rates resulted <strong>in</strong> an immediatedepreciation of their currencies aga<strong>in</strong>st the yen <strong>and</strong> theUS dollar.The accession of Ch<strong>in</strong>a to the WTO <strong>in</strong> 2001, <strong>and</strong> that ofCh<strong>in</strong>ese Taipei <strong>in</strong> 2002, accelerated the reorganisationof regional production systems. Ch<strong>in</strong>a was extremelysuccessful <strong>in</strong> promot<strong>in</strong>g its exports, notably <strong>in</strong> the case ofthe special economic zones along its coastal areas (seeChapters II <strong>and</strong> X). This encouraged a massive <strong>in</strong>flowof foreign capital <strong>and</strong> made the country <strong>in</strong>ternationallyrecognized as “the factory of the world”.This dynamic reorganisation of the production systemhas opened up a number of development paths for <strong>Asia</strong>ncountries. Figure 1 compares the <strong>in</strong>dustrial profiles ofn<strong>in</strong>e <strong>East</strong> <strong>Asia</strong>n economies for 1985 (the green l<strong>in</strong>e) <strong>and</strong>2005 (the black l<strong>in</strong>e). Each chart <strong>in</strong> the diagram presentsan economy’s degree of specialization <strong>in</strong> 24 aggregated<strong>in</strong>dustrial sectors. The degree of specialization is atta<strong>in</strong>edby measur<strong>in</strong>g the extent to which an <strong>in</strong>dustry’s share ofan economy deviates from the regional average (seethe technical notes). It is apparent from the charts thatthe degree <strong>and</strong> form of specialization differ significantlybetween countries, reveal<strong>in</strong>g sharp <strong>in</strong>dustrial diversity<strong>and</strong> heterogeneity <strong>in</strong> the region. 1The degree of economic diversity among countries isfurther illustrated by Box 1 <strong>and</strong> Figures 2, 3 <strong>and</strong> 4, whichare known as “skyl<strong>in</strong>e charts”.Compar<strong>in</strong>g the chart of the United States with that ofCh<strong>in</strong>a, the difference is apparent. The US skyl<strong>in</strong>e ismuch flatter, show<strong>in</strong>g very little over- or underproductionof the economy. Also, the output share of the servicesector is remarkably large. These observations are ratherstraightforward illustrations of two famous classicalstatements: Leontief’s proposition on the structureof development, <strong>and</strong> the Law of Petty-Clark. WassilyLeontief, the founder of <strong>in</strong>put-output economics, believedthat the maturity of an economy can be observed <strong>in</strong>the form of a flat skyl<strong>in</strong>e, where full self-sufficiency isachieved without too much reliance on foreign marketsfor dem<strong>and</strong> <strong>and</strong> supply of products. 2 The Law of Petty-Clark, on the other h<strong>and</strong>, states that when the per capita<strong>in</strong>come of an economy rises, the share of its <strong>in</strong>dustrialoutput shifts from primary to secondary, <strong>and</strong> then fromsecondary to tertiary <strong>in</strong>dustries. In this respect, the USeconomy certa<strong>in</strong>ly falls under the category of a “matured<strong>and</strong> advanced” <strong>in</strong>dustrial structure, while Ch<strong>in</strong>a’s doesnot reflect the same development path.Japan, another advanced economy <strong>in</strong> the region, exhibitsa similar pattern to that of the United States, althoughthe predom<strong>in</strong>ance of the service sector is less salient.Japan’s skyl<strong>in</strong>e also features some “humps” overmanufactur<strong>in</strong>g sectors, which po<strong>in</strong>t to a surplus vis-à-visdomestic production requirements. Indonesia’s skyl<strong>in</strong>ehas a prom<strong>in</strong>ent st<strong>and</strong>alone skyscraper <strong>in</strong> the primary<strong>in</strong>dustry, which is the crude petroleum <strong>and</strong> natural gassector (006).The Republic of Korea, S<strong>in</strong>gapore <strong>and</strong> Ch<strong>in</strong>ese Taipei,which belong to the newly <strong>in</strong>dustrialised economies(NIEs), <strong>and</strong> Malaysia, the Philipp<strong>in</strong>es <strong>and</strong> Thail<strong>and</strong>, to begrouped as the emerg<strong>in</strong>g ASEAN economies, all exhibita similar pattern, with highly overshoot<strong>in</strong>g productionsurpluses <strong>in</strong> the computer <strong>and</strong> electronic equipmentsector (018). Compar<strong>in</strong>g the two groups, the emerg<strong>in</strong>gASEAN economies slightly lag <strong>in</strong> terms of Petty-Clark’sdevelopment scenario, even though the productionsurplus of their electronic equipment <strong>in</strong>dustriessignificantly surpasses that of the NIEs.Despite a high degree of diversity among <strong>in</strong>dividualcountries, the <strong>Asia</strong>-US region as a s<strong>in</strong>gle economic entitypresents quite a balanced <strong>and</strong> complete profile. Figure 4illustrates this po<strong>in</strong>t. The skyl<strong>in</strong>e is very flat, <strong>and</strong> staysclose to the self-sufficient benchmark for the whole rangeof <strong>in</strong>dustries (with some surplus <strong>in</strong> the manufactur<strong>in</strong>gsectors). Even though each of the constituent economiesof the region is quite heterogeneous, the <strong>Asia</strong>-US regionexhibits a high level of self-sufficiency, reveal<strong>in</strong>g thestrongly complementary nature of the region’s productionsystems. 360
Figure 1Industrial specialization of selected <strong>Asia</strong>n countries, 1985 <strong>and</strong> 2005 (<strong>in</strong>dex)I. From massdem<strong>and</strong> to <strong>global</strong>supply <strong>cha<strong>in</strong>s</strong>021020021020Ch<strong>in</strong>aRepublic of Korea001019 007018017023 024022016015014001019 007018017021020023 024022016013002012Philipp<strong>in</strong>es002003004015011014 013 012003004011010010005006008009005006008009019 007018017IndonesiaMalaysiaS<strong>in</strong>gaporeSource: The <strong>Asia</strong>n International Input-Output Tables, 1985 <strong>and</strong> 2005 (prelim<strong>in</strong>ary), <strong>IDE</strong>-<strong>JETRO</strong>.021020019 007018017023 024022016021020015014001013002012003004011010005006008009019 007017024 001 002023022016015014013012003004023 024 001 002001003023 024 002003022004022004016015014013012011010005006008009018021020011010005006008009019 007018017016015014 013 012001 Rice (paddy) 013 Petroleum <strong>and</strong> petro products002 Other agricultural products 014 Rubber products003 Livestock <strong>and</strong> poultry 015 Non-metallic m<strong>in</strong>eral products004 Forestry 016 Metals <strong>and</strong> metal products005 Fishery 017 Mach<strong>in</strong>ery006 Crude petroleum <strong>and</strong> natural gas 018 Transport equipment007 Other m<strong>in</strong><strong>in</strong>g 019 Other manufactur<strong>in</strong>g products008 Food, beverage <strong>and</strong> tobacco 020 Electricity, gas <strong>and</strong> water supply009 Textile, leather, <strong>and</strong> the products thereof 021 Construction010 Wooden furniture <strong>and</strong> other wooden products 022 <strong>Trade</strong> <strong>and</strong> transport011 Pulp, paper <strong>and</strong> pr<strong>in</strong>t<strong>in</strong>g 023 Other services012 Chemical products 024 Public adm<strong>in</strong>istration011010005006008009021020Japan001019 007018017021020019018017021020023 024022016015014013002012Ch<strong>in</strong>ese TaipeiThail<strong>and</strong>001013003004011010005006008009006019 007018017023 024022016023 02402201601501401501400101300201200201200300401100300401101001000500600500800900700800919852005II. Organizationof the <strong>global</strong>production processIII. Infrastructureservices <strong>in</strong> <strong>global</strong><strong>value</strong> <strong>cha<strong>in</strong>s</strong>IV. The evolutionof tariff policiesV. Foreign direct<strong>in</strong>vestmentVI. IntegrateddiversityVII. An evolutionaryperspective onproduction networks<strong>in</strong> the <strong>Asia</strong>-US regionVIII. <strong>Trade</strong> <strong>in</strong><strong>in</strong>termediate goodsIX. Vertical trade<strong>and</strong> trade <strong>in</strong><strong>value</strong> addedX. Cross-regionalspillover ofeconomic growth61
<strong>Trade</strong> Patterns <strong>and</strong> Global Value Cha<strong>in</strong>s <strong>in</strong> <strong>East</strong> <strong>Asia</strong>Box 1. The skyl<strong>in</strong>e chartThe skyl<strong>in</strong>e chart is a useful tool for analys<strong>in</strong>g a domestic economy’s self-sufficiency <strong>and</strong> <strong>in</strong>dustrial structure. Each of the build<strong>in</strong>gs/towers <strong>in</strong> a skyl<strong>in</strong>e corresponds to one particular <strong>in</strong>dustry <strong>in</strong> the economy, <strong>and</strong> the shape of the build<strong>in</strong>g is determ<strong>in</strong>ed by twofactors: the width represents the output share of the <strong>in</strong>dustry, <strong>and</strong> the height represents its self-sufficiency ratio.For the sake of simplicity, let us take just one “build<strong>in</strong>g” <strong>in</strong> a skyl<strong>in</strong>e chart, correspond<strong>in</strong>g to a particular <strong>in</strong>dustry <strong>in</strong> the economy(see Figure 2 below). The dem<strong>and</strong> structure is considered first. The total dem<strong>and</strong> for a product is either <strong>in</strong>duced by domesticdem<strong>and</strong> such as consumption <strong>and</strong> <strong>in</strong>vestment, or by foreign dem<strong>and</strong> <strong>in</strong> terms of export. From the bottom of the build<strong>in</strong>g, theamount of output <strong>in</strong>duced by domestic dem<strong>and</strong> is taken to be 100%. On top of this, the build<strong>in</strong>g ga<strong>in</strong>s extra height from theamount of output <strong>in</strong>duced by export dem<strong>and</strong>, as a percentage of this basic structure.The economy would be self-sufficient if it could satisfy all of the <strong>in</strong>duced dem<strong>and</strong> by its own domestic production, but this is notthe case <strong>in</strong> reality. If domestic output is <strong>in</strong> short supply, the economy has to import products from overseas. This is <strong>in</strong>dicated byadd<strong>in</strong>g two floors to the build<strong>in</strong>g. The top floor shows the amount of domestic output saved or displaced by imports. The bottomfloor, therefore, <strong>in</strong>dicates the self-sufficiency ratio of the <strong>in</strong>dustry.Note that Figure 2 has three tiers. The top two correspond to the breakdown of the effects of imports from the <strong>Asia</strong>-US region (<strong>in</strong>light purple) <strong>and</strong> imports from outside the region (<strong>in</strong> dark purple), respectively.Figure 2The skyl<strong>in</strong>e chartExport-<strong>in</strong>ducedoutputImport-<strong>in</strong>ducedoutput(negative)100%TOTAL DEMANDDomesticdem<strong>and</strong>-<strong>in</strong>ducedoutputSelf-sufficiencyratioTOTAL SUPPLYOutput ShareSource: <strong>IDE</strong>-<strong>JETRO</strong>.Self-sufficiency ratio Import from outside the region Import from the region001 Rice (paddy)002 Other agricultural products003 Livestock <strong>and</strong> poultry004 Forestry005 Fishery006 Crude petroleum <strong>and</strong> natural gas007 Other m<strong>in</strong><strong>in</strong>g008 Food, beverage <strong>and</strong> tobacco009 Textile, leather, <strong>and</strong> the products thereof010 Wooden furniture <strong>and</strong> other wooden products011 Pulp, paper <strong>and</strong> pr<strong>in</strong>t<strong>in</strong>g012 Chemical products013 Petroleum <strong>and</strong> petro products014 Rubber products015 Non-metallic m<strong>in</strong>eral products016 Metals <strong>and</strong> metal products017a Industry mach<strong>in</strong>ery017b Computers <strong>and</strong> electronic equipment017c Other electrical equipment018 Transport equipment019 Other manufactur<strong>in</strong>g products020 Electricity, gas, <strong>and</strong> water supply021 Construction022 <strong>Trade</strong> <strong>and</strong> transport023 Other services024 Public adm<strong>in</strong>istration62
Figure 3The skyl<strong>in</strong>e charts of the countries <strong>in</strong> the <strong>Asia</strong>-US region, 2005I. From massdem<strong>and</strong> to <strong>global</strong>supply <strong>cha<strong>in</strong>s</strong>600550500450400350300Ch<strong>in</strong>aII. Organizationof the <strong>global</strong>production processIII. Infrastructureservices <strong>in</strong> <strong>global</strong><strong>value</strong> <strong>cha<strong>in</strong>s</strong>250200150100IV. The evolutionof tariff policies500001002003004005007008009010011012013014015016017a017b017c018019020021022023024V. Foreign direct<strong>in</strong>vestment006SECTOR CODES600Agriculture<strong>and</strong> m<strong>in</strong><strong>in</strong>gManufactur<strong>in</strong>gUnited StatesServicesVI. Integrateddiversity550500450400350300250200VII. An evolutionaryperspective onproduction networks<strong>in</strong> the <strong>Asia</strong>-US regionVIII. <strong>Trade</strong> <strong>in</strong><strong>in</strong>termediate goods150100500IX. Vertical trade<strong>and</strong> trade <strong>in</strong><strong>value</strong> added001008010005 002017a017c018019020021022023024Agriculture<strong>and</strong> m<strong>in</strong><strong>in</strong>g011012013014016017bManufactur<strong>in</strong>gSECTOR CODESServicesX. Cross-regionalspillover ofeconomic growth63
<strong>Trade</strong> Patterns <strong>and</strong> Global Value Cha<strong>in</strong>s <strong>in</strong> <strong>East</strong> <strong>Asia</strong>600Japan550500450400350300250200150100500001004 003 006009011012014013015016017a017b017c018019020021022SECTOR CODES023024Agriculture<strong>and</strong> m<strong>in</strong><strong>in</strong>gManufactur<strong>in</strong>gServices600Indonesia550500450400350300250200150100500004001002003005006007012014008009010011013015016017b017c018019020021017a022023024SECTOR CODESAgriculture<strong>and</strong> m<strong>in</strong><strong>in</strong>gManufactur<strong>in</strong>gServices64
The Republic of Korea, Ch<strong>in</strong>ese Taipei <strong>and</strong> S<strong>in</strong>gaporeI. From massdem<strong>and</strong> to <strong>global</strong>supply <strong>cha<strong>in</strong>s</strong>55050045040017001150II. Organizationof the <strong>global</strong>production process3503002502001050III. Infrastructureservices <strong>in</strong> <strong>global</strong><strong>value</strong> <strong>cha<strong>in</strong>s</strong>15010050IV. The evolutionof tariff policies0001002011010003007005012013015014016017a017bV. Foreign direct<strong>in</strong>vestment550Malaysia, the Philipp<strong>in</strong>es <strong>and</strong> Thail<strong>and</strong>1850VI. Integrateddiversity5004504003503001100900VII. An evolutionaryperspective onproduction networks<strong>in</strong> the <strong>Asia</strong>-US region250200150100VIII. <strong>Trade</strong> <strong>in</strong><strong>in</strong>termediate goods500001002003005007008009010012013017a017b017cIX. Vertical trade<strong>and</strong> trade <strong>in</strong><strong>value</strong> added004006011016017c018019020021022SECTOR CODES023024Manufactur<strong>in</strong>gServicesAgriculture<strong>and</strong> m<strong>in</strong><strong>in</strong>g018019020021022023024Agriculture<strong>and</strong> m<strong>in</strong><strong>in</strong>g015014Manufactur<strong>in</strong>gSource: The <strong>Asia</strong>n International Input-Output Table, 2005 (prelim<strong>in</strong>ary), <strong>IDE</strong>-<strong>JETRO</strong>.SECTOR CODESServicesX. Cross-regionalspillover ofeconomic growth65
<strong>Trade</strong> Patterns <strong>and</strong> Global Value Cha<strong>in</strong>s <strong>in</strong> <strong>East</strong> <strong>Asia</strong>Figure 4The skyl<strong>in</strong>e chart of the whole <strong>Asia</strong>-US region600550500450400350300250200150100500003002001007008009010011012013015016017b017c018019004014017a020021022023024SECTOR CODESManufactur<strong>in</strong>gServicesAgriculture<strong>and</strong> m<strong>in</strong><strong>in</strong>gSelf-sufficiency ratioImport from outside the regionSource: The <strong>Asia</strong>n International Input-Output Table, 2005 (prelim<strong>in</strong>ary), <strong>IDE</strong>-<strong>JETRO</strong>.The complementarity of <strong>Asia</strong>n production systems isboth a cause <strong>and</strong> a result of the deepen<strong>in</strong>g economic<strong>in</strong>terdependency between countries. Figure 5 tracesthe development of cross-border supply networks for<strong>in</strong>termediate products over the last two decades. Thediagrams are contour maps drawn accord<strong>in</strong>g to the“strength” of l<strong>in</strong>kages, or <strong>in</strong>terconnectedness, betweencountries, as def<strong>in</strong>ed by a simple average of forward <strong>and</strong>backward l<strong>in</strong>kages across <strong>in</strong>dustries (see the technicalnotes for further description). In 1985, it can be seenthat the cross-national l<strong>in</strong>kages were quite weak <strong>and</strong>sporadic. From the 1990s onwards, however, thel<strong>in</strong>kages started to develop around Japan. By 2005, theyhad spread further <strong>and</strong> captured most of the region,becom<strong>in</strong>g especially <strong>in</strong>tense around Ch<strong>in</strong>a.66
Figure 5Development of cross-national production l<strong>in</strong>kages, 1985-2005I. From massdem<strong>and</strong> to <strong>global</strong>supply <strong>cha<strong>in</strong>s</strong>1985Ch<strong>in</strong>aIndonesia1995Ch<strong>in</strong>aIndonesiaII. Organizationof the <strong>global</strong>production processJapanKorea, Rep. ofMalaysiaCh<strong>in</strong>ese TaipeiJapanKorea, Rep. ofMalaysiaCh<strong>in</strong>ese TaipeiIII. Infrastructureservices <strong>in</strong> <strong>global</strong><strong>value</strong> <strong>cha<strong>in</strong>s</strong>Philipp<strong>in</strong>esS<strong>in</strong>gaporeThail<strong>and</strong>Philipp<strong>in</strong>esS<strong>in</strong>gaporeThail<strong>and</strong>IV. The evolutionof tariff policiesCh<strong>in</strong>a Japan Malaysia Philipp<strong>in</strong>es Thail<strong>and</strong>Indonesia Korea,Rep. ofCh<strong>in</strong>eseTaipeiS<strong>in</strong>gapore UnitedStates2000United StatesCh<strong>in</strong>aIndonesiaJapanCh<strong>in</strong>a Japan Malaysia Philipp<strong>in</strong>es Thail<strong>and</strong>Indonesia Korea,Rep. ofCh<strong>in</strong>eseTaipeiS<strong>in</strong>gapore UnitedStates2005United StatesCh<strong>in</strong>aIndonesiaJapanV. Foreign direct<strong>in</strong>vestmentVI. IntegrateddiversityKorea, Rep. ofKorea, Rep. ofCh<strong>in</strong>a Japan Malaysia Philipp<strong>in</strong>es Thail<strong>and</strong>Indonesia Korea,Rep. ofCh<strong>in</strong>eseTaipeiS<strong>in</strong>gapore UnitedStatesMalaysiaCh<strong>in</strong>ese TaipeiPhilipp<strong>in</strong>esS<strong>in</strong>gaporeThail<strong>and</strong>United StatesCh<strong>in</strong>a Japan Malaysia Philipp<strong>in</strong>es Thail<strong>and</strong>Indonesia Korea,Rep. ofCh<strong>in</strong>eseTaipeiS<strong>in</strong>gapore UnitedStatesMalaysiaCh<strong>in</strong>ese TaipeiPhilipp<strong>in</strong>esS<strong>in</strong>gaporeThail<strong>and</strong>United StatesVII. An evolutionaryperspective onproduction networks<strong>in</strong> the <strong>Asia</strong>-US regionVIII. <strong>Trade</strong> <strong>in</strong><strong>in</strong>termediate goodsSources: The <strong>Asia</strong>n International Input-Output Tables, 1985, 1995, 2000 <strong>and</strong> 2005 (prelim<strong>in</strong>ary), <strong>IDE</strong>-<strong>JETRO</strong>.IX. Vertical trade<strong>and</strong> trade <strong>in</strong><strong>value</strong> addedX. Cross-regionalspillover ofeconomic growth67
<strong>Trade</strong> Patterns <strong>and</strong> Global Value Cha<strong>in</strong>s <strong>in</strong> <strong>East</strong> <strong>Asia</strong>B. The impact of <strong>in</strong>ternational trade on employmentDeepen<strong>in</strong>g economic <strong>in</strong>terdependency has significantimplications for the employment structure of the region.Job opportunities travel across borders as countriesengage <strong>in</strong> <strong>in</strong>ternational trade, <strong>and</strong> the relationshipbetween trade <strong>and</strong> employment is always at the heart ofdebates over the issue of <strong>global</strong>ization.International trade affects employment <strong>in</strong> bothmacroeconomic <strong>and</strong> microeconomic ways. The numberof jobs associated with trade is determ<strong>in</strong>ed by overalltrade balances, with a positive balance favour<strong>in</strong>g a net<strong>in</strong>crease <strong>in</strong> dem<strong>and</strong> for labour. But dem<strong>and</strong> for labouris also affected by the structure of trade. Net exportsof services, for example, are more labour-<strong>in</strong>tensive thanthose of m<strong>in</strong><strong>in</strong>g. The composition of the labour forcedepends on the comparative advantage of each economy<strong>in</strong> <strong>global</strong> <strong>value</strong> <strong>cha<strong>in</strong>s</strong>; some economies focus on tasksrequir<strong>in</strong>g high-skilled employees, such as research <strong>and</strong>development (R&D), while others specialize <strong>in</strong> low-skilledmass production.The <strong>Asia</strong>n International Input-Output Table, whenconnected to the labour statistics of each <strong>in</strong>dividualcountry, can be extended to analys<strong>in</strong>g the impact of<strong>in</strong>ternational trade on employment. Table 1 presentsmatrices of the cross-border transfer of employmentopportunities among the countries of the region for 2000<strong>and</strong> 2005 (see the technical notes for the calculationmethod). The table gives the simulated number of jobsgenerated <strong>in</strong> each country (shown <strong>in</strong> the left column), bythe f<strong>in</strong>al dem<strong>and</strong> of its trade partners (shown <strong>in</strong> the toprow).The f<strong>in</strong>d<strong>in</strong>gs provide strong evidence for the benefitsof <strong>in</strong>ternational trade because of the numerous jobopportunities considered to have been generatedthrough countries’ engagement <strong>in</strong> regional trade.Also, the simulated numbers significantly <strong>in</strong>creasedover time for most countries, reflect<strong>in</strong>g the deepen<strong>in</strong>g<strong>in</strong>terdependency of regional employment.Table 1Cross-border transfer of employment opportunities, 2000 <strong>and</strong> 2005 (thous<strong>and</strong>s of persons)2000 Ch<strong>in</strong>a Indonesia Japan Korea,Rep. ofMalaysiaCh<strong>in</strong>eseTaipeiPhilipp<strong>in</strong>es S<strong>in</strong>gapore Thail<strong>and</strong> UnitedStatesCh<strong>in</strong>a 911 18,817 3,406 916 1,425 362 839 992 28,509 56,177Indonesia 1,138 3,733 702 612 591 244 525 399 5,406 13,350Japan 420 66 264 112 285 63 94 123 1,816 3,244Korea, Rep. of 340 32 373 30 88 31 25 29 736 1,685Malaysia 201 47 569 109 111 50 260 84 1,051 2,484Ch<strong>in</strong>ese Taipei 373 22 318 59 42 25 21 38 722 1,620Philipp<strong>in</strong>es 314 30 1,506 228 127 213 52 98 2,780 5,348S<strong>in</strong>gapore 33 8 43 18 31 20 14 16 146 328Thail<strong>and</strong> 473 149 1,539 182 278 243 123 247 2,516 5,751United States 250 38 822 237 69 214 45 65 61 1,801Total 3,543 1,303 27,720 5,206 2,221 3,190 956 2,128 1,839 43,682 91,787Total2005 Ch<strong>in</strong>a Indonesia Japan Korea,Rep. ofMalaysiaCh<strong>in</strong>eseTaipeiPhilipp<strong>in</strong>es S<strong>in</strong>gapore Thail<strong>and</strong> UnitedStatesCh<strong>in</strong>a 1,943 23,266 5,521 1,055 2,617 481 844 2,032 51,542 89,301Indonesia 1,795 3,032 746 610 417 166 686 508 4,422 12,382Japan 1,003 110 425 62 349 57 46 204 1,754 4,009Korea, Rep. of 727 44 330 20 71 18 12 45 599 1,866Malaysia 1,030 170 776 221 156 62 185 300 2,044 4,944Ch<strong>in</strong>ese Taipei 818 31 308 83 32 33 13 55 593 1,966Philipp<strong>in</strong>es 1,565 107 1,249 282 101 204 34 238 1,606 5,385S<strong>in</strong>gapore 82 59 69 58 27 15 12 23 110 456Thail<strong>and</strong> 1,203 422 1,568 246 249 213 94 122 2,418 6,536United States 406 56 661 245 40 147 48 69 82 1,753Total 8,629 2,942 31,258 7,827 2,195 4,189 973 2,010 3,486 65,089 128,598TotalSources: The <strong>Asia</strong>n International Input-Output Tables, 2000 <strong>and</strong> 2005 (prelim<strong>in</strong>ary), <strong>IDE</strong>-<strong>JETRO</strong>.68
Table 2 shows disaggregated results for each <strong>in</strong>dustrialsector <strong>in</strong> 2005. The simulated number for the agriculturalsector is remarkably large, yet the result requires care<strong>in</strong> its <strong>in</strong>terpretation. Full engagement of workforceis relatively rare <strong>in</strong> rural areas where agricultural<strong>in</strong>dustries predom<strong>in</strong>ate (the presence of “disguisedunemployment”), <strong>and</strong> it may thereby overstate the impacton employment creation of primary <strong>in</strong>dustries.Service sectors are generally considered labour<strong>in</strong>tensive.With<strong>in</strong> the service sector, the share of trade<strong>and</strong> transport is more or less the same for most countries.But there is significant variation <strong>in</strong> the “other services”section, reflect<strong>in</strong>g differences <strong>in</strong> the sort of bus<strong>in</strong>essescategorized under this head<strong>in</strong>g.I. From massdem<strong>and</strong> to <strong>global</strong>supply <strong>cha<strong>in</strong>s</strong>II. Organizationof the <strong>global</strong>production processTable 2Cross-border transfer of employment opportunities by <strong>in</strong>dustrial sector, 2005 (thous<strong>and</strong>s of persons <strong>and</strong>percentage)2005 Agriculture,forestry <strong>and</strong>fisheryCh<strong>in</strong>a 30,60734.3%Indonesia 5,38243.5%Japan 45111.2%M<strong>in</strong><strong>in</strong>g Manufactur<strong>in</strong>g Electricity,gas <strong>and</strong>water supply2,0172.3%3693.0%30.1%25,95229.1%1,96715.9%1,72242.9%9761.1%180.1%180.5%Construction2560.3%540.4%431.1%<strong>Trade</strong> <strong>and</strong>transport20,64423.1%3,44127.8%1,11927.9%Other services8,8499.9%1,1519.3%65316.3%Total89,301100.0%12,382100.0%4,009100.0%III. Infrastructureservices <strong>in</strong> <strong>global</strong><strong>value</strong> <strong>cha<strong>in</strong>s</strong>IV. The evolutionof tariff policiesKorea, Rep. of 25313.6%Malaysia 92518.7%Ch<strong>in</strong>ese Taipei 1266.4%60.3%280.6%20.1%79342.5%1,64033.2%1,17359.7%70.4%150.3%80.4%50.3%931.9%160.8%52127.9%1,74835.4%32216.4%28015.0%49510.0%31816.2%1,866100.0%4,944100.0%1,966100.0%V. Foreign direct<strong>in</strong>vestmentPhilipp<strong>in</strong>es 1,98236.8%S<strong>in</strong>gapore 71.5%Thail<strong>and</strong> 3,60055.1%390.7%00.00%140.2%1,16121.6%26758.6%1,50723.1%280.5%10.3%110.2%1833.4%20.5%80.1%1,62630.2%459.9%80812.4%3676.8%13329.2%5879.0%5,385100.0%456100.0%6,536100.0%VI. IntegrateddiversityUnited States 1106.3%201.1%67538.5%171.0%160.9%39522.5%51929.6%1,753100.0%Total 43,44333.8%2,4991.9%36,85828.7%Source: The <strong>Asia</strong>n International Input-Output Table, 2005 (prelim<strong>in</strong>ary), <strong>IDE</strong>-<strong>JETRO</strong>.1,0990.9%6780.5%30,66923.8%13,35210.4%128,598100.0%VII. An evolutionaryperspective onproduction networks<strong>in</strong> the <strong>Asia</strong>-US regionFigure 6 illustrates the contribution made to employmentcreation by both domestic <strong>and</strong> cross-border sources ofdem<strong>and</strong>. As can be seen, foreign f<strong>in</strong>al dem<strong>and</strong> is quiteimportant for job creation <strong>in</strong> many <strong>East</strong> <strong>Asia</strong>n countries.Particularly salient are the cases of Malaysia <strong>and</strong>S<strong>in</strong>gapore, followed by Ch<strong>in</strong>ese Taipei <strong>and</strong> Thail<strong>and</strong>. Incontrast, the United States <strong>and</strong> Japan, even allow<strong>in</strong>g forthe size of their economies, are far more domesticallyoriented. The figures refer to a pre-crisis year (2005),when <strong>global</strong> imbalances were grow<strong>in</strong>g. The postcrisisrebalanc<strong>in</strong>g of this macroeconomic distortionshould contribute to the establishment of a susta<strong>in</strong>ableproduction system <strong>in</strong> the <strong>Asia</strong>-US region.VIII. <strong>Trade</strong> <strong>in</strong><strong>in</strong>termediate goodsIX. Vertical trade<strong>and</strong> trade <strong>in</strong><strong>value</strong> addedX. Cross-regionalspillover ofeconomic growth69
<strong>Trade</strong> Patterns <strong>and</strong> Global Value Cha<strong>in</strong>s <strong>in</strong> <strong>East</strong> <strong>Asia</strong>Figure 6Contribution to employment creation, by source of dem<strong>and</strong>, 2005 (percentage)1009080706050403020100Ch<strong>in</strong>a Indonesia Japan Korea, Rep. of Malaysia Ch<strong>in</strong>ese Philipp<strong>in</strong>es S<strong>in</strong>gapore Thail<strong>and</strong> UnitedTaipeiStatesSource of employment creationDomestic f<strong>in</strong>al dem<strong>and</strong>Ch<strong>in</strong>a’s f<strong>in</strong>al dem<strong>and</strong>US f<strong>in</strong>al dem<strong>and</strong>Japan’s f<strong>in</strong>al dem<strong>and</strong>NIES3 f<strong>in</strong>al dem<strong>and</strong>ASEAN4 f<strong>in</strong>al dem<strong>and</strong>Other countriesSource: The <strong>Asia</strong>n International Input-Output Table, 2005 (prelim<strong>in</strong>ary), <strong>IDE</strong>-<strong>JETRO</strong>.Production techniques differ from country to country,accord<strong>in</strong>g to comparative advantages. Developedeconomies tend to become vertically specialized <strong>in</strong>highly-skilled tasks. Specialization can also lead tothe production of different varieties of broadly similarproducts. Work done by the economist Peter K. Schott<strong>in</strong>dicates, for example, that high-wage economiesproduce <strong>and</strong> export better quality products than their lowcostcompetitors. This greater variety of similar productsoffered by trade contributes to the f<strong>in</strong>al consumers’welfare by offer<strong>in</strong>g a choice of price <strong>and</strong> quality.The relative contribution of different labour skillsembedded <strong>in</strong> exports can be identified by pair<strong>in</strong>g<strong>in</strong>ternational <strong>in</strong>put-output data with other economic<strong>and</strong> labour surveys. The results presented <strong>in</strong> Figure7 are derived from prelim<strong>in</strong>ary data obta<strong>in</strong>ed by theWorld Input-Output Database (WIOD) project. Theycontrast the labour composition <strong>in</strong> net trade of three<strong>East</strong> <strong>Asia</strong>n countries (Ch<strong>in</strong>a, Japan <strong>and</strong> the Republic ofKorea), which represent different stages of economicdevelopment. Ch<strong>in</strong>a specializes <strong>in</strong> low-skill jobs, <strong>and</strong> thisspecialization has <strong>in</strong>creased s<strong>in</strong>ce 1995, reflect<strong>in</strong>g theparticular role the economy plays <strong>in</strong> <strong>East</strong> <strong>Asia</strong>n supply<strong>cha<strong>in</strong>s</strong> (as well as higher wages paid to unskilled factoryworkers). Japan, <strong>in</strong> contrast, has specialized <strong>in</strong> exportactivities that are <strong>in</strong>tensive <strong>in</strong> medium- <strong>and</strong> high-skilledlabour. The Republic of Korea, which had adopted anapproach halfway between the two, has recently movedcloser to the Japanese pattern.70
Figure 7Labour content of net trade by skill level, Ch<strong>in</strong>a, Japan <strong>and</strong> the Republic Korea, 1995-2006 (percentage)I. From massdem<strong>and</strong> to <strong>global</strong>supply <strong>cha<strong>in</strong>s</strong>1008060Ch<strong>in</strong>a1008060Japan1008060The Republic of KoreaII. Organizationof the <strong>global</strong>production process40200-20-4040200-20-4040200-20-40III. Infrastructureservices <strong>in</strong> <strong>global</strong><strong>value</strong> <strong>cha<strong>in</strong>s</strong>-60-60-60Low skill Medium skill High skillLow skill Medium skill High skillLow skill Medium skill High skill1995 2006Note: Percentage of the total <strong>value</strong> of the domestic labour cost embedded <strong>in</strong> traded products. Net trade represents exports m<strong>in</strong>us imports.Source: Adapted from M. Timmer (unpublished) on the basis of prelim<strong>in</strong>ary results from the WIOD project (www.wiod.org).IV. The evolutionof tariff policiesSimilar results are observed <strong>in</strong> case studies of the <strong>global</strong><strong>value</strong> <strong>cha<strong>in</strong>s</strong> of a specific product. Us<strong>in</strong>g the iPod asan example of <strong>global</strong> manufactur<strong>in</strong>g, L<strong>in</strong>den, Dedrick<strong>and</strong> Kraemer (2009) estimate that this product <strong>and</strong> itscomponents created about 41,000 jobs worldwide <strong>in</strong>2006, of which about 27,000 were outside the UnitedStates <strong>and</strong> 14,000 with<strong>in</strong> it (<strong>in</strong>clud<strong>in</strong>g retail). The jobslocated outside the United States were mostly <strong>in</strong> lowwagemanufactur<strong>in</strong>g. The employment generated with<strong>in</strong>the United States was more evenly divided between highwageeng<strong>in</strong>eers <strong>and</strong> managers (over 6,000 professional<strong>and</strong> eng<strong>in</strong>eer<strong>in</strong>g jobs) <strong>and</strong> low-wage retail <strong>and</strong> nonprofessionalworkers (close to 8,000, although thesejobs are not dependent on the cross-border organizationof the supply <strong>cha<strong>in</strong>s</strong>).V. Foreign direct<strong>in</strong>vestmentVI. IntegrateddiversityEndnotes1However, the level of heterogeneity, as def<strong>in</strong>ed by the <strong>in</strong>dustrialaverage of Coefficients of Variation, has decreased over time,from 45.8 <strong>in</strong> 1985 to 41.7 <strong>in</strong> 2005, show<strong>in</strong>g some convergence<strong>in</strong> <strong>in</strong>dustrial profiles among countries <strong>in</strong> the last two decades.2See Leontief (1986).3The issue is fully discussed <strong>in</strong> Ozaki (2004) for the caseof the EU, <strong>and</strong> <strong>in</strong> Washizu (2008) for the case of <strong>East</strong> <strong>Asia</strong>.The work here <strong>in</strong> this chapter is just to confirm the f<strong>in</strong>d<strong>in</strong>gs ofthese previous studies by us<strong>in</strong>g more recent data.VII. An evolutionaryperspective onproduction networks<strong>in</strong> the <strong>Asia</strong>-US regionVIII. <strong>Trade</strong> <strong>in</strong><strong>in</strong>termediate goodsIX. Vertical trade<strong>and</strong> trade <strong>in</strong><strong>value</strong> addedX. Cross-regionalspillover ofeconomic growth71
<strong>Trade</strong> Patterns <strong>and</strong> Global Value Cha<strong>in</strong>s <strong>in</strong> <strong>East</strong> <strong>Asia</strong>VII. An evolutionaryperspective on productionnetworks <strong>in</strong> the<strong>Asia</strong>-US region• In the last two decades, the regional production network of the <strong>Asia</strong>-USregion has been strengthened by a number of key players, while show<strong>in</strong>ga gradual shift of weight towards Ch<strong>in</strong>a.• The supply <strong>cha<strong>in</strong>s</strong> <strong>in</strong> <strong>East</strong> <strong>Asia</strong> are characterized by a high degree offragmentation <strong>and</strong> sophistication, <strong>in</strong>corporat<strong>in</strong>g substantial amounts of<strong>value</strong>-added from the countries <strong>in</strong>volved.• The grow<strong>in</strong>g presence of Ch<strong>in</strong>a <strong>and</strong> a relative decl<strong>in</strong>e of the United States<strong>and</strong> Japan can be seen <strong>in</strong> the <strong>in</strong>ternational distribution of <strong>value</strong> added<strong>and</strong> the emergence of a “tri-polar trade” structure.72
I. From massdem<strong>and</strong> to <strong>global</strong>supply <strong>cha<strong>in</strong>s</strong>II. Organizationof the <strong>global</strong>production processIII. Infrastructureservices <strong>in</strong> <strong>global</strong><strong>value</strong> <strong>cha<strong>in</strong>s</strong>ContentsIV. The evolutionof tariff policiesA. Evolution of regional production networksB. Cross-border transfer of <strong>value</strong> added <strong>in</strong> the <strong>Asia</strong>-US region7476V. Foreign direct<strong>in</strong>vestmentVI. IntegrateddiversityVII. An evolutionaryperspective onproduction networks<strong>in</strong> the <strong>Asia</strong>-US regionVIII. <strong>Trade</strong> <strong>in</strong><strong>in</strong>termediate goodsIX. Vertical trade<strong>and</strong> trade <strong>in</strong><strong>value</strong> addedX. Cross-regionalspillover ofeconomic growth73
<strong>Trade</strong> Patterns <strong>and</strong> Global Value Cha<strong>in</strong>s <strong>in</strong> <strong>East</strong> <strong>Asia</strong>A. Evolution of regional production networksThe last few decades have witnessed the rapiddevelopment of vertical production networks with<strong>in</strong> the<strong>Asia</strong>-US region. Production processes are fragmented<strong>in</strong>to several stages <strong>and</strong> countries specialize <strong>in</strong> eachproduction stage accord<strong>in</strong>g to their own comparativeadvantages.For World Bank economist Nihal Pitigala, <strong>East</strong> <strong>Asia</strong>’semerg<strong>in</strong>g economies have benefited considerably fromthe development of vertical production networks. Thesenetworks have enabled them to jo<strong>in</strong> at the productionstage that best corresponds to their level of technology,with the result that they have enjoyed rapid trade <strong>and</strong>output growth.In order to <strong>in</strong>vestigate the backdrop to the rapiddevelopment of vertical production networks, crossbordersupply <strong>cha<strong>in</strong>s</strong> <strong>in</strong> the <strong>Asia</strong>-US region will beevaluated from the perspective of the “strength” <strong>and</strong>“length” of their l<strong>in</strong>kages. Figure 1describes the evolutionof regional networks over the last two decades. Arrowsrepresent selected supply <strong>cha<strong>in</strong>s</strong> among the countries ofthe region, with the direction of the arrows correspond<strong>in</strong>gto the flow of <strong>in</strong>termediate products. Each arrow has twofeatures: thickness <strong>and</strong> length. The thickness <strong>in</strong>dicatesthe strength of l<strong>in</strong>kages between <strong>in</strong>dustries, while thelength, as measured aga<strong>in</strong>st the r<strong>in</strong>gs <strong>in</strong> the background,<strong>in</strong>dicates the level of technological fragmentation ofthat particular supply cha<strong>in</strong> (see Appendix 2 for thevisualization method.)In 1985, there were only four key players <strong>in</strong> the region:Indonesia (I), Japan (J), Malaysia (M) <strong>and</strong> S<strong>in</strong>gapore(S). The basic structure of the production network wasthat Japan built up supply <strong>cha<strong>in</strong>s</strong> from resource-richcountries like Indonesia <strong>and</strong> Malaysia. In this <strong>in</strong>itial phaseof regional development, Japan drew on a substantialamount of productive resources (natural resources) fromneighbour<strong>in</strong>g countries to feed to its domestic <strong>in</strong>dustries.By 1990 the number of key players had <strong>in</strong>creased.In addition to the four countries already mentioned,Japan had extended its supply <strong>cha<strong>in</strong>s</strong> for <strong>in</strong>termediateproducts to the Republic of Korea (K), Ch<strong>in</strong>ese Taipei(N) <strong>and</strong> Thail<strong>and</strong> (T). While still rely<strong>in</strong>g on the productiveresources of Indonesia <strong>and</strong> Malaysia, Japan started tosupply products to other <strong>East</strong> <strong>Asia</strong>n countries, especiallyto the newly <strong>in</strong>dustrialized economies (NIEs). This isthe phase when the relocation of Japanese productionbases to neighbour<strong>in</strong>g countries, triggered by the PlazaAgreement <strong>in</strong> 1985, was accelerat<strong>in</strong>g. It saw the build<strong>in</strong>gof strong l<strong>in</strong>kages between core parts’ suppliers <strong>in</strong> Japan<strong>and</strong> their foreign subsidiaries.Then <strong>in</strong> 1995, the United States (U) came <strong>in</strong>to thepicture. It drew on two key supply <strong>cha<strong>in</strong>s</strong> orig<strong>in</strong>at<strong>in</strong>g <strong>in</strong>Japan, one via Malaysia <strong>and</strong> the other via S<strong>in</strong>gapore.These two countries came to bridge the supply <strong>cha<strong>in</strong>s</strong>between <strong>East</strong> <strong>Asia</strong> <strong>and</strong> the United States. Also to benoted is the length of the arrows between Malaysia <strong>and</strong>S<strong>in</strong>gapore. Compared to others, their shortness <strong>in</strong>dicatesthat the supply <strong>cha<strong>in</strong>s</strong> <strong>in</strong>volve fewer production stages,suggest<strong>in</strong>g that the degree of process<strong>in</strong>g is relativelylow. The product flows between these countries areconsidered to be distributional rather than <strong>value</strong> add<strong>in</strong>g.In 2000, on the eve of its accession to the WTO, Ch<strong>in</strong>abegan to emerge as the third economic giant. The countryentered the arena with strong production l<strong>in</strong>kages to theRepublic of Korea <strong>and</strong> Ch<strong>in</strong>ese Taipei. It then ga<strong>in</strong>edaccess to Japanese supply <strong>cha<strong>in</strong>s</strong> through the latter.The United States also brought a new supply cha<strong>in</strong> fromthe Philipp<strong>in</strong>es (P), <strong>and</strong> thus the basic structure of thetri-polar production network <strong>in</strong> the <strong>Asia</strong>-US region wascompleted. 1The regional production networks thereafter showeddramatic development. By 2005, the centre of thenetwork had completely shifted to Ch<strong>in</strong>a, push<strong>in</strong>g theUnited States <strong>and</strong> Japan to the periphery. Ch<strong>in</strong>a becamethe core market for <strong>in</strong>termediate products, from whichf<strong>in</strong>al consumption goods were produced for export to theUnited States <strong>and</strong> to European countries. Also of note isthe nature of the supply <strong>cha<strong>in</strong>s</strong> that Ch<strong>in</strong>a develops withothers. The notable length of the arrows surround<strong>in</strong>gCh<strong>in</strong>a <strong>in</strong>dicates that the supply <strong>cha<strong>in</strong>s</strong> towards Ch<strong>in</strong>aare characterized by a high degree of fragmentation<strong>and</strong> sophistication, <strong>in</strong>corporat<strong>in</strong>g substantial amountsof <strong>value</strong>-added from each country <strong>in</strong>volved. Thecompetitiveness of Ch<strong>in</strong>ese exports, therefore, is notonly attributable to its cheap labour force, but also stemsfrom the sophisticated <strong>in</strong>termediate products it receivesfrom other <strong>East</strong> <strong>Asia</strong>n countries, as embedded <strong>in</strong> goodslabelled “Made <strong>in</strong> Ch<strong>in</strong>a”. 274
Figure 1Evolution of regional production networks, 1985-2005I. From massdem<strong>and</strong> to <strong>global</strong>supply <strong>cha<strong>in</strong>s</strong>I1985 1990KMJT JSINMSII. Organizationof the <strong>global</strong>production processIII. Infrastructureservices <strong>in</strong> <strong>global</strong><strong>value</strong> <strong>cha<strong>in</strong>s</strong>1995 2000IV. The evolutionof tariff policiesTJMSUTJMSUPV. Foreign direct<strong>in</strong>vestmentNNCKVI. IntegrateddiversityNTPJC2005MSKUICIJKMCh<strong>in</strong>aIndonesiaJapanRepublic of KoreaMalaysiaNPSTUCh<strong>in</strong>ese TaipeiPhilipp<strong>in</strong>esS<strong>in</strong>gaporeThail<strong>and</strong>United StatesVII. An evolutionaryperspective onproduction networks<strong>in</strong> the <strong>Asia</strong>-US regionVIII. <strong>Trade</strong> <strong>in</strong><strong>in</strong>termediate goodsIX. Vertical trade<strong>and</strong> trade <strong>in</strong><strong>value</strong> addedSource: <strong>IDE</strong>-<strong>JETRO</strong>.X. Cross-regionalspillover ofeconomic growth75
<strong>Trade</strong> Patterns <strong>and</strong> Global Value Cha<strong>in</strong>s <strong>in</strong> <strong>East</strong> <strong>Asia</strong>B. Cross-border transfer of <strong>value</strong> added <strong>in</strong> the <strong>Asia</strong>-US regionThe evolution of regional production networks, asillustrated above, has created a dist<strong>in</strong>ctive structure forthe <strong>Asia</strong>n-US production system, understood as the “tripolartrade through Ch<strong>in</strong>a” model. In this structure:1. <strong>East</strong> <strong>Asia</strong>n countries, except Ch<strong>in</strong>a, producesophisticated parts <strong>and</strong> components <strong>and</strong> exportthem to Ch<strong>in</strong>a,2. Ch<strong>in</strong>a assembles them <strong>in</strong>to f<strong>in</strong>al products, <strong>and</strong>3. these are further exported to the US market forconsumption.See chapter VIII (Section F) for more details on thesetrade <strong>in</strong>terconnections.The “tri-polar trade through Ch<strong>in</strong>a” system hassignificantly enhanced Ch<strong>in</strong>a’s presence <strong>in</strong> the region,as demonstrated <strong>in</strong> Figure 2. The figure shows crossbordertransfers of <strong>value</strong>-added for the years 1985<strong>and</strong> 2005 (see the technical notes for the calculationmethod). The vertical axis <strong>in</strong>dicates the degree of <strong>value</strong>addedthat each country is able to obta<strong>in</strong> from a givenlevel of f<strong>in</strong>al dem<strong>and</strong>s of other countries <strong>in</strong> the region (the<strong>value</strong>-added ga<strong>in</strong> potential). The horizontal axis showsthe degree of <strong>value</strong>-added that each country can “giveout” to others <strong>in</strong> the same fashion (the <strong>value</strong>-added giveoutpotential). It is apparent from the figure that Ch<strong>in</strong>a’spresence has dramatically <strong>in</strong>creased over the last twodecades, while the <strong>in</strong>fluence of the United States <strong>and</strong>Japan shows a sharp decl<strong>in</strong>e.Figure 2Cross-border transfer of <strong>value</strong> added <strong>in</strong> the <strong>Asia</strong>-US region, 1985 <strong>and</strong> 20055.04.54.03.5Value added ga<strong>in</strong> potential3.02.52.0Ch<strong>in</strong>aJapan1.5United States1.00.50.00.0 0.5 1.0 1.5 2.0 2.5 3.0 3.5 4.0 4.5 5.0Value added give-out potential19852005Sources: The <strong>Asia</strong>n International Input-Output Tables, 1985 <strong>and</strong> 2005 (prelim<strong>in</strong>ary), <strong>IDE</strong>-<strong>JETRO</strong>.76
Due to their relative size, other economies <strong>in</strong> the regionare less significant <strong>in</strong> terms of shap<strong>in</strong>g the structureof <strong>value</strong>-added distribution. Nevertheless, if we lookmore closely at the cluster by orig<strong>in</strong> (Figure 3), it turnsout that most of them have advanced <strong>in</strong> at least one ofthe two “potentials”, <strong>in</strong>dicat<strong>in</strong>g that they have becomemore <strong>in</strong>volved <strong>in</strong> regional production networks overthe decades. It is considered that these emerg<strong>in</strong>geconomies, as a group, now have a significant <strong>in</strong>fluenceon the distribution of regional <strong>value</strong>-added.Figure 3Cross-border transfer of <strong>value</strong>-added <strong>in</strong> the <strong>Asia</strong>-US region, 1985 <strong>and</strong> 2005, emerg<strong>in</strong>g economiesI. From massdem<strong>and</strong> to <strong>global</strong>supply <strong>cha<strong>in</strong>s</strong>II. Organizationof the <strong>global</strong>production process1.00.9Korea, Rep. ofIII. Infrastructureservices <strong>in</strong> <strong>global</strong><strong>value</strong> <strong>cha<strong>in</strong>s</strong>0.8Value added ga<strong>in</strong> potential0.70.60.50.40.3MalaysiaS<strong>in</strong>gaporeIndonesiaThail<strong>and</strong>Ch<strong>in</strong>ese TaipeiCh<strong>in</strong>aIV. The evolutionof tariff policiesV. Foreign direct<strong>in</strong>vestment0.20.1 Philipp<strong>in</strong>es0.00.0 0.1 0.2 0.3 0.4 0.5 0.6 0.7 0.8 0.9 1.0VI. IntegrateddiversityValue added give-out potential19852005Sources: The <strong>Asia</strong>n International Input-Output Tables, 1985 <strong>and</strong> 2005 (prelim<strong>in</strong>ary), <strong>IDE</strong>-<strong>JETRO</strong>.VII. An evolutionaryperspective onproduction networks<strong>in</strong> the <strong>Asia</strong>-US regionVIII. <strong>Trade</strong> <strong>in</strong><strong>in</strong>termediate goodsEndnotes1Interest<strong>in</strong>gly, none of the poles, i.e. the United States, Japan<strong>and</strong> Ch<strong>in</strong>a, shows a direct l<strong>in</strong>kage to either of the others.Instead, they are mutually connected only through the supply<strong>cha<strong>in</strong>s</strong> of other <strong>East</strong> <strong>Asia</strong>n countries. This feature persistedeven <strong>in</strong> 2005.2Chapter IX presents new measures of <strong>in</strong>ternational tradeaim<strong>in</strong>g at identify<strong>in</strong>g the orig<strong>in</strong> of <strong>value</strong>-added embedded <strong>in</strong>the f<strong>in</strong>al products of supply <strong>cha<strong>in</strong>s</strong>.IX. Vertical trade<strong>and</strong> trade <strong>in</strong><strong>value</strong> addedX. Cross-regionalspillover ofeconomic growth77
<strong>Trade</strong> Patterns <strong>and</strong> Global Value Cha<strong>in</strong>s <strong>in</strong> <strong>East</strong> <strong>Asia</strong>VIII. <strong>Trade</strong> <strong>in</strong><strong>in</strong>termediate goods• Intermediate goods dom<strong>in</strong>ate world merch<strong>and</strong>ise trade.• Europe <strong>and</strong> <strong>Asia</strong> lead trade <strong>in</strong> <strong>in</strong>termediate goods. Regional supply<strong>cha<strong>in</strong>s</strong> <strong>in</strong>volve huge <strong>in</strong>tra-<strong>Asia</strong>n imports of <strong>in</strong>termediate goods.• “Tri-polar trade” between Ch<strong>in</strong>a, the United States <strong>and</strong> Japan sees thelatter two export <strong>in</strong>termediates to Ch<strong>in</strong>a <strong>and</strong> get more <strong>and</strong> more f<strong>in</strong>algoods <strong>in</strong> return.• Intermediate products traded by <strong>Asia</strong>n economies are <strong>in</strong>creas<strong>in</strong>glycomplex.78
I. From massdem<strong>and</strong> to <strong>global</strong>supply <strong>cha<strong>in</strong>s</strong>II. Organizationof the <strong>global</strong>production processIII. Infrastructureservices <strong>in</strong> <strong>global</strong><strong>value</strong> <strong>cha<strong>in</strong>s</strong>ContentsIV. The evolutionof tariff policiesA. <strong>Trade</strong> <strong>in</strong> <strong>in</strong>termediates: An <strong>in</strong>dicator for offshor<strong>in</strong>g activitiesB. Intermediate goods drive world tradeC. Europe <strong>and</strong> <strong>Asia</strong> lead trade <strong>in</strong> <strong>in</strong>termediate goodsD. <strong>Asia</strong> imports more <strong>in</strong>termediate goods than it exportsE. Intra-<strong>Asia</strong>n trade <strong>in</strong> <strong>in</strong>termediate goods on the riseF. Bilateral trade <strong>in</strong> <strong>in</strong>termediate goods between Ch<strong>in</strong>a, Japan <strong>and</strong> the United StatesG. Towards more complex <strong>in</strong>termediate goods <strong>and</strong> concentrated trade80818285878889V. Foreign direct<strong>in</strong>vestmentVI. IntegrateddiversityVII. An evolutionaryperspective onproduction networks<strong>in</strong> the <strong>Asia</strong>-US regionVIII. <strong>Trade</strong> <strong>in</strong><strong>in</strong>termediate goodsIX. Vertical trade<strong>and</strong> trade <strong>in</strong><strong>value</strong> addedX. Cross-regionalspillover ofeconomic growth79
<strong>Trade</strong> Patterns <strong>and</strong> Global Value Cha<strong>in</strong>s <strong>in</strong> <strong>East</strong> <strong>Asia</strong>A. <strong>Trade</strong> <strong>in</strong> <strong>in</strong>termediates: An <strong>in</strong>dicator for offshor<strong>in</strong>g activitiesThe grow<strong>in</strong>g <strong>in</strong>ternational flows <strong>in</strong> <strong>in</strong>termediate goods 1reflect the evolution of <strong>in</strong>tra-<strong>in</strong>dustry trade, the impactof offshor<strong>in</strong>g <strong>and</strong> the prom<strong>in</strong>ent role of networks ofmult<strong>in</strong>ational enterprises (MNEs) <strong>in</strong> world trade. Acommon way to assess trade <strong>in</strong> <strong>in</strong>termediate goods isto use the United Nations’ Broad Economic Categories(BEC) classification, which groups commodities byma<strong>in</strong> end-use, pr<strong>in</strong>cipally dist<strong>in</strong>guish<strong>in</strong>g betweenconsumption, capital <strong>and</strong> <strong>in</strong>termediate goods.The def<strong>in</strong>ition <strong>and</strong> measurement of trade <strong>in</strong> “<strong>in</strong>termediateservices” is much more complex <strong>and</strong> subject tolimited data availability. 2 Currently no official tradeclassification enables precise differentiation betweenf<strong>in</strong>al <strong>and</strong> <strong>in</strong>termediate services. One way of assess<strong>in</strong>g<strong>in</strong>ternationally-outsourced <strong>in</strong>termediate services is toconsider trade <strong>in</strong> “other commercial services”, which isa very broad aggregate <strong>in</strong>clud<strong>in</strong>g a number of bus<strong>in</strong>essservices that can be subject to offshor<strong>in</strong>g. See, forexample, Chapter II, Section C, on “Bus<strong>in</strong>ess processoutsourc<strong>in</strong>g <strong>and</strong> computer services”.Figure 1 illustrates the historical evolution of trade <strong>in</strong><strong>in</strong>termediates along with that of total trade <strong>in</strong> merch<strong>and</strong>ise<strong>and</strong> commercial services. It is apparent from the chartthat trade <strong>in</strong> <strong>in</strong>termediate goods <strong>and</strong> services hassignificantly <strong>in</strong>creased <strong>in</strong> the last 20 years. This reflects<strong>in</strong>creased <strong>global</strong>ization <strong>and</strong> the development of offshor<strong>in</strong>gactivities (“slic<strong>in</strong>g-up of the <strong>value</strong>-added cha<strong>in</strong>” 3 ) <strong>in</strong> themanufactur<strong>in</strong>g <strong>and</strong> bus<strong>in</strong>ess services sectors, lead<strong>in</strong>g tothe “trade <strong>in</strong> tasks” that has grown so markedly <strong>in</strong> recentyears.Figure 1Trends <strong>in</strong> world trade <strong>in</strong> merch<strong>and</strong>ise <strong>and</strong> commercial services, 1995-2009 (Index, 1995=100)Note: Data are normalized at 100 <strong>in</strong> 1995.Sources: UN Comtrade Database <strong>and</strong> WTO estimates.80
B. Intermediate goods drive world tradeI. From massdem<strong>and</strong> to <strong>global</strong>supply <strong>cha<strong>in</strong>s</strong>In 2009, world exports of <strong>in</strong>termediate goods exceededthe cumulated amounts recorded for consumption <strong>and</strong>capital goods (see Figure 2) <strong>and</strong> represented 51 percent of non-fuel merch<strong>and</strong>ise exports. World exports of<strong>in</strong>termediate goods nearly doubled between 1995 <strong>and</strong>2009, from around US$ 2,774 to US$ 5,373 billion (seeFigure 3), an annual average growth rate of 4.8 per cent.A feature of world trade <strong>in</strong> <strong>in</strong>termediate goods is thatits share of total trade has rema<strong>in</strong>ed quite stable overthe past 15 years. As a matter of fact, world exports <strong>in</strong>the three categories of goods – capital, consumption<strong>and</strong> <strong>in</strong>termediates – evolved at similar speeds between1995 <strong>and</strong> 2009, <strong>in</strong> l<strong>in</strong>e with the overall growth of totalmerch<strong>and</strong>ise trade. Intermediate goods are embedded <strong>in</strong>f<strong>in</strong>al goods <strong>and</strong> the <strong>value</strong>s generated with<strong>in</strong> the different<strong>in</strong>termediate trade flows are reflected <strong>in</strong> the subsequentflows of the f<strong>in</strong>al (consumer or capital) goods, hencethe stability of shares <strong>and</strong> growth between the threecategories.The apparent contradiction with the growth of <strong>in</strong>ternationalsupply <strong>cha<strong>in</strong>s</strong> is expla<strong>in</strong>ed ma<strong>in</strong>ly by statistical effectsof report<strong>in</strong>g <strong>in</strong>tra-firm trade <strong>and</strong> trade <strong>in</strong> goods sent/received for process<strong>in</strong>g, <strong>and</strong> the difficulty of dist<strong>in</strong>guish<strong>in</strong>g<strong>in</strong>termediate from f<strong>in</strong>al goods <strong>in</strong> some categories. 4Figure 2World non-fuel merch<strong>and</strong>ise exports by type of good, 1995-2009 (<strong>in</strong> billions of US$ <strong>and</strong> percentage)II. Organizationof the <strong>global</strong>production processIII. Infrastructureservices <strong>in</strong> <strong>global</strong><strong>value</strong> <strong>cha<strong>in</strong>s</strong>IV. The evolutionof tariff policies60006Value (US$)5000400030002000100054321Annual average growth rate (%)V. Foreign direct<strong>in</strong>vestmentVI. Integrateddiversity0ValueIntermediategoodsSources: UN Comtrade Database <strong>and</strong> WTO estimates.ConsumptiongoodsCapitalgoodsOthers notclassifiedFigure 3World non-fuel merch<strong>and</strong>ise exports by type of good, 1995-2009 (<strong>in</strong> billions of US$)800070006000500040003000Annual average growth rate 1995 to 20090VII. An evolutionaryperspective onproduction networks<strong>in</strong> the <strong>Asia</strong>-US regionVIII. <strong>Trade</strong> <strong>in</strong><strong>in</strong>termediate goodsIX. Vertical trade<strong>and</strong> trade <strong>in</strong><strong>value</strong> added200010000199519981999Sources: UN Comtrade Database <strong>and</strong> WTO estimates.2000200120022003200420052006200720082009Intermediate goodsConsumption goodsCapital goodsX. Cross-regionalspillover ofeconomic growth81
<strong>Trade</strong> Patterns <strong>and</strong> Global Value Cha<strong>in</strong>s <strong>in</strong> <strong>East</strong> <strong>Asia</strong>C. Europe <strong>and</strong> <strong>Asia</strong> lead trade <strong>in</strong> <strong>in</strong>termediate goodsIn 2009, the production <strong>and</strong> export of <strong>in</strong>termediate <strong>in</strong>putshave been ma<strong>in</strong>ly concentrated <strong>in</strong> Europe, <strong>Asia</strong> <strong>and</strong> NorthAmerica. Unlike those of Europe <strong>and</strong> North America, <strong>Asia</strong>nexports of <strong>in</strong>termediate goods grew much faster (7.2 percent) than the world average (4.8 per cent) between 1995<strong>and</strong> 2009. Exports of <strong>in</strong>termediate goods from a fewdevelop<strong>in</strong>g regions (Central <strong>and</strong> South America, Africa) <strong>and</strong>the Commonwealth of Independent States (CIS) economiesgrew much faster than those from Western economies(see Figure 4). The volume of trade <strong>in</strong> <strong>in</strong>termediate goodsgives an <strong>in</strong>dication of the level of <strong>in</strong>tegration of a region <strong>in</strong>production shar<strong>in</strong>g. Although the overall <strong>value</strong> is still very lowcompared with Western economies, develop<strong>in</strong>g economiestend to jo<strong>in</strong> <strong>global</strong> supply <strong>cha<strong>in</strong>s</strong> at a susta<strong>in</strong>ed pace s<strong>in</strong>ceit is a clear opportunity for them to enter <strong>in</strong>ternational tradethrough production shar<strong>in</strong>g.The shares of North American <strong>and</strong> European exportsof <strong>in</strong>termediate goods <strong>in</strong> world trade decl<strong>in</strong>ed notablybetween 1995 <strong>and</strong> 2009 (see Figure 5), whereas <strong>Asia</strong>’s<strong>in</strong>creased by almost 10 percentage po<strong>in</strong>ts, reach<strong>in</strong>g 35 percent of world exports of <strong>in</strong>termediate <strong>in</strong>puts <strong>in</strong> 2009. WhileNorth American <strong>and</strong> European economies tend to furtherdiversify their trade <strong>in</strong> <strong>in</strong>termediates towards services,new <strong>in</strong>ternational production capacity <strong>and</strong> related trade <strong>in</strong>manufactur<strong>in</strong>g <strong>in</strong>termediates are <strong>in</strong>creas<strong>in</strong>gly orig<strong>in</strong>at<strong>in</strong>g <strong>in</strong><strong>Asia</strong> as a result of <strong>in</strong>dustrial fragmentation <strong>in</strong> this region.Figure 4Regional Exports of <strong>in</strong>termediate goods, 1995-2009 (<strong>in</strong> billions of US$ <strong>and</strong> percentage)6000Value (US$)500040003000200010001412108642Annual average growth rate (%)0WorldEurope<strong>Asia</strong>NorthAmericaC & SAmericaCISMiddle<strong>East</strong>Africa0Value (2009)Annual average growth rate 1995 to 2009Note: No data is available for Middle <strong>East</strong> for 1995.Sources: UN Comtrade Database <strong>and</strong> WTO estimates.Figure 5Regional shares <strong>in</strong> world exports of <strong>in</strong>termediate goods (percentage)<strong>Asia</strong>26% 17%North America3%Central <strong>and</strong> SouthAmerica<strong>Asia</strong>35%14%North America4%Central <strong>and</strong> SouthAmerica1%Middle <strong>East</strong>1%Africa2%CISSources: UN Comtrade Database <strong>and</strong> WTO estimates.1995 200950%Europe822%Middle <strong>East</strong>2%Africa2%CIS41%Europe
As shown <strong>in</strong> Figure 6, <strong>in</strong>termediate goods constitutemore than 60 per cent of <strong>Asia</strong>’s total imports. <strong>Asia</strong> isthe world’s key player <strong>in</strong> <strong>in</strong>ternational production shar<strong>in</strong>g,ma<strong>in</strong>ly <strong>in</strong> the process<strong>in</strong>g <strong>and</strong> assembl<strong>in</strong>g of manufacturedgoods. However, the share of exports <strong>in</strong> <strong>in</strong>termediates isaround 50 per cent as <strong>Asia</strong> tends to transform imported<strong>in</strong>termediate goods <strong>in</strong>to f<strong>in</strong>al goods for export.Figure 7 illustrates the magnitude of <strong>in</strong>tra-regionalimports of <strong>in</strong>termediate goods as well as of major <strong>in</strong>terregionalflows. At US$ 2,050 billion, Europe had thehighest <strong>value</strong> of <strong>in</strong>tra-regional imports <strong>in</strong> 2008. Intraregionaltrade represented nearly half of its total importsof <strong>in</strong>termediate goods. Europe was followed by <strong>Asia</strong>, withUS$ 1,479 billion. Intra-regional exchanges representedmore than 64 per cent of <strong>Asia</strong>’s imports of <strong>in</strong>termediategoods, which underll<strong>in</strong>es the high <strong>in</strong>tensity of productionshar<strong>in</strong>g <strong>in</strong> that part of the world.Figure 6Shares of <strong>in</strong>termediate goods <strong>in</strong> total non-fuel exports <strong>and</strong> imports, 1995-2009<strong>Asia</strong>Imports<strong>Asia</strong> has not only developed its own <strong>in</strong>dustrial networks,it has also contributed to production <strong>cha<strong>in</strong>s</strong> l<strong>in</strong>kedto Western economies. Accord<strong>in</strong>gly, the major <strong>in</strong>terregionalflows <strong>in</strong> <strong>in</strong>termediate goods <strong>in</strong>volved <strong>Asia</strong> eitheras the orig<strong>in</strong> (exporter) or as the dest<strong>in</strong>ation (importer)of trade flows, essentially with its core partners NorthAmerica <strong>and</strong> Europe. For <strong>in</strong>stance, the highest <strong>in</strong>terregionalimport flows of <strong>in</strong>termediate goods wereobserved between Europe <strong>and</strong> <strong>Asia</strong> (US$ 384 billion)<strong>and</strong> between North America <strong>and</strong> <strong>Asia</strong> (US$ 330 billion).<strong>Asia</strong> has been a major supplier of <strong>in</strong>termediate goodsto North America. As a result, North America’s <strong>in</strong>traregionalimports of <strong>in</strong>termediate goods (US$ 412 billion)were – with a share of 39 per cent of its total imports ofthis type of goods – of lower importance than for <strong>Asia</strong><strong>and</strong> Europe.Exports1995 2000 2005 2008 2009 1995 2000 2005 2008 200960 62 65 66 64CIS66 67 70 7066I. From massdem<strong>and</strong> to <strong>global</strong>supply <strong>cha<strong>in</strong>s</strong>II. Organizationof the <strong>global</strong>production processIII. Infrastructureservices <strong>in</strong> <strong>global</strong><strong>value</strong> <strong>cha<strong>in</strong>s</strong>IV. The evolutionof tariff policiesV. Foreign direct<strong>in</strong>vestmentAfrica6455 55 5542Central<strong>and</strong>SouthAmerica67 66 6663 64VI. IntegrateddiversityWorld 54 5452 53 52Central<strong>and</strong>SouthAmerica52 55 55 55 52Middle<strong>East</strong>Africa61 646546 47755969 6961VII. An evolutionaryperspective onproduction networks<strong>in</strong> the <strong>Asia</strong>-US regionEurope 53 50 5149 48Middle<strong>East</strong>51 5249NorthAmerica 49 47 46 4642 4143<strong>Asia</strong> 52 52 52 53 53NorthAmerica58 56 56 57 52World 52 52 52 53 51VIII. <strong>Trade</strong> <strong>in</strong><strong>in</strong>termediate goodsIX. Vertical trade<strong>and</strong> trade <strong>in</strong><strong>value</strong> addedCIS31Sources: UN Comtrade Database <strong>and</strong> WTO estimates.5142 4139Europe 49 49 4948 47X. Cross-regionalspillover ofeconomic growth83
<strong>Trade</strong> Patterns <strong>and</strong> Global Value Cha<strong>in</strong>s <strong>in</strong> <strong>East</strong> <strong>Asia</strong>Figure 7Intra-regional <strong>and</strong> major <strong>in</strong>ter-regional imports of <strong>in</strong>termediate goods, 2008 (<strong>in</strong> billions of US$)Imports of <strong>Asia</strong>from Europe:US$ 301 bnShare of 39%Intra-North Americanimports US$ 412 bnImports of Europefrom North America:US$ 202 bnShare of 71%Imports of Europefrom <strong>Asia</strong>:US$ 384 bnIntra-Europeanimports US$ 2050 bnImports of NorthAmerica from Europe:US$ 223 bnShare of 64%Intra-<strong>Asia</strong>nimports US$ 1479 bnImports of NorthAmerica from <strong>Asia</strong>:US$ 330 bnImports of <strong>Asia</strong>from North America:US$ 287 bnTotal <strong>Trade</strong>Intra <strong>Trade</strong>Share of 25%Intra-CSAimports US$ 63 bnShare of 10%Intra-Africaimports US$ 19 bnSources: UN Comtrade Database <strong>and</strong> WTO estimates.The level of imports of <strong>in</strong>termediate goods for Central <strong>and</strong>South America, Africa, <strong>and</strong> Australia <strong>and</strong> Oceania was low,especially for <strong>in</strong>tra-regional exchanges – all with shares ofbelow 30 per cent of total imports of <strong>in</strong>termediate goods.This reflects the fact that these regions are still newcomersto <strong>in</strong>ternational production <strong>cha<strong>in</strong>s</strong>.84
D. <strong>Asia</strong> imports more <strong>in</strong>termediate goods than it exportsI. From massdem<strong>and</strong> to <strong>global</strong>supply <strong>cha<strong>in</strong>s</strong>In 2009, <strong>Asia</strong> imported more <strong>in</strong>termediate goods than itexported, show<strong>in</strong>g its high level of engagement <strong>in</strong> worldproduction <strong>cha<strong>in</strong>s</strong>. <strong>Asia</strong>’s develop<strong>in</strong>g economies werethe pr<strong>in</strong>cipal contributors to this outcome as advancedeconomies like Japan <strong>and</strong> the Republic of Korea exportedmore <strong>in</strong>termediate goods than they imported. Ch<strong>in</strong>aplays the role of assembler with<strong>in</strong> the <strong>Asia</strong>n region, itsimports <strong>in</strong> <strong>in</strong>termediate goods account<strong>in</strong>g for more than33 per cent of <strong>Asia</strong>n imports of <strong>in</strong>termediates <strong>in</strong> 2009.As a consequence, Ch<strong>in</strong>a’s rank<strong>in</strong>gs – <strong>in</strong> terms of theshare of <strong>in</strong>termediates <strong>in</strong> its total trade – are <strong>in</strong>vertedfor exports <strong>and</strong> imports (see Figure 8). Economies likeIndia <strong>and</strong> Viet Nam also had markedly higher shares of<strong>in</strong>termediates <strong>in</strong> their imports than <strong>in</strong> their exports. Theopposite was the case for Japan <strong>and</strong> Ch<strong>in</strong>ese Taipei.Ch<strong>in</strong>ese Taipei had the highest share of <strong>in</strong>termediategoods <strong>in</strong> its exports among the major <strong>Asia</strong>n traders. 5II. Organizationof the <strong>global</strong>production processIII. Infrastructureservices <strong>in</strong> <strong>global</strong><strong>value</strong> <strong>cha<strong>in</strong>s</strong>Figure 8Share of <strong>in</strong>termediate goods <strong>in</strong> total non-fuel trade of major <strong>Asia</strong>n traders, 2009 or latest year available(percentage)IV. The evolutionof tariff policiesExportsImports0 10 20 30 40 50 60 70 80Ch<strong>in</strong>ese72TaipeiS<strong>in</strong>gapore 680 10 20 30 40 50 60 70Philipp<strong>in</strong>es 76Ch<strong>in</strong>a 7580V. Foreign direct<strong>in</strong>vestmentIndonesia 68India 73Malaysia 68Philipp<strong>in</strong>es 63Hong Kong(Ch<strong>in</strong>a)Japan 56Republic ofKorea54<strong>Asia</strong> 53Thail<strong>and</strong> 52India 52Ch<strong>in</strong>a 39Viet Nam 33Sources: UN Comtrade Database <strong>and</strong> WTO estimates.Figure 9 presents the level of trade <strong>in</strong> <strong>in</strong>termediate goods<strong>and</strong> average annual growth rates of the major <strong>Asia</strong>ntraders. With<strong>in</strong> the top five exporters (Ch<strong>in</strong>a, Japan, theRepublic of Korea, Hong Kong (Ch<strong>in</strong>a) <strong>and</strong> S<strong>in</strong>gapore),Ch<strong>in</strong>a grew the strongest. Its average growth rate of17 per cent is significantly above the <strong>Asia</strong>n average.Of all the economies shown, only Viet Nam’s exports of<strong>in</strong>termediate goods grew at a faster speed dur<strong>in</strong>g thisperiod (23 per cent).59Malaysia 72Ch<strong>in</strong>eseTaipei71Thail<strong>and</strong> 71Republic ofKoreaViet Nam 70Indonesia 66S<strong>in</strong>gapore 66<strong>Asia</strong> 64Hong Kong(Ch<strong>in</strong>a)Japan 51Ch<strong>in</strong>a was not only the top importer of <strong>in</strong>termediategoods <strong>in</strong> <strong>Asia</strong>, it was the largest <strong>in</strong> the world. This reflectsthe recent development of process<strong>in</strong>g activities <strong>in</strong> Ch<strong>in</strong>abased on <strong>in</strong>puts from other <strong>Asia</strong>n economies, as wellas the development of a domestic <strong>in</strong>dustry. Ch<strong>in</strong>a, India<strong>and</strong> Viet Nam have been the most dynamic importers of<strong>in</strong>termediate goods with<strong>in</strong> the last 15 years, with averagegrowth rates of between 12 <strong>and</strong> 16 per cent, far beyondthe regional average of 7 per cent.6070VI. IntegrateddiversityVII. An evolutionaryperspective onproduction networks<strong>in</strong> the <strong>Asia</strong>-US regionVIII. <strong>Trade</strong> <strong>in</strong><strong>in</strong>termediate goodsIX. Vertical trade<strong>and</strong> trade <strong>in</strong><strong>value</strong> addedX. Cross-regionalspillover ofeconomic growth85
<strong>Trade</strong> Patterns <strong>and</strong> Global Value Cha<strong>in</strong>s <strong>in</strong> <strong>East</strong> <strong>Asia</strong>Figure 9Exports <strong>and</strong> imports of <strong>in</strong>termediate goods of major <strong>Asia</strong>n traders, 1995-2009 (<strong>in</strong> billions of US$ <strong>and</strong>percentage)500Exports2545040020Value3503002502001501510Annual average growth rate1005500Ch<strong>in</strong>aJapanRepublic ofKoreaHong Kong(Ch<strong>in</strong>a)S<strong>in</strong>gaporeCh<strong>in</strong>eseTaipeiIndiaMalaysiaThail<strong>and</strong>IndonesiaPhilipp<strong>in</strong>esViet Nam0Value (2009)Annual average growthrate 1995 to 2009<strong>Asia</strong>: Annual averagegrowth rate 1995 to 2009Imports7001860016Value5004003002001001412108642Annual average growth rate0Ch<strong>in</strong>aRepublic ofKoreaHong Kong(Ch<strong>in</strong>a)JapanS<strong>in</strong>gaporeCh<strong>in</strong>eseTaipeiIndiaMalaysiaThail<strong>and</strong>IndonesiaViet NamPhilipp<strong>in</strong>es0Value (2009)Annual average growthrate 1995 to 2009<strong>Asia</strong>: Annual averagegrowth rate 1995 to 2009Sources: UN Comtrade Database <strong>and</strong> WTO estimates.86
E. Intra-<strong>Asia</strong>n trade <strong>in</strong> <strong>in</strong>termediate goods on the riseI. From massdem<strong>and</strong> to <strong>global</strong>supply <strong>cha<strong>in</strong>s</strong>Figure 10 shows that for most of the major <strong>Asia</strong>n traders,the share of <strong>in</strong>tra-regional imports of <strong>in</strong>termediate goods<strong>in</strong>creased significantly between 1995 <strong>and</strong> 2009. In thecase of Hong Kong (Ch<strong>in</strong>a), it was over 83 per cent forimports <strong>in</strong> 2009. For almost all economies, the <strong>in</strong>tra-<strong>Asia</strong>n part represented more than half of their trade <strong>in</strong><strong>in</strong>termediate products, with the exception of India (40 percent for both flows <strong>in</strong> 2009). The importance of the regionalmarket rema<strong>in</strong>ed more or less stable for Ch<strong>in</strong>a’s imports.But it fell for its exports from 70 per cent <strong>in</strong> 1995 to 51 percent <strong>in</strong> 2009. This is l<strong>in</strong>ked to Ch<strong>in</strong>a’s grow<strong>in</strong>g <strong>in</strong>tegration<strong>in</strong> world markets (the grow<strong>in</strong>g <strong>global</strong> diversification ofCh<strong>in</strong>a’s markets, both for f<strong>in</strong>al <strong>and</strong> <strong>in</strong>termediate goods)<strong>and</strong> the generally strong <strong>in</strong>crease <strong>in</strong> Ch<strong>in</strong>a’s trade volume.Ch<strong>in</strong>a’s trade surplus is generally l<strong>in</strong>ked to process<strong>in</strong>gtrade activities 6 (see Chapter 2 on <strong>global</strong> production).As a result, it has positive trade balances with developedeconomies <strong>in</strong> process<strong>in</strong>g trade, while the opposite is thecase for most of its <strong>East</strong>-<strong>Asia</strong>n partners. Also, India’s<strong>in</strong>tra-<strong>Asia</strong>n share <strong>in</strong> total exports of <strong>in</strong>termediate goodsrema<strong>in</strong>ed quite stable (41 per cent <strong>in</strong> 1995, 40 per cent <strong>in</strong>2009), while its share of imports <strong>in</strong>creased.II. Organizationof the <strong>global</strong>production processIII. Infrastructureservices <strong>in</strong> <strong>global</strong><strong>value</strong> <strong>cha<strong>in</strong>s</strong>Figure 10Intra-<strong>Asia</strong>n imports <strong>and</strong> exports of <strong>in</strong>termediate goods, <strong>value</strong> <strong>and</strong> shares <strong>in</strong> total trade, 1995 <strong>and</strong> 2009(<strong>in</strong> billions of US$ <strong>and</strong> percentage)Imports90 700IV. The evolutionof tariff policiesShare8070605040302010600500400300200100ValueV. Foreign direct<strong>in</strong>vestmentVI. Integrateddiversity0Hong Kong(Ch<strong>in</strong>a)Thail<strong>and</strong>IndonesiaMalaysiaS<strong>in</strong>gaporeRepublicof KoreaShare (1995) Share (2009) Value (2009)Exports90 500Ch<strong>in</strong>aJapanIndia0VII. An evolutionaryperspective onproduction networks<strong>in</strong> the <strong>Asia</strong>-US regionShare807060504030201045040035030025020015010050ValueVIII. <strong>Trade</strong> <strong>in</strong><strong>in</strong>termediate goodsIX. Vertical trade<strong>and</strong> trade <strong>in</strong><strong>value</strong> added0Hong Kong(Ch<strong>in</strong>a)S<strong>in</strong>gaporeThail<strong>and</strong>MalaysiaIndonesiaJapanRepublicof KoreaShare (1995) Share (2009) Value (2009)Ch<strong>in</strong>aIndia0X. Cross-regionalspillover ofeconomic growthSources: UN Comtrade Database <strong>and</strong> WTO estimates.87
<strong>Trade</strong> Patterns <strong>and</strong> Global Value Cha<strong>in</strong>s <strong>in</strong> <strong>East</strong> <strong>Asia</strong>F. Bilateral trade <strong>in</strong> <strong>in</strong>termediate goods between Ch<strong>in</strong>a, Japan <strong>and</strong> theUnited StatesIn both 1995 <strong>and</strong> 2009, US exports to Ch<strong>in</strong>a consistedma<strong>in</strong>ly of <strong>in</strong>termediate goods, while its imports werepr<strong>in</strong>cipally f<strong>in</strong>al goods, highlight<strong>in</strong>g Ch<strong>in</strong>a’s role as amanufacturer for the United States (see Figure 11). A shiftwith<strong>in</strong> f<strong>in</strong>al goods from consumption towards capital goodscan be observed <strong>in</strong> the import structure of the UnitedStates, vis-à-vis Ch<strong>in</strong>a. It is also noticeable for Japan.At the same time, the share of capital goods <strong>in</strong> USexports to Ch<strong>in</strong>a decreased markedly (a phenomenonthat is also due to the <strong>in</strong>creas<strong>in</strong>g use of offshor<strong>in</strong>g byUS MNEs), although <strong>in</strong> <strong>value</strong> terms they grew at anaverage 8 per cent per year. The situation between1995 <strong>and</strong> 2009 is quite similar for bilateral Japan-Ch<strong>in</strong>atrade. The structure of trade between Japan <strong>and</strong> theUnited States rema<strong>in</strong>ed quite stable for Japan’s importsfrom the United States, while the share of capital goods<strong>in</strong> Japanese exports to the United States decreasedbetween 1995 <strong>and</strong> 2009.Figure 11Bilateral trade flows between Ch<strong>in</strong>a, the United States <strong>and</strong> Japan, 1995 versus 2009, by type of good(percentage)UnitedStates1995200918% 22% 53% 8%16% 22% 58% 4%26% 6%47% 20%17% 8% 44% 32%19952009Japan2009199519952009Capital GoodsConsumption GoodsIntermediate Goods31% 43% 24%15% 66% 18%5%13%71% 11%29% 66%2%3%2%1%29% 6% 62%4%17% 69% 11%4%6% 62% 26% 6%20% 44% 34%2%20091995Others <strong>in</strong>cl. fuels/non-specified19952009Ch<strong>in</strong>aSource: UN Comtrade Database.88
G. Towards more complex <strong>in</strong>termediate goods <strong>and</strong> concentrated tradeI. From massdem<strong>and</strong> to <strong>global</strong>supply <strong>cha<strong>in</strong>s</strong>As shown <strong>in</strong> Figure 12, the share of complex 7<strong>in</strong>termediary products <strong>in</strong> total exports of <strong>in</strong>termediategoods has <strong>in</strong>creased significantly for all selected <strong>Asia</strong>ntraders s<strong>in</strong>ce 1996, with a particularly sharp <strong>in</strong>crease <strong>in</strong>2009. Shares on the import side rema<strong>in</strong>ed more stableover the years, with the noticeable exception of Japanwhere it grew cont<strong>in</strong>uously, reach<strong>in</strong>g 46 per cent <strong>in</strong>2009. Japan’s high specialization <strong>in</strong> <strong>in</strong>tegrated circuits(see Figure 13) clearly impacts on its overall trade <strong>in</strong> thecomplex products category.Figure 13 shows the top 10 <strong>in</strong>termediate productstraded by Ch<strong>in</strong>a <strong>and</strong> Japan <strong>in</strong> 2009. Out of around 2,800products present <strong>in</strong> this end-use category, the top 10made up 26 per cent of Ch<strong>in</strong>a’s exports <strong>and</strong> 39 per centof its imports.Figure 12Share of high complexity <strong>in</strong>termediate goods <strong>in</strong> total exports/imports of <strong>in</strong>termediate goods (percentage)80ExportsII. Organizationof the <strong>global</strong>production processIII. Infrastructureservices <strong>in</strong> <strong>global</strong><strong>value</strong> <strong>cha<strong>in</strong>s</strong>IV. The evolutionof tariff policies70605040V. Foreign direct<strong>in</strong>vestment3020100Japan Korea, Rep. of Ch<strong>in</strong>a Ch<strong>in</strong>ese Taipei Thail<strong>and</strong> Malaysia Philipp<strong>in</strong>esVI. Integrateddiversity8070199620002009ImportsVII. An evolutionaryperspective onproduction networks<strong>in</strong> the <strong>Asia</strong>-US region60504030VIII. <strong>Trade</strong> <strong>in</strong><strong>in</strong>termediate goods20100Thail<strong>and</strong> Malaysia Korea, Rep. of Japan Philipp<strong>in</strong>esCh<strong>in</strong>ese TaipeiCh<strong>in</strong>aIX. Vertical trade<strong>and</strong> trade <strong>in</strong><strong>value</strong> added1996Source: UN Comtrade Database.20002009X. Cross-regionalspillover ofeconomic growth89
<strong>Trade</strong> Patterns <strong>and</strong> Global Value Cha<strong>in</strong>s <strong>in</strong> <strong>East</strong> <strong>Asia</strong>Figure 13Top 10 products <strong>in</strong> exports <strong>and</strong> imports of <strong>in</strong>termediate goods(shares <strong>in</strong> total exports/imports of <strong>in</strong>termediate goods, percentage), 2009Ch<strong>in</strong>aExportsParts <strong>and</strong>accessories ofdata process<strong>in</strong>gequipment nesMonolithic <strong>in</strong>tegratedcircuitsParts of l<strong>in</strong>etelephone/telegraphequipment, nesPhotosensitive/photovoltaic/LEDsemiconductor devicesElectronic pr<strong>in</strong>tedcircuitsParts for radio/TVtransmit/receiveequipment, nesStructures <strong>and</strong> partsof structures, iron orsteel, nesParts of pr<strong>in</strong>t<strong>in</strong>gmach<strong>in</strong>ery <strong>and</strong>ancillary equipmentTaps, cocks,valves <strong>and</strong> similarappliances, nesElectric conductors,nes < 80 volts, withconnectors0 5 10 15 20ImportsMonolithic<strong>in</strong>tegrated circuitsIron ore,concentrate, not ironpyrites,unagglomeratedSoya beansCopper cathodes <strong>and</strong>sections of cathodesunwroughtParts of l<strong>in</strong>e telephone/telegraph equipment,nesParts <strong>and</strong> accessoriesof data process<strong>in</strong>gequipment nesElectronicpr<strong>in</strong>ted circuitsCopper ores <strong>and</strong>concentratesCopper/copperalloy waste orscrapParts for radio/TVtransmit/receiveequipment, nes0 5 10 15 20JapanExportsMonolithic<strong>in</strong>tegrated circuitsParts of pr<strong>in</strong>t<strong>in</strong>gmach<strong>in</strong>ery <strong>and</strong>ancillary equipmentTransmissions formotor vehiclesParts for radio/TVtransmit/receiveequipment, nesMotor vehicleparts nesPhotosensitive/photovoltaic/LEDsemiconductor devicesParts for sparkignitioneng<strong>in</strong>esexcept aircraftParts of l<strong>in</strong>etelephone/telegraphequipment, nesChemical prep,allied <strong>in</strong>Electrical switch,protector, connecterfor < 1kV nes0 5 10 15 20ImportsMonolithic<strong>in</strong>tegrated circuitsCopper ores <strong>and</strong>concentratesIron ore, concentrate,not iron pyrites,unagglomeratedMaize except seed cornParts <strong>and</strong> accessoriesof data process<strong>in</strong>gequipment nesParts of l<strong>in</strong>etelephone/telegraphequipment, nesParts for radio/TVtransmit/receiveequipment, nesIgnition/other wir<strong>in</strong>gsets for vehicles/aircraft/shipAlum<strong>in</strong>iumunwrought, notalloyedHeterocyclic compoundswith N-hetero-atom(s)only, nes0 5 10 15 20Source: UN Comtrade Database.For Japan, too, the top 10 products took a high shareof the total trade of <strong>in</strong>termediate goods, totall<strong>in</strong>g 23 percent for exports <strong>and</strong> 26 per cent for imports. For bothflows, monolithic <strong>in</strong>tegrated circuits were the mosttraded<strong>in</strong>termediate product of Japan – <strong>and</strong> were alsoCh<strong>in</strong>a’s largest import. Generally speak<strong>in</strong>g, the IT <strong>and</strong>electronic sectors take a huge share of the most-traded<strong>in</strong>termediate goods <strong>in</strong> <strong>Asia</strong>.90
EndnotesI. From massdem<strong>and</strong> to <strong>global</strong>supply <strong>cha<strong>in</strong>s</strong>1The def<strong>in</strong>ition for <strong>in</strong>termediate goods applied <strong>in</strong> this chapter<strong>in</strong>cludes all parts <strong>and</strong> accessories (BEC codes 42 <strong>and</strong> 53) aswell as <strong>in</strong>dustrial primary <strong>and</strong> processed <strong>in</strong>termediate goods(BEC codes 111, 121, 21, 22). The “fuels <strong>and</strong> lubricants”category (BEC code 3) was excluded.2See Miroudot et al. (2009).3WTO (2008), p. 37.4See Sturgeon <strong>and</strong> Gereffi (2009).5The follow<strong>in</strong>g twelve economies, referred to as “Major <strong>Asia</strong>ntraders”, represented around 95 per cent of <strong>Asia</strong>’s trade <strong>in</strong><strong>in</strong>termediate goods <strong>in</strong> 2009: Ch<strong>in</strong>a, Hong Kong (Ch<strong>in</strong>a), India,Indonesia, Japan, the Republic of Korea, Malaysia, Philipp<strong>in</strong>es,S<strong>in</strong>gapore, Ch<strong>in</strong>ese Taipei, Thail<strong>and</strong> <strong>and</strong> Viet Nam.6See X<strong>in</strong>g (2011).7For the def<strong>in</strong>ition of “product complexity” see Abdon et al.(2010).II. Organizationof the <strong>global</strong>production processIII. Infrastructureservices <strong>in</strong> <strong>global</strong><strong>value</strong> <strong>cha<strong>in</strong>s</strong>IV. The evolutionof tariff policiesV. Foreign direct<strong>in</strong>vestmentVI. IntegrateddiversityVII. An evolutionaryperspective onproduction networks<strong>in</strong> the <strong>Asia</strong>-US regionVIII. <strong>Trade</strong> <strong>in</strong><strong>in</strong>termediate goodsIX. Vertical trade<strong>and</strong> trade <strong>in</strong><strong>value</strong> addedX. Cross-regionalspillover ofeconomic growth91
<strong>Trade</strong> Patterns <strong>and</strong> Global Value Cha<strong>in</strong>s <strong>in</strong> <strong>East</strong> <strong>Asia</strong>IX. Vertical trade <strong>and</strong>trade <strong>in</strong> <strong>value</strong> added:Towards new measuresof <strong>in</strong>ternational trade• The evolution of <strong>global</strong> supply <strong>cha<strong>in</strong>s</strong> <strong>and</strong> the related expansionof vertical trade call for the development of new measurements of<strong>in</strong>ternational trade.• <strong>Trade</strong> <strong>in</strong> <strong>value</strong> added takes <strong>in</strong>to account the fragmentation of the <strong>value</strong><strong>cha<strong>in</strong>s</strong> <strong>and</strong> provides a decomposition of gross exports by domestic <strong>and</strong>foreign orig<strong>in</strong>.• New perspectives for trade analysis can be explored through the<strong>value</strong> added approach.92
<strong>Trade</strong> Patterns <strong>and</strong> Global Value Cha<strong>in</strong>s <strong>in</strong> <strong>East</strong> <strong>Asia</strong>A. Measur<strong>in</strong>g trade from a different perspectiveGlobal production <strong>cha<strong>in</strong>s</strong> have blurred the relevance ofsome conventional trade <strong>in</strong>dicators, like bilateral tradebalances, when products are “made <strong>in</strong> the world” ratherthan <strong>in</strong> a s<strong>in</strong>gle country. The f<strong>in</strong>al product <strong>and</strong> the <strong>value</strong>added that goes <strong>in</strong>to it come from different places (seeFigure 1). The speed <strong>and</strong> depth of such changes have ledto the need to revise statistical concepts <strong>and</strong> methods(national accounts, balance of payments, customsbasedtrade statistics) for measur<strong>in</strong>g trade flows. At thesame time, new approaches have been explored <strong>and</strong>developed to adapt traditional statistics <strong>and</strong> to betterevaluate how economies fit <strong>in</strong>to the new <strong>global</strong> economy.Vertical trade is one of the new elements of <strong>in</strong>ternationalexchanges that require the application of <strong>in</strong>novativemetrics. The production of f<strong>in</strong>al goods (ready forconsumption) relies on successive production <strong>and</strong> tradesteps <strong>in</strong> which countries that belong to a supply cha<strong>in</strong>create goods <strong>and</strong> services <strong>and</strong> export them to othercountries as <strong>in</strong>puts for further process<strong>in</strong>g <strong>and</strong> (re-)export. The sequence ends once the f<strong>in</strong>al goods havereached their dest<strong>in</strong>ation market.Attribut<strong>in</strong>g the entire commercial <strong>value</strong> of an exportedgood to the last l<strong>in</strong>k of the cha<strong>in</strong> – the economy export<strong>in</strong>gthe f<strong>in</strong>al good – can lead to a statistical bias <strong>and</strong> tomisunderst<strong>and</strong><strong>in</strong>gs, which may alter trade analysis <strong>and</strong>have potential implications for trade policy <strong>and</strong> multilateraltrade negotiations.Box 1. The concept of “country of orig<strong>in</strong>” <strong>in</strong> questionThe concept of “country of orig<strong>in</strong>”, which is used for the compilation of customs-based merch<strong>and</strong>ise trade statistics, has becomepartially obsolete as various operations lead<strong>in</strong>g to the production of f<strong>in</strong>al consumption goods – from design to manufacture ofcomponents <strong>and</strong> assembly – have spread across the world. As illustrated <strong>in</strong> the example of the Boe<strong>in</strong>g 787 Dreaml<strong>in</strong>er (seeFigure 1), more <strong>and</strong> more products are effectively “made <strong>in</strong> the world”, rather than made <strong>in</strong> a specific economy.In order to deal with this difficulty, a set of criteria – the “rules of orig<strong>in</strong>” – has been established by the WTO to determ<strong>in</strong>e wherea product comes from. These rules are applied essentially to the implementation of trade policy <strong>in</strong>struments, such as antidump<strong>in</strong>g<strong>and</strong> countervail<strong>in</strong>g duties, orig<strong>in</strong> mark<strong>in</strong>g <strong>and</strong> safeguard measures.The rules applied to trade statistics to determ<strong>in</strong>e the most appropriate country of orig<strong>in</strong> of a trade flow differ from those used fortrade policy. When two or more countries take part <strong>in</strong> the production of a good, its orig<strong>in</strong> can change whenever a “substantialtransformation” of the product has been made, or when the product changes name, tariff code, character or use (for <strong>in</strong>stance froma wheel to a car) dur<strong>in</strong>g a manufactur<strong>in</strong>g step. Due to the constra<strong>in</strong>ts to be met when implement<strong>in</strong>g such criteria, the concepts<strong>and</strong> def<strong>in</strong>itions applied to merch<strong>and</strong>ise trade statistics 1 propose other types of partner country attribution, such as the “countryof purchase”, the “country of consignment” or the “country of shipment”, which deviate from the actual manufactur<strong>in</strong>g source ofthe product. The World Customs Organization (WCO) <strong>and</strong> the WTO are driv<strong>in</strong>g a process of harmonization of the def<strong>in</strong>itions <strong>and</strong>criteria applied to rules of orig<strong>in</strong>.But <strong>in</strong> all cases, the full <strong>value</strong> of the product is assigned to one country. This does not reflect the geographical fragmentation ofthe production cha<strong>in</strong>. A more recent methodological development, the “trade <strong>in</strong> <strong>value</strong> added” approach, can help circumvent thedifficulty of assign<strong>in</strong>g the country of orig<strong>in</strong> faced by traditional trade statistics. This additional measure of <strong>in</strong>ternational trade flowsenables the domestic content embedded <strong>in</strong> exports to be assigned to each country that participated <strong>in</strong> the supply cha<strong>in</strong> that ledup to production of the f<strong>in</strong>al good.94
Figure 1The fragmentation of production: The example of the Boe<strong>in</strong>g 787 Dreaml<strong>in</strong>erI. From massdem<strong>and</strong> to <strong>global</strong>supply <strong>cha<strong>in</strong>s</strong>W<strong>in</strong>g box: JapanW<strong>in</strong>g ice protection: UKVertical stabilizer: USRaked w<strong>in</strong>g tips: KoreaRear fuselage: USCentre fuselage: ItalyLavatories: JapanForward fuselage: Japan, USEscape slides: USDoors & w<strong>in</strong>dows: USFlight deck seats: UKII. Organizationof the <strong>global</strong>production processIII. Infrastructureservices <strong>in</strong> <strong>global</strong><strong>value</strong> <strong>cha<strong>in</strong>s</strong>Horizontal stabilizer: ItalyAuxiliary power unit: USPassenger doors: FranceCargo doors: SwedenPrepreg composites: JapanL<strong>and</strong><strong>in</strong>g gear: FranceElectric brakes: FranceTires: JapanFlight deck controls: USEng<strong>in</strong>es: US, UKEng<strong>in</strong>e nacelles: USCentre w<strong>in</strong>g box: JapanIV. The evolutionof tariff policiesV. Foreign direct<strong>in</strong>vestmentTools/Software: FranceNavigation: USPilot control system: USWir<strong>in</strong>g: FranceF<strong>in</strong>al assembly: Boe<strong>in</strong>gCommercial Airplanes, USVI. IntegrateddiversitySource: Meng <strong>and</strong> Miroudot (2011).B. The notion of <strong>value</strong> added <strong>in</strong> trade flows<strong>Trade</strong> <strong>in</strong> <strong>value</strong> added takes <strong>in</strong>to account the specificityof trade occurr<strong>in</strong>g between the different actors of aproduction cha<strong>in</strong>. While traditional trade statisticsrecord trade across borders on a gross basis, <strong>and</strong> mightdouble- or even multi-count vertical trade flows, trade <strong>in</strong><strong>value</strong> added estimates commercial flows on a net basis,at each step of the vertical trad<strong>in</strong>g cha<strong>in</strong>. It allows thespecificity of the new bus<strong>in</strong>ess model beh<strong>in</strong>d <strong>global</strong>manufactur<strong>in</strong>g to be <strong>in</strong>corporated, complement<strong>in</strong>g usualtrade statistics, where trade <strong>in</strong> goods <strong>and</strong> services isprogressively be<strong>in</strong>g substituted by “trade <strong>in</strong> tasks”.Address<strong>in</strong>g the domestic <strong>value</strong> added <strong>in</strong>corporated <strong>in</strong>exported goods can – <strong>in</strong>ter alia – help economies:• to identify the sources of <strong>in</strong>ternationalcompetitiveness <strong>and</strong> comparative advantages <strong>and</strong>to better reflect the actual contribution of the various<strong>in</strong>dustrial sectors <strong>in</strong> the production process of itsexported goods• to evaluate the actual impact of foreign trade oneconomic growth <strong>and</strong> employment• to provide another angle for the exam<strong>in</strong>ation ofbilateral trade balances or regional transactions• to question the economic relevance of some tradepolicy <strong>in</strong>struments, such as antidump<strong>in</strong>g, which mayaffect national bus<strong>in</strong>esses <strong>and</strong> “damage the supply<strong>cha<strong>in</strong>s</strong> of <strong>global</strong>ized companies”. 2VII. An evolutionaryperspective onproduction networks<strong>in</strong> the <strong>Asia</strong>-US regionVIII. <strong>Trade</strong> <strong>in</strong><strong>in</strong>termediate goodsIX. Vertical trade<strong>and</strong> trade <strong>in</strong><strong>value</strong> addedX. Cross-regionalspillover ofeconomic growth95
<strong>Trade</strong> Patterns <strong>and</strong> Global Value Cha<strong>in</strong>s <strong>in</strong> <strong>East</strong> <strong>Asia</strong>Box 2. On the measurement of <strong>value</strong> addedThe domestic content of a country’s exports is often referred to as the <strong>value</strong>-added content of exports. In such cases, the <strong>value</strong>added of an exported good comprises the good’s total <strong>value</strong> m<strong>in</strong>us direct <strong>and</strong> <strong>in</strong>direct imported <strong>in</strong>puts, <strong>and</strong> <strong>in</strong>cludes all thedomestic <strong>in</strong>termediate goods <strong>and</strong> services used for the production of the good. From a methodological po<strong>in</strong>t of view, this is notso different from the notion of sectoral <strong>value</strong> added derived from the system of national accounts, which corresponds to the f<strong>in</strong>al<strong>value</strong> of the output of an <strong>in</strong>dustry, net of the goods <strong>and</strong> services it purchased from other <strong>in</strong>dustries or imported for its production.The domestic content of any export will <strong>in</strong>clude the direct <strong>value</strong> added from the export<strong>in</strong>g <strong>in</strong>dustrial sector, plus the <strong>value</strong> addedfrom other domestic sectors <strong>in</strong>directly embedded dur<strong>in</strong>g the production process. In addition, some correction can be done tomeasure the domestic content of imported <strong>in</strong>puts (re-imports).Figure 2 illustrates a simplified vertical production cha<strong>in</strong><strong>in</strong>volv<strong>in</strong>g three countries. The production sequencestarts <strong>in</strong> Malaysia <strong>and</strong> <strong>in</strong> the United States with themanufactur<strong>in</strong>g of car components (for example, bodyparts, tachometer) for export to Thail<strong>and</strong>, where thenext production phase takes place. A Thai productionunit comb<strong>in</strong>es the imported components with domesticparts <strong>and</strong> accessories <strong>in</strong>to the f<strong>in</strong>al assembly of the carpredest<strong>in</strong>ed for the US market. One of the characteristicsof the car f<strong>in</strong>ally purchased <strong>in</strong> the United States is thatit is composed of elements orig<strong>in</strong>at<strong>in</strong>g from variouscountries, <strong>in</strong>clud<strong>in</strong>g the United States. The specificity oftrade occurr<strong>in</strong>g between the different actors of the cha<strong>in</strong>leads to some questions:Which is the share <strong>in</strong> the <strong>value</strong> of the car exported to theUnited States to be attributed to Thail<strong>and</strong>, the ultimateexporter <strong>in</strong> the cha<strong>in</strong>, or <strong>in</strong>deed to US producers? Whatis the foreign content of Malaysian or Thai exports?The trade <strong>in</strong> <strong>value</strong> added approach addresses thesequestions.The “<strong>value</strong> added” column <strong>in</strong> the diagram highlightsthe sources of domestic <strong>value</strong> added <strong>in</strong> each country<strong>in</strong>volved <strong>in</strong> the cha<strong>in</strong>. In this example, it is assumed thatMalaysia <strong>and</strong> the United States produce car componentsfrom scratch, without us<strong>in</strong>g any foreign <strong>in</strong>put. Thus, the<strong>value</strong> <strong>in</strong> the “vertical specialization” column, reflect<strong>in</strong>gthe amount of imported <strong>in</strong>put <strong>in</strong> their respective exportsto Thail<strong>and</strong>, is set to zero.The <strong>value</strong> of Malaysia’s <strong>and</strong> US exports to Thail<strong>and</strong> isthe same whatever the valuation method applied (i.e. the<strong>value</strong> added or traditional method); however, this is notthe case when evaluat<strong>in</strong>g Thail<strong>and</strong>’s exports to the UnitedStates. Accord<strong>in</strong>g to traditional measurement, Thail<strong>and</strong>’sexports to the United States amount to a <strong>value</strong> of 100,<strong>in</strong>clud<strong>in</strong>g the <strong>value</strong> added of parts <strong>and</strong> componentsimported from Malaysia <strong>and</strong> the United States itself. Thisdemonstrates the double-count<strong>in</strong>g issue observed withtraditional trade statistics s<strong>in</strong>ce the <strong>value</strong> of <strong>in</strong>termediategoods manufactured <strong>in</strong> Malaysia <strong>and</strong> <strong>in</strong> the UnitedStates are counted twice: once when the goods areexported from these countries to Thail<strong>and</strong> <strong>and</strong> aga<strong>in</strong> ascomponents of the car exported from Thail<strong>and</strong> to theUnited States. For this reason, Thail<strong>and</strong>’s exports tothe United States are numerically overstated when oneconsiders the whole production process. As shown <strong>in</strong>the example, measur<strong>in</strong>g trade flows <strong>in</strong> <strong>value</strong> added termsovercomes this problem. The domestic <strong>value</strong> added ofThail<strong>and</strong>’s exports to the United States amounts to 75(see Figure 2, “VA measure” column), exclud<strong>in</strong>g the <strong>value</strong>of goods non-sourced from Thail<strong>and</strong>. S<strong>in</strong>ce <strong>value</strong> addedis one of the components of gross exports, the estimateof trade <strong>in</strong> <strong>value</strong> added is necessarily equal or lowerthan the traditional <strong>value</strong>. In parallel, the level of verticalspecialization for Thai exports is set to 25, gather<strong>in</strong>g the<strong>value</strong>s of all <strong>in</strong>puts imported to produce the car.It would require an enormous amount of work to measuredirectly the different sources of added <strong>value</strong> for eachproduct traded <strong>in</strong> the world. An <strong>in</strong>direct way of estimat<strong>in</strong>gvertical trade <strong>and</strong> trade <strong>in</strong> <strong>value</strong> added relies on <strong>in</strong>putoutput(I-O) tables or – preferably – their <strong>in</strong>ternationalcounterparts, <strong>in</strong>ternational <strong>in</strong>put-output (II-O) tables.These comb<strong>in</strong>e national accounts <strong>and</strong> bilateral tradedata on goods <strong>and</strong> services <strong>in</strong>to a consistent framework.II-Os allow the <strong>value</strong> added conta<strong>in</strong>ed <strong>in</strong> exports to beevaluated <strong>and</strong> decomposed <strong>in</strong>to its foreign <strong>and</strong> domesticcontent (see Box 3).The domestic content of exports corresponds to theaccumulation of the <strong>value</strong> added <strong>in</strong>corporated <strong>in</strong> eachof the various domestic sectors that contributed to thesupply cha<strong>in</strong>. The foreign content of exports, or importcontent of exports, serves as an estimate of the tradebetween countries <strong>in</strong>volved <strong>in</strong> <strong>in</strong>ternational production<strong>cha<strong>in</strong>s</strong>. It can be measured through the application ofthe vertical specialization (VS) formula, developed byHummels et al. (2001), based on the use of II-Os. Thus,the impact of the fragmentation of production <strong>cha<strong>in</strong>s</strong> on<strong>in</strong>ternational trade can be assessed by comput<strong>in</strong>g thevertical specialization phenomenon.96
Figure 2Measur<strong>in</strong>g <strong>value</strong> added <strong>and</strong> vertical specialization through an <strong>in</strong>ternational production cha<strong>in</strong>:an illustrative example (hypothetical <strong>value</strong>s <strong>and</strong> constellation)Production cha<strong>in</strong>Value VerticalAdded Specialization(VA)VAmeasureExportTraditionalmeasureI. From massdem<strong>and</strong> to <strong>global</strong>supply <strong>cha<strong>in</strong>s</strong>II. Organizationof the <strong>global</strong>production processMALAYSIAProduction of parts <strong>and</strong>componentsTHAILAND1001010III. Infrastructureservices <strong>in</strong> <strong>global</strong><strong>value</strong> <strong>cha<strong>in</strong>s</strong>Foreign <strong>in</strong>put (Malaysian orig<strong>in</strong>)+Foreign <strong>in</strong>put (US orig<strong>in</strong>)+Capital + labor40IV. The evolutionof tariff policies+Domestic <strong>in</strong>put=F<strong>in</strong>al good35V. Foreign direct<strong>in</strong>vestmentUNITED STATESF<strong>in</strong>al consumption25(=10+15)075(=40+35)15100(=10+40+35+15)15VI. IntegrateddiversityProduction of parts<strong>and</strong> components15Source: WTO Secretariat.Export flowBox 3. The <strong>in</strong>put-output tables, a statistical tool for the <strong>in</strong>direct measurement of trade <strong>in</strong> <strong>value</strong> addedBased on the old statistical concept of the “tableau économique”, developed <strong>in</strong> the 18th century by François Quesnay, the <strong>in</strong>putoutput(I-O) tables represent a nation’s economy <strong>in</strong> a matrix form, <strong>in</strong>clud<strong>in</strong>g <strong>in</strong>ternational exchanges. The I-O model was furtherdeveloped by Wassily Leontief <strong>in</strong> the middle of the 20th century. 3International <strong>in</strong>put-output (II-O) tables enable the orig<strong>in</strong> <strong>and</strong> the use of <strong>in</strong>termediate goods <strong>and</strong> services to be identified bycountry <strong>and</strong> sector.I-O (or II-O) tables provide relevant assets for the analysis of trade verticality as they make clear the <strong>in</strong>ter-sectoral nature of themodern production processes <strong>and</strong> their <strong>in</strong>ternational connections. Thus, they take <strong>in</strong>to account all backward l<strong>in</strong>kages betweencountries <strong>and</strong> sectors present <strong>in</strong> the table, <strong>and</strong> they capture the <strong>value</strong> of imported <strong>in</strong>puts used directly <strong>and</strong> <strong>in</strong>directly (at all stagesof a country’s production) <strong>in</strong> the manufactur<strong>in</strong>g of exported goods. They can also trace the domestic content of imports, like theUS parts embedded <strong>in</strong> the car imported <strong>in</strong>to the United States from Thail<strong>and</strong> <strong>in</strong> Figure 2.Although data limitations <strong>and</strong> methodological constra<strong>in</strong>ts exist, the I-O framework constitutes a relevant statistical tool to analysetrade from a different <strong>and</strong> complementary perspective <strong>in</strong> comparison to traditional trade statistics.International statistical cooperation is be<strong>in</strong>g organized to improve the data coverage, availability <strong>and</strong> quality of II-Os, 4 which – <strong>in</strong>the com<strong>in</strong>g years – will foster the development of such a tool for the study of trade <strong>and</strong> its l<strong>in</strong>k to other macroeconomic variableslike employment <strong>and</strong> environmental factors.VII. An evolutionaryperspective onproduction networks<strong>in</strong> the <strong>Asia</strong>-US regionVIII. <strong>Trade</strong> <strong>in</strong><strong>in</strong>termediate goodsIX. Vertical trade<strong>and</strong> trade <strong>in</strong><strong>value</strong> addedX. Cross-regionalspillover ofeconomic growth97
<strong>Trade</strong> Patterns <strong>and</strong> Global Value Cha<strong>in</strong>s <strong>in</strong> <strong>East</strong> <strong>Asia</strong>C. Vertical specialization <strong>in</strong> <strong>East</strong> <strong>Asia</strong> <strong>and</strong> the United StatesThe follow<strong>in</strong>g calculations are based on the <strong>IDE</strong>-<strong>JETRO</strong><strong>Asia</strong>n <strong>in</strong>put-output (AIO) tables cover<strong>in</strong>g n<strong>in</strong>e <strong>Asia</strong>ncountries (Ch<strong>in</strong>a, Indonesia, Japan, the Republic ofKorea, Malaysia, the Philipp<strong>in</strong>es, S<strong>in</strong>gapore, Ch<strong>in</strong>eseTaipei <strong>and</strong> Thail<strong>and</strong>) as well as the United States.Figure 3Historical evolution of the vertical specialization of selected <strong>Asia</strong>n economies <strong>and</strong> the United States,1985-2008 (percentage)706050403020JapanCh<strong>in</strong>ese TaipeiCh<strong>in</strong>aRepublic of KoreaS<strong>in</strong>gaporeIndonesiaThail<strong>and</strong>United States9 <strong>Asia</strong>n Reporters100198519901995200020052008Note: The “<strong>Asia</strong> 9 reporters” aggregate <strong>in</strong>cludes Malaysia <strong>and</strong> the Philipp<strong>in</strong>es, not shown <strong>in</strong> this figure.Source: The <strong>Asia</strong>n <strong>in</strong>ternational <strong>in</strong>put-output table, <strong>IDE</strong>-<strong>JETRO</strong>.The trade-weighted average share of vertical specialization(VS) of the n<strong>in</strong>e countries, available <strong>in</strong> the AIO data set,<strong>in</strong>creased by more than 47 per cent between 1985 <strong>and</strong>2008, reach<strong>in</strong>g 28 per cent <strong>in</strong> 2008 (see Figure 3). Allcountries’ VS <strong>in</strong>creased noticeably dur<strong>in</strong>g that period.Indonesia <strong>and</strong> Ch<strong>in</strong>a’s VS presented the highest growth;their shares of imported goods <strong>in</strong> exports have more th<strong>and</strong>oubled (even tripled <strong>in</strong> the case of Indonesia) s<strong>in</strong>ce1985. These countries jo<strong>in</strong>ed the regional production<strong>cha<strong>in</strong>s</strong> later than other countries, which is reflected <strong>in</strong> theirlow VS shares observed <strong>in</strong> 1985.A few <strong>patterns</strong> of evolution can be observed:• S<strong>in</strong>gapore <strong>and</strong> Ch<strong>in</strong>ese Taipei presented shares ofimported <strong>in</strong>puts <strong>in</strong> exports largely above the group’saverage. In 2008, 58 per cent of S<strong>in</strong>gaporeanexports were made up of imported content. Due totheir high degree of specialization, ma<strong>in</strong>ly <strong>in</strong> logistics<strong>and</strong> high technology, these economies have alwaysbeen central to <strong>Asia</strong>n production networks (seeChapters II <strong>and</strong> VIII).• High VS shares were observed for the Republicof Korea <strong>and</strong> Thail<strong>and</strong>. S<strong>in</strong>ce the 1980s, Thail<strong>and</strong>has become a regional manufactur<strong>in</strong>g hub play<strong>in</strong>gthe role of an export-platform, specialized – <strong>in</strong>teralia – <strong>in</strong> the automotive <strong>in</strong>dustry <strong>and</strong> used by variousforeign manufacturers (e.g. Toyota, Mazda <strong>and</strong> Ford).• The VS rates noticed for Japan <strong>and</strong> Indonesiawere far below the group’s average. The evolutionof Japan’s VS has been similar to that of theUnited States. Their shares <strong>in</strong>creased significantlybetween 1995 <strong>and</strong> 2008, most probably due tothe expansion of offshor<strong>in</strong>g <strong>and</strong> <strong>in</strong>tra-firm activitiescarried out by Japanese <strong>and</strong> US MNEs. The lowVS shares observed for these countries overall canbe related to their economic size, which enablesthem to produce a large proportion of parts <strong>and</strong>components domestically (see Chapter VI for more<strong>in</strong>formation on respective production systems).Interest<strong>in</strong>gly, the VS observed for Indonesia isclose to that of the two developed economies, withonly 13 per cent of imported content <strong>in</strong> its exports<strong>in</strong> 2008, a figure that has even slightly decreased98
s<strong>in</strong>ce 2000. The reason lies <strong>in</strong> Indonesia’s exportstructure, which is essentially composed of primaryproducts that do not require <strong>in</strong>tensive use offoreign <strong>in</strong>puts (agricultural goods, fuels <strong>and</strong> m<strong>in</strong><strong>in</strong>gaccounted for 61 per cent of total exports <strong>in</strong> 2008).• Economies with constantly ris<strong>in</strong>g rates ofimported content dur<strong>in</strong>g the period 1985-2008were Ch<strong>in</strong>ese Taipei (from 32 to 47 per cent)<strong>and</strong> the United States (from 7 to 15 per cent).• The estimates of Ch<strong>in</strong>a’s import content of exports(19.7 per cent <strong>in</strong> 2008) appear to be excessivelylow. This is because st<strong>and</strong>ard II-Os, used forVS calculation, do not give specific treatment toprocess<strong>in</strong>g zones’ trade. For Ch<strong>in</strong>a, the share ofexports from process<strong>in</strong>g zones <strong>in</strong> total exportswas more than 47 per cent <strong>in</strong> 2008. The importcontent of exports is obviously underestimated asCh<strong>in</strong>a’s export process<strong>in</strong>g zones employ far moreimported <strong>in</strong>puts than exports stemm<strong>in</strong>g from nonprocess<strong>in</strong>gtrade. In 2008, the import content ofexports from Ch<strong>in</strong>ese process<strong>in</strong>g zones has beenestimated at 56 per cent. The revised estimate ofCh<strong>in</strong>a’s vertical specialization, comb<strong>in</strong><strong>in</strong>g the twotypes of trade (process<strong>in</strong>g <strong>and</strong> non-process<strong>in</strong>g),amounts to 37 per cent <strong>in</strong>stead of 19.7 per centwith st<strong>and</strong>ard AIO tables. 5In the <strong>Asia</strong>n region, vertical specialization – similar to whatis observed for trade <strong>in</strong> <strong>in</strong>termediate goods - is closelyrelated to manufactur<strong>in</strong>g activity (see Figures 4 <strong>and</strong> 5).I. From massdem<strong>and</strong> to <strong>global</strong>supply <strong>cha<strong>in</strong>s</strong>II. Organizationof the <strong>global</strong>production processIII. Infrastructureservices <strong>in</strong> <strong>global</strong><strong>value</strong> <strong>cha<strong>in</strong>s</strong>Figure 4Historical share of vertical specialization of n<strong>in</strong>e <strong>Asia</strong>n ma<strong>in</strong> traders, by sector 6 , 1985-2008 (percentage)IV. The evolutionof tariff policies353025201510AgricultureManufactur<strong>in</strong>g<strong>Trade</strong> <strong>and</strong> transportOther servicesV. Foreign direct<strong>in</strong>vestmentVI. Integrateddiversity501985Source: The <strong>Asia</strong>n <strong>in</strong>ternational <strong>in</strong>put-output table, <strong>IDE</strong>-<strong>JETRO</strong>.The high vertical specialization of “petroleum <strong>and</strong> petroproducts” (see Figure 5) shows that several major <strong>Asia</strong>neconomies, among which Japan (VS of 91 per cent <strong>in</strong>that sector <strong>in</strong> 2008) <strong>and</strong> the Republic of Korea (VS of 82per cent <strong>in</strong> 2008), are net importers of oil-based primary<strong>and</strong> semi-f<strong>in</strong>ished products.As shown with<strong>in</strong> the presentation of trade <strong>in</strong> <strong>in</strong>termediategoods <strong>in</strong> <strong>Asia</strong> (see Chapter VIII), electronic parts <strong>and</strong>components are the most traded types of <strong>in</strong>puts with<strong>in</strong><strong>Asia</strong>n supply <strong>cha<strong>in</strong>s</strong>. They are also amongst the mostcomplex products. This is echoed here through theconstantly high VS shares observed for “computers<strong>and</strong> electronic equipments” <strong>and</strong> “other electricalequipment”. Logically, “transport equipment” <strong>and</strong> other19901995200020052008manufactur<strong>in</strong>g-related sectors present relatively highVS shares reflect<strong>in</strong>g the high fragmentation of themanufactur<strong>in</strong>g sector with<strong>in</strong> <strong>East</strong> <strong>Asia</strong>; VS is above all amatter of the manufactur<strong>in</strong>g <strong>in</strong>dustry.The VS share of the “other services” sector for the n<strong>in</strong>e<strong>East</strong> <strong>Asia</strong>n economies, which <strong>in</strong>cludes a wide range ofbus<strong>in</strong>ess services, more than doubled between 2000<strong>and</strong> 2008, reach<strong>in</strong>g 22.3 per cent <strong>in</strong> 2008. Such asharp evolution denotes the <strong>in</strong>creas<strong>in</strong>g role of services<strong>in</strong> supply <strong>cha<strong>in</strong>s</strong>, notably <strong>in</strong> the areas of transport,communication <strong>and</strong> logistics (see Chapter II, on theparticular roles of Hong Kong (Ch<strong>in</strong>a) <strong>and</strong> S<strong>in</strong>gapore),<strong>and</strong> the l<strong>in</strong>k they establish between successivemanufactur<strong>in</strong>g operations.VII. An evolutionaryperspective onproduction networks<strong>in</strong> the <strong>Asia</strong>-US regionVIII. <strong>Trade</strong> <strong>in</strong><strong>in</strong>termediate goodsIX. Vertical trade<strong>and</strong> trade <strong>in</strong><strong>value</strong> addedX. Cross-regionalspillover ofeconomic growth99
<strong>Trade</strong> Patterns <strong>and</strong> Global Value Cha<strong>in</strong>s <strong>in</strong> <strong>East</strong> <strong>Asia</strong>Figure 5N<strong>in</strong>e <strong>Asia</strong>n traders’ average share of vertical specialization, by sector*, 2000-2008 (percentage)0 10 20 30 40 50 60 70 80Petroleum <strong>and</strong> petro products636670Computers <strong>and</strong> electronic equipment464746Other electrical equipmentChemical products283336373934Metals <strong>and</strong> metal products263132Industrial mach<strong>in</strong>ery192328Forestry111227Transport equipment152227Other manufactur<strong>in</strong>g products272724Non-metallic m<strong>in</strong>eral products171924Other services111322Rubber products222226Food, beverage <strong>and</strong> tobacco182021Pulp, paper <strong>and</strong> pr<strong>in</strong>t<strong>in</strong>g182725Wooden furniture <strong>and</strong>other wooden products221918Electricity, gas <strong>and</strong> water supply141728Textiles, leather <strong>and</strong> the products thereof152226Livestock <strong>and</strong> poultryCrude petroleum <strong>and</strong> natural gas776121312Fisheries111317Other m<strong>in</strong><strong>in</strong>g<strong>Trade</strong> <strong>and</strong> transportOther agricultural products111110131089616Rice (paddy)Public adm<strong>in</strong>istration78661114200020052008*The construction sector is not shown as data were not available for several countries.Note: The n<strong>in</strong>e <strong>Asia</strong>n traders are Ch<strong>in</strong>a, Indonesia, Japan, the Republic of Korea, Malaysia, the Philipp<strong>in</strong>es, S<strong>in</strong>gapore, Ch<strong>in</strong>ese Taipei <strong>and</strong> Thail<strong>and</strong>.Source: The <strong>Asia</strong>n <strong>in</strong>ternational <strong>in</strong>put-output table, <strong>IDE</strong>-<strong>JETRO</strong>.100
Figure 6Computers <strong>and</strong> electronic equipment: 7 Exports <strong>and</strong> their domestic <strong>and</strong> imported contents, 2000 <strong>and</strong>2008 (<strong>in</strong> billions of US$ <strong>and</strong> percentage)Shares1009080706050403020100 0MalaysiaPhilipp<strong>in</strong>esS<strong>in</strong>gaporeThail<strong>and</strong>Ch<strong>in</strong>eseTaipei2000Republicof KoreaCh<strong>in</strong>aIndonesiaUnitedStatesJapan12010080604020ValueShare of import contentShare of domestic contentExport <strong>value</strong>I. From massdem<strong>and</strong> to <strong>global</strong>supply <strong>cha<strong>in</strong>s</strong>II. Organizationof the <strong>global</strong>production processIII. Infrastructureservices <strong>in</strong> <strong>global</strong><strong>value</strong> <strong>cha<strong>in</strong>s</strong>IV. The evolutionof tariff policies1002008300V. Foreign direct<strong>in</strong>vestment90Shares80706050403020100Philipp<strong>in</strong>esMalaysiaS<strong>in</strong>gaporeThail<strong>and</strong>Ch<strong>in</strong>eseTaipeiCh<strong>in</strong>aRepublicof KoreaIndonesiaJapanUnitedStates250200150100500ValueShare of import contentShare of domestic contentExport <strong>value</strong>VI. IntegrateddiversityVII. An evolutionaryperspective onproduction networks<strong>in</strong> the <strong>Asia</strong>-US regionSource: The <strong>Asia</strong>n <strong>in</strong>ternational <strong>in</strong>put-output table, <strong>IDE</strong>-<strong>JETRO</strong>, <strong>and</strong> WTO estimates.As can be seen <strong>in</strong> Figure 6, the share of the domesticcontent of exports from Malaysia <strong>and</strong> Thail<strong>and</strong> grewsignificantly between 2000 <strong>and</strong> 2008, from 26 to 41per cent <strong>in</strong> the case of Malaysia <strong>and</strong> from 35 to 42per cent <strong>in</strong> the case of Thail<strong>and</strong>. This can, <strong>in</strong>ter alia, bedue to the <strong>in</strong>crease of FDI towards these countries (seeChapter V) to produce locally parts <strong>and</strong> componentsused <strong>in</strong> regional production <strong>cha<strong>in</strong>s</strong> <strong>and</strong> technologytransfers occurr<strong>in</strong>g with<strong>in</strong> the outsourc<strong>in</strong>g <strong>and</strong>offshor<strong>in</strong>g strategies of MNEs. Ch<strong>in</strong>a’s contribution toworld exports of “computers <strong>and</strong> electronic equipment”<strong>in</strong>creased considerably between 2000 <strong>and</strong> 2008. Thecomposition of its exports, by domestic <strong>and</strong> foreign<strong>value</strong>, rema<strong>in</strong>ed quite stable, with a slight <strong>in</strong>crease ofthe import content <strong>in</strong> exported goods <strong>and</strong> services,from 38 to 44 per cent.VIII. <strong>Trade</strong> <strong>in</strong><strong>in</strong>termediate goodsIX. Vertical trade<strong>and</strong> trade <strong>in</strong><strong>value</strong> addedX. Cross-regionalspillover ofeconomic growth101
<strong>Trade</strong> Patterns <strong>and</strong> Global Value Cha<strong>in</strong>s <strong>in</strong> <strong>East</strong> <strong>Asia</strong>Figure 7Industrial Mach<strong>in</strong>ery: 8 Exports <strong>and</strong> their domestic <strong>and</strong> imported contents, 2000 <strong>and</strong> 2008 (<strong>in</strong> billions ofUS$ <strong>and</strong> percentage)200010090803530Shares70605040252015Value3020100IndonesiaS<strong>in</strong>gaporeThail<strong>and</strong>Philipp<strong>in</strong>esMalaysiaCh<strong>in</strong>eseTaipeiRepublicof KoreaCh<strong>in</strong>aUnitedStatesJapan1050Share of import contentShare of domestic contentExport <strong>value</strong>2008100908014012070100Shares6050408060Value3020100S<strong>in</strong>gaporeThail<strong>and</strong>MalaysiaIndonesiaRepublicof KoreaCh<strong>in</strong>eseTaipeiPhilipp<strong>in</strong>esCh<strong>in</strong>aJapanUnitedStates40200Share of import contentShare of domestic contentExport <strong>value</strong>Source: The <strong>Asia</strong>n <strong>in</strong>ternational <strong>in</strong>put-output table, <strong>IDE</strong>-<strong>JETRO</strong>, <strong>and</strong> WTO estimates.Figure 7 outl<strong>in</strong>es that the highest <strong>in</strong>crease <strong>in</strong> the share ofimport content of exports between 2000 <strong>and</strong> 2008 wasestimated for Japan (from 9 to 17 per cent, an <strong>in</strong>creaseof 90 per cent) – though from a low base <strong>in</strong> comparisonto other economies shown. The domestic content shares<strong>in</strong>creased for Indonesia <strong>and</strong> the Philipp<strong>in</strong>es, while thesituation stayed quite stable for Ch<strong>in</strong>a. In 2008, thehighest shares of import content were observed forS<strong>in</strong>gapore, Thail<strong>and</strong> <strong>and</strong> Malaysia.102
Figure 8<strong>Trade</strong> <strong>and</strong> transport services: Exports <strong>and</strong> their domestic <strong>and</strong> imported contents, 2000 <strong>and</strong> 2008 (<strong>in</strong>billions of US$ <strong>and</strong> percentage)Shares1009080706050403020100S<strong>in</strong>gaporeMalaysiaRepublicof KoreaPhilipp<strong>in</strong>esIndonesia2000Thail<strong>and</strong>Ch<strong>in</strong>eseTaipeiCh<strong>in</strong>aUnitedStatesJapan180160140120100806040200ValueShare of import contentShare of domestic contentExport <strong>value</strong>I. From massdem<strong>and</strong> to <strong>global</strong>supply <strong>cha<strong>in</strong>s</strong>II. Organizationof the <strong>global</strong>production processIII. Infrastructureservices <strong>in</strong> <strong>global</strong><strong>value</strong> <strong>cha<strong>in</strong>s</strong>IV. The evolutionof tariff policies1002008180V. Foreign direct<strong>in</strong>vestment90160Shares80706050403020100S<strong>in</strong>gaporePhilipp<strong>in</strong>esMalaysiaRepublicof KoreaCh<strong>in</strong>eseTaipeiIndonesiaCh<strong>in</strong>aThail<strong>and</strong>UnitedStatesJapan140120100806040200ValueShare of import contentShare of domestic contentExport <strong>value</strong>VI. IntegrateddiversityVII. An evolutionaryperspective onproduction networks<strong>in</strong> the <strong>Asia</strong>-US regionSource: The <strong>Asia</strong>n <strong>in</strong>ternational <strong>in</strong>put-output table, <strong>IDE</strong>-<strong>JETRO</strong>, <strong>and</strong> WTO estimates.As shown <strong>in</strong> Figure 8, a particularity of the “trade<strong>and</strong> transport services” sector, noticeable for all theeconomies displayed, is the high fraction of domesticcontent <strong>in</strong> exports, which even <strong>in</strong>creased significantlybetween 2000 <strong>and</strong> 2008. <strong>Trade</strong> (retail <strong>and</strong> wholesale)<strong>and</strong> transport-related services rema<strong>in</strong> largely at nationallevel. The production of services is much less organizedwith<strong>in</strong> <strong>in</strong>ternational supply <strong>cha<strong>in</strong>s</strong> than is the case formanufactured goods. S<strong>in</strong>gapore’s exports of “trade <strong>and</strong>transport services” showed the highest share of importcontent. Ch<strong>in</strong>a’s exports <strong>in</strong> this sector more than tripleddur<strong>in</strong>g the same period to accompany the growth ofits output of manufactured goods with complementaryservices. For Ch<strong>in</strong>a, the share of imported content ofexports was only 9 per cent <strong>in</strong> 2008 (down from 11 percent <strong>in</strong> 2000), whereas the respective ratio rema<strong>in</strong>edquite stable for the United States at around 5 per cent<strong>in</strong> both years.VIII. <strong>Trade</strong> <strong>in</strong><strong>in</strong>termediate goodsIX. Vertical trade<strong>and</strong> trade <strong>in</strong><strong>value</strong> addedX. Cross-regionalspillover ofeconomic growth103
<strong>Trade</strong> Patterns <strong>and</strong> Global Value Cha<strong>in</strong>s <strong>in</strong> <strong>East</strong> <strong>Asia</strong>D. Us<strong>in</strong>g the <strong>value</strong> added approach to evaluate bilateral trade balancesIn addition to provid<strong>in</strong>g another angle for trade analysis,the <strong>value</strong> added approach raises questions about therelevancy of bilateral trade balances evaluated throughtraditional statistics.Bilateral trade balances, <strong>and</strong> more especially bilateraldeficits, are given a prom<strong>in</strong>ent role <strong>in</strong> trade policy. Thebilateral trade balance is expressed as the differencebetween an economy’s exports <strong>and</strong> its imports with anothereconomy. However, the goods exchanged between thetwo parties, particularly the manufactured ones, may resultfrom <strong>in</strong>ternational production <strong>cha<strong>in</strong>s</strong> <strong>and</strong> may have multiplegeographical orig<strong>in</strong>s. Thus attribut<strong>in</strong>g the entire export orimport <strong>value</strong> to the referred partner country is <strong>in</strong>adequate<strong>and</strong> affects the analytical relevance of the trade surplus ordeficit observed between the two countries.This can be illustrated with the common example ofthe US trade deficit vis-à-vis Ch<strong>in</strong>a. The deficit, ascurrently measured between the two countries, isclearly overstated, as it does not orig<strong>in</strong>ate only <strong>in</strong> Ch<strong>in</strong>a,but also <strong>in</strong> economic partners belong<strong>in</strong>g to the sameproduction <strong>cha<strong>in</strong>s</strong>. By subtract<strong>in</strong>g the estimated importcontent from conventional trade <strong>value</strong>s, the <strong>value</strong>added approach enables bilateral transactions to beadjusted <strong>in</strong> l<strong>in</strong>e with the actual <strong>value</strong>s created <strong>in</strong> thetwo countries.The 2005 US-Ch<strong>in</strong>a trade shortfall would have even beencut by more than half, from US$ 218 to US$ 101 billion,if it had been estimated <strong>in</strong> <strong>value</strong> added <strong>and</strong> adjustedfor process<strong>in</strong>g trade (see Figure 9). Similarly, <strong>in</strong> 2008,the US$ 285 billion bilateral deficit would have beenreduced by more than 40 per cent. The difference mustbe attributed to the <strong>value</strong> added from other economies,such as Japan, the Republic of Korea, Malaysia, etc.,embedded <strong>in</strong> Ch<strong>in</strong>ese exports to the United States, asillustrated with the iPhone example below.Figure 9United States-Ch<strong>in</strong>a trade balance: Traditional statistics versus <strong>value</strong> added (VA) terms (<strong>in</strong> billions ofUS$)-42%-21%2008-53%-27%2005-20%2000VA estimates (<strong>in</strong>cl. Ch<strong>in</strong>a process<strong>in</strong>g trade)VA estimates-300-200-1000Traditional measureNote: Ch<strong>in</strong>a’s process<strong>in</strong>g trade data not available for 2000.Sources: UN Comtrade Database <strong>and</strong> WTO estimates.104
Figure 10 presents a decomposition of the US tradedeficit <strong>in</strong> iPhones with Ch<strong>in</strong>a by the different countriesthat contributed to its production. 9 The derived shareof Ch<strong>in</strong>a to the US deficit reflects its role as the f<strong>in</strong>alassembler <strong>in</strong> the iPhone production cha<strong>in</strong> <strong>and</strong> variestremendously accord<strong>in</strong>g to the statistical measurereta<strong>in</strong>ed. Based on the <strong>value</strong> added estimation, Ch<strong>in</strong>aFigure 102009 US trade balance <strong>in</strong> iPhones (<strong>in</strong> millions of US$)Traditional measureaccounts for less than 4 per cent of the US deficit <strong>in</strong>iPhones, while Japan, which is not <strong>in</strong>cluded <strong>in</strong> thetraditional evaluation, accounts for more than 35 percent of the same deficit. This example also demonstratesthat, whatever the statistical method applied, the <strong>global</strong>trade balance of an economy rema<strong>in</strong>s unchanged.Value added measure-2,000 -800 -700 -600 -500 -400 -300 -200 -100 0 0 -100 -200 -300 -400 -500 -600 -700 -800-2,000-1,901 World-1,901of which:I. From massdem<strong>and</strong> to <strong>global</strong>supply <strong>cha<strong>in</strong>s</strong>II. Organizationof the <strong>global</strong>production processIII. Infrastructureservices <strong>in</strong> <strong>global</strong><strong>value</strong> <strong>cha<strong>in</strong>s</strong>IV. The evolutionof tariff policies-1,901Ch<strong>in</strong>aJapanKorea, Rep. ofGermany-73-259-341-685V. Foreign direct<strong>in</strong>vestmentRest of World-543VI. IntegrateddiversitySource: Meng <strong>and</strong> Miroudot (2011).EndnotesVII. An evolutionaryperspective onproduction networks<strong>in</strong> the <strong>Asia</strong>-US region1See United Nations (2010).2See Isakson (2007).3See Leontief (1951).4For example, the World Input-Output Database (WIOD)project: see http://www.wiod.org/.5See Maurer <strong>and</strong> Dega<strong>in</strong> (2010).6The “trade <strong>and</strong> transport” sector <strong>in</strong> the AIO table comprises:wholesale <strong>and</strong> retail trade <strong>and</strong> transportation. The “otherservices” sector comprises: telecommunications, f<strong>in</strong>ance,<strong>in</strong>surance, real estate, education <strong>and</strong> research, medical <strong>and</strong>health service, restaurants, hotel <strong>and</strong> other services.7The “computers <strong>and</strong> electronic equipment” sector <strong>in</strong> theAIO table comprises: electronic comput<strong>in</strong>g equipment,semiconductors <strong>and</strong> <strong>in</strong>tegrated circuits, <strong>and</strong> other electronics<strong>and</strong> electronic products.8The “Industrial Mach<strong>in</strong>ery” sector <strong>in</strong> the AIO table comprises:boilers, eng<strong>in</strong>es <strong>and</strong> turb<strong>in</strong>es, general mach<strong>in</strong>ery, metalwork<strong>in</strong>g mach<strong>in</strong>ery, specialized mach<strong>in</strong>ery.9See X<strong>in</strong>g <strong>and</strong> Detert (2010).VIII. <strong>Trade</strong> <strong>in</strong><strong>in</strong>termediate goodsIX. Vertical trade<strong>and</strong> trade <strong>in</strong><strong>value</strong> addedX. Cross-regionalspillover ofeconomic growth105
<strong>Trade</strong> Patterns <strong>and</strong> Global Value Cha<strong>in</strong>s <strong>in</strong> <strong>East</strong> <strong>Asia</strong>X. Cross-regional spilloverof economic growth:The territorial impact of <strong>global</strong>manufactur<strong>in</strong>g <strong>in</strong> Ch<strong>in</strong>a• The coastal regions of Ch<strong>in</strong>a, <strong>in</strong> particular the <strong>East</strong> Coast <strong>and</strong> the SouthCoast, have demonstrated outst<strong>and</strong><strong>in</strong>g growth as a result of preferentialdevelopment policies strongly orientated towards exports.• These two coastal regions have made a significant contribution toregional development elsewhere, although other regions also playeddifferent <strong>and</strong> specific parts <strong>in</strong> transferr<strong>in</strong>g growth momentum from one tothe other.• The “unbalanced growth” strategy has fostered regional disparities,which have gradually pushed the government to look for more stable <strong>and</strong>susta<strong>in</strong>able development models.106
I. From massdem<strong>and</strong> to <strong>global</strong>supply <strong>cha<strong>in</strong>s</strong>II. Organizationof the <strong>global</strong>production processIII. Infrastructureservices <strong>in</strong> <strong>global</strong><strong>value</strong> <strong>cha<strong>in</strong>s</strong>ContentsIV. The evolutionof tariff policiesA. Unbalanced economic growth: 1978-1998B. Rebalanc<strong>in</strong>g the regional disparities: 1999 to the present108111V. Foreign direct<strong>in</strong>vestmentVI. IntegrateddiversityVII. An evolutionaryperspective onproduction networks<strong>in</strong> the <strong>Asia</strong>-US regionVIII. <strong>Trade</strong> <strong>in</strong><strong>in</strong>termediate goodsIX. Vertical trade<strong>and</strong> trade <strong>in</strong><strong>value</strong> addedX. Cross-regionalspillover ofeconomic growth107
<strong>Trade</strong> Patterns <strong>and</strong> Global Value Cha<strong>in</strong>s <strong>in</strong> <strong>East</strong> <strong>Asia</strong>A. Unbalanced economic growth: 1978-1998 1In 2010, Ch<strong>in</strong>a became the second-largest economy <strong>in</strong>the world, surpass<strong>in</strong>g Japan <strong>in</strong> terms of nom<strong>in</strong>al grossdomestic product (GDP). Despite occasional slowdowns,the country has registered a high level of economic growth<strong>in</strong> the last 30 years or so, s<strong>in</strong>ce the launch of the Reform<strong>and</strong> Open-Door Policy <strong>in</strong> 1978. Its development strategyis based on the “unbalanced” growth model of economistAlbert Hirschman, which asserts that “an economy, to liftitself to higher <strong>in</strong>come levels, must <strong>and</strong> will first developwith<strong>in</strong> itself one or several regional centres of economicstrength” (Hirschman, 1958).Table 1 <strong>and</strong> Figure 1 present output growth rates <strong>in</strong> realterms, by region <strong>and</strong> by <strong>in</strong>dustry, over the f<strong>in</strong>al 10 yearsof the “unbalanced growth” period. 2 The output of thewhole country rose by 203 per cent dur<strong>in</strong>g that period,but the speed of growth was quite uneven at the regionallevel. Two coastal regions, the <strong>East</strong> Coast <strong>and</strong> the SouthCoast, recorded higher average growth (242 per cent<strong>and</strong> 368 per cent) than other regions, the contrastbe<strong>in</strong>g especially sharp with regional neighbours, suchas the North <strong>East</strong> (119 per cent) <strong>and</strong> Central (142 percent). Compar<strong>in</strong>g by <strong>in</strong>dustry, heavy <strong>in</strong>dustry <strong>and</strong> otherservices registered relatively high average growth (258per cent <strong>and</strong> 351 per cent), whereas m<strong>in</strong><strong>in</strong>g experiencedthe lowest average growth (58 per cent).In order to elucidate the “unbalanced” structure ofdevelopment dur<strong>in</strong>g the period, Tables 2 <strong>and</strong> 3 extractfrom Table 1 the cells with figures exceed<strong>in</strong>g referentialrates of growth, which are the “whole country” rates forregional estimates <strong>and</strong> “all <strong>in</strong>dustries” rates for sectoralestimates. Look<strong>in</strong>g at Table 2, two coastal regions,the <strong>East</strong> Coast <strong>and</strong> the South Coast, play the lead<strong>in</strong>groles <strong>in</strong> the growth of almost all <strong>in</strong>dustries. The NorthWest also shows strong growth, but this growth largelydepends on <strong>in</strong>dustries tied to primary products. Table3 shows that growth <strong>in</strong> every region is overwhelm<strong>in</strong>gly<strong>in</strong>fluenced by heavy <strong>in</strong>dustry <strong>and</strong> other services. Light<strong>in</strong>dustry is also important <strong>in</strong> most regions, although itsperformance appears to be poor <strong>in</strong> the North <strong>East</strong> <strong>and</strong>North West.As shown below, the “unbalanced” development strategywas implemented <strong>in</strong> a way that gave highly preferentialtreatment to the coastal regions of Ch<strong>in</strong>a. In 1980, thegovernment established special economic zones atShenzhen, Zhuhai, Shantou <strong>and</strong> Xiamen, on the SouthCoast, with <strong>in</strong>vestment <strong>in</strong>centives for foreign-affiliatedfirms to set up factories there. In 1984, 14 other cities<strong>in</strong> coastal districts were opened to foreign companies.Ha<strong>in</strong>an, on the South Coast, also became a specialeconomic zone <strong>in</strong> 1988.Table 1Output growth rates by region <strong>and</strong> by <strong>in</strong>dustry, 1987-1997 (percentage)Agriculture M<strong>in</strong><strong>in</strong>g Light<strong>in</strong>dustryEnergyHeavy<strong>in</strong>dustryConstruction Transport <strong>Trade</strong> OtherservicesAll<strong>in</strong>dustriesNorth <strong>East</strong> 131.1 11.3 114.2 53.2 151.5 106.6 79.1 168.8 230.6 119.3North Coast 107.2 56.3 202.0 62.2 261.8 192.8 136.8 136.3 398.0 193.0<strong>East</strong> Coast 96.3 82.2 259.4 122.9 266.8 258.3 119.4 186.5 525.7 242.0South Coast 126.2 112.8 477.8 287.0 569.3 323.8 368.6 165.9 603.1 368.1Central 79.1 73.3 209.2 82.8 200.4 120.5 121.1 82.5 199.9 141.7North West 181.5 141.9 184.8 144.9 228.2 252.6 251.6 178.2 298.9 208.7South West 118.2 49.5 194.9 81.0 246.4 212.6 129.9 113.7 279.9 175.9Whole country 108.4 58.2 234.2 100.4 258.1 197.0 152.5 141.4 351.3 203.2Note: See Annex 2 for the geographical coverage of each region.Sources: The Interregional Input-Output Tables of Ch<strong>in</strong>a, IRIO87 (Ichimura <strong>and</strong> Wang, 2003) <strong>and</strong> MRIO97 (<strong>IDE</strong>-<strong>JETRO</strong> 2003).108
Figure 1Output growth rates, 1987-1997 (percentage)I. From massdem<strong>and</strong> to <strong>global</strong>supply <strong>cha<strong>in</strong>s</strong>Note: See Annex 2 for the geographical coverage of each region.312629North West(Xibei)2328South West(X<strong>in</strong>an)25302224272054123North Coast(Huabei)151712Central(Huazhong)211816191410131169South Coast(Huanan)8North <strong>East</strong>(Dongbei)7<strong>East</strong> Coast(Huadong)Output growth rateLess than 150%150% - 200%200% - 250%250% - 300%300% <strong>and</strong> aboveII. Organizationof the <strong>global</strong>production processIII. Infrastructureservices <strong>in</strong> <strong>global</strong><strong>value</strong> <strong>cha<strong>in</strong>s</strong>IV. The evolutionof tariff policiesV. Foreign direct<strong>in</strong>vestmentVI. IntegrateddiversitySources: The Interregional Input-Output Tables of Ch<strong>in</strong>a, IRIO87 (Ichimura <strong>and</strong> Wang, 2003) <strong>and</strong> MRIO97 (<strong>IDE</strong>-<strong>JETRO</strong>, 2003). 3Table 2Regions with growth higher than “whole country” growth rates, by <strong>in</strong>dustry, 1987-1997Agriculture M<strong>in</strong><strong>in</strong>g Light<strong>in</strong>dustryEnergyHeavy<strong>in</strong>dustryConstruction Transport <strong>Trade</strong> OtherservicesNorth <strong>East</strong> + +North Coast + +<strong>East</strong> Coast + + + + + + + +South Coast + + + + + + + + + +Central +North West + + + + + + +South West + +All <strong>in</strong>dustriesWhole country /// /// /// /// /// /// /// /// /// ///VII. An evolutionaryperspective onproduction networks<strong>in</strong> the <strong>Asia</strong>-US regionVIII. <strong>Trade</strong> <strong>in</strong><strong>in</strong>termediate goodsIX. Vertical trade<strong>and</strong> trade <strong>in</strong><strong>value</strong> addedNote: The “whole country” growth rates <strong>and</strong> “all <strong>in</strong>dustries” growth rates are calculated from official Ch<strong>in</strong>ese statistics, from which each of the regional/sectoral breakdownshas been estimated.Sources: The Interregional Input-Output Tables of Ch<strong>in</strong>a, IRIO87 (Ichimura <strong>and</strong> Wang, 2003) <strong>and</strong> MRIO97 (<strong>IDE</strong>-<strong>JETRO</strong> 2003) (based on Table 1).X. Cross-regionalspillover ofeconomic growth109
<strong>Trade</strong> Patterns <strong>and</strong> Global Value Cha<strong>in</strong>s <strong>in</strong> <strong>East</strong> <strong>Asia</strong>Table 3Industries with growth higher than “all <strong>in</strong>dustries” growth rates, by region, 1987-1997Agriculture M<strong>in</strong><strong>in</strong>g Light<strong>in</strong>dustryEnergyHeavy<strong>in</strong>dustryConstruction Transport <strong>Trade</strong> OtherservicesAll <strong>in</strong>dustriesNorth <strong>East</strong> + + + + ///North Coast + + + ///<strong>East</strong> Coast + + + + ///South Coast + + + + ///Central + + + ///North West + + + + ///South West + + + + ///Whole country + + + ///Note: The “whole country” growth rates <strong>and</strong> “all <strong>in</strong>dustries” growth rates are calculated from official Ch<strong>in</strong>ese statistics, from which each of the regional/sectoral breakdownshas been estimated.Sources: The Interregional Input-Output Tables of Ch<strong>in</strong>a, IRIO87 (Ichimura <strong>and</strong> Wang, 2003) <strong>and</strong> MRIO97 (<strong>IDE</strong>-<strong>JETRO</strong> 2003) (based on Table 1).In order to analyse the impact of this preferentialdevelopment strategy, each of the growth rates <strong>in</strong> Table 2is decomposed <strong>in</strong> terms of the follow<strong>in</strong>g factors: 41. contribution of domestic f<strong>in</strong>al dem<strong>and</strong>, i.e.consumption <strong>and</strong> <strong>in</strong>vestment,2. contribution of foreign dem<strong>and</strong>, i.e. exports,3. contribution of changes <strong>in</strong> production techniques,4. (negative) contribution of imports throughdisplacement of domestic production, <strong>and</strong>5. other unidentified factors.Figure 2 shows the results of decomposition by region(averaged over <strong>in</strong>dustries). In general, domestic f<strong>in</strong>aldem<strong>and</strong> is the most dom<strong>in</strong>ant factor, though thevariation for other factors across the regions warrantsclose attention. The contribution of foreign dem<strong>and</strong>is significantly higher for coastal regions, particularlyfor the <strong>East</strong> Coast <strong>and</strong> the South Coast, whereas the<strong>in</strong>l<strong>and</strong> regions, Central, the North West <strong>and</strong> the SouthWest, are heavily domestic-oriented. Also, the (negative)contribution of imports through the displacement ofdomestic production presents a clear correlation with thedegree of export contribution, mean<strong>in</strong>g that the growthfactors for coastal regions are highly foreign-dependentboth on the <strong>in</strong>put side (=import) <strong>and</strong> the output side(=export).Figure 2Decomposition of growth factors (percentage)1009080706050403020Domestic F<strong>in</strong>al Dem<strong>and</strong>10Export0Technological change-10-20-30North <strong>East</strong>North Coast<strong>East</strong> CoastSouth CoastCentralNorth WestSouth WestDisplacement by importOther factorsSources: The Interregional Input-Output Tables of Ch<strong>in</strong>a, IRIO87 (Ichimura <strong>and</strong> Wang, 2003) <strong>and</strong> MRIO97 (<strong>IDE</strong>-<strong>JETRO</strong> 2003).110
Particularly <strong>in</strong>terest<strong>in</strong>g is the contribution made bychanges <strong>in</strong> production techniques. Aga<strong>in</strong>, significantlyhigher contribution rates are observed among the coastalregions. This <strong>in</strong>dicates that the production techniques of<strong>in</strong>dustries <strong>in</strong> coastal regions have changed more rapidlythan <strong>in</strong> <strong>in</strong>l<strong>and</strong> regions, help<strong>in</strong>g to accelerate output growththere. This is related to the massive <strong>in</strong>flow of foreign capital<strong>in</strong>to the special economic zones. As a result of the “CoastalArea Development Strategy” implemented <strong>in</strong> 1987, morethan 90 per cent of foreign firms are concentrated alongthe coast, <strong>and</strong> this is considered to have significantlyaffected <strong>in</strong>dustrial production systems there.The question, however, is to what extent benefits ofthe outst<strong>and</strong><strong>in</strong>g growth of coastal regions have beentransferred to, <strong>and</strong> shared by, other regions, especiallythe lagg<strong>in</strong>g <strong>in</strong>l<strong>and</strong> regions, as postulated by Hirschman’s“unbalanced” development strategy. Table 4 <strong>and</strong> Figure 3illustrate the selected channels of cross-regional spilloverof regional output growth, with the above-averagecontribution rates from other regions be<strong>in</strong>g highlighted <strong>in</strong>red numbers (see the technical notes for the calculationmethod). The ma<strong>in</strong> features of the table can be summarizedas follows:1. Two coastal regions, the <strong>East</strong> Coast <strong>and</strong> the SouthCoast, make the largest growth contributions toalmost all regions. Also, their mutual <strong>in</strong>fluence isquite significant (EC→SC: 6.60 per cent, SC→EC:6.01 per cent), show<strong>in</strong>g strong economic l<strong>in</strong>kagesbetween them.Table 4Shares of growth contribution from each region, 1987-1997 (percentage)2. The <strong>East</strong> Coast is less affected by the performanceof other regions. It is a contributor, rather than abeneficiary, of cross-regional growth spillover. TheNorth Coast is the reverse; it benefits substantiallyfrom others yet contributes very little <strong>in</strong> return, exceptto the North West (NC→NW: 4.84 per cent).3. The North West receives its largest contribution fromCentral (C→NW: 5.47 per cent), as well as feel<strong>in</strong>ga substantial impact from many other regions. Thisis attributed to the fact that the region is the biggestenergy supplier to <strong>in</strong>dustries all over the country. Incontrast, Central serves as an important transit po<strong>in</strong>tfor transferr<strong>in</strong>g the growth spillover from coastalregions to the remote <strong>in</strong>ner Ch<strong>in</strong>a.4. As one of the remotest regions, the North <strong>East</strong>receives the smallest benefits from others. Endowedwith rich natural resources of l<strong>and</strong>, energy <strong>and</strong> forests,the region was called the “<strong>in</strong>dustrial cradle of Ch<strong>in</strong>a”<strong>in</strong> the 1950s <strong>and</strong> played an important role <strong>in</strong> theearly stages of the country’s economic development.It has fostered a well-developed, yet relatively<strong>in</strong>dependent, <strong>in</strong>dustrial base with a high degree ofself-sufficiency. The South West, another remoteregion, also displays a high degree of <strong>in</strong>dependence.Yet this is ma<strong>in</strong>ly due to its unfavourable geography<strong>and</strong> poor transport <strong>and</strong> communication networkswith the rest of the country. The region, however,ga<strong>in</strong>s some direct contribution from the <strong>East</strong> Coast<strong>and</strong> the South Coast. (EC→SW: 2.79 per cent,SC→SW: 4.78 per cent).North <strong>East</strong> North Coast <strong>East</strong> Coast South Coast Central North West South West TotalNorth <strong>East</strong> 95.8 -1.1 2.0 1.1 0.0 1.6 0.8 100.0North Coast 1.6 77.0 7.9 4.5 4.1 2.7 2.3 100.0<strong>East</strong> Coast 1.8 2.0 86.3 6.0 1.2 1.3 1.4 100.0South Coast 1.7 1.8 6.6 82.4 3.0 1.5 3.1 100.0Central 1.3 0.8 8.5 6.7 77.2 2.5 3.0 100.0North West 2.2 4.8 4.8 3.0 5.5 78.0 1.7 100.0South West 0.7 0.6 2.8 4.8 1.3 0.6 89.3 100.0Note: The average rate of cross-regional contribution is 2.72, <strong>and</strong> the number <strong>in</strong> a cell is highlighted if it exceeds this average, show<strong>in</strong>g important channels of cross-regionalgrowth contribution.Sources: The Interregional Input-Output Tables of Ch<strong>in</strong>a, IRIO87 (Ichimura <strong>and</strong> Wang, 2003) <strong>and</strong> MRIO97 (<strong>IDE</strong>-<strong>JETRO</strong> 2003).I. From massdem<strong>and</strong> to <strong>global</strong>supply <strong>cha<strong>in</strong>s</strong>II. Organizationof the <strong>global</strong>production processIII. Infrastructureservices <strong>in</strong> <strong>global</strong><strong>value</strong> <strong>cha<strong>in</strong>s</strong>IV. The evolutionof tariff policiesV. Foreign direct<strong>in</strong>vestmentVI. IntegrateddiversityVII. An evolutionaryperspective onproduction networks<strong>in</strong> the <strong>Asia</strong>-US regionVIII. <strong>Trade</strong> <strong>in</strong><strong>in</strong>termediate goodsB. Rebalanc<strong>in</strong>g the regional disparities: 1999 to the presentIX. Vertical trade<strong>and</strong> trade <strong>in</strong><strong>value</strong> addedThe rapid development of the coastal regions led togrow<strong>in</strong>g regional disparities, especially towards the endof the 1990s. To alleviate the problem, the “WesternRegions Development” strategy was launched <strong>in</strong> 1999,followed by the “Promotion of North-<strong>East</strong> Region” <strong>in</strong>2003. S<strong>in</strong>ce then, the development perspective of Ch<strong>in</strong>ahas gradually shifted towards one of balanced <strong>and</strong>susta<strong>in</strong>able growth.X. Cross-regionalspillover ofeconomic growth111
<strong>Trade</strong> Patterns <strong>and</strong> Global Value Cha<strong>in</strong>s <strong>in</strong> <strong>East</strong> <strong>Asia</strong>Figure 3Selected channels of cross-regional growth spillover (based on Table 4)North <strong>East</strong>(Dongbei)North West(Xibei)North Coast(Huabei)Central(Huazhong)<strong>East</strong> Coast(Huadong)South West(X<strong>in</strong>an)South Coast(Huanan)Note: Arrows <strong>in</strong>dicate the selected channels with above-average contribution rates of growth spillover. Thicker arrows are assigned to the channels with more than 5%contribution rates.The <strong>global</strong> f<strong>in</strong>ancial crisis provided a further spur tochange. In November 2008, the government announceda counter-crisis fiscal package of four trillion yuan(about US$ 520 billion). It was a fiscal commitmenton an unprecedented scale, far surpass<strong>in</strong>g the one <strong>in</strong>1998 to meet the <strong>Asia</strong>n currency crisis. It was stronglyorientated towards promot<strong>in</strong>g the development of<strong>in</strong>l<strong>and</strong> regions (see Table 5) through rural <strong>in</strong>frastructureprojects, such as the construction of roads, railroads<strong>and</strong> airports, as well as the supply of cheap houses.Also, substantial amounts (approximately 25 per centof the total) were allocated for reconstruction <strong>in</strong> theSichuan prov<strong>in</strong>ce after the devastat<strong>in</strong>g earthquake of2008.Figure 4 compares the output loss caused by the crisiswith the ga<strong>in</strong> brought by the counter-crisis measures. 5As for the magnitude of output loss (crisis impact),coastal regions, such as the <strong>East</strong> Coast <strong>and</strong> the SouthCoast, suffered most due to their structural dependenceon exports. As for the output ga<strong>in</strong> (policy impact), theimpact was felt most <strong>in</strong> the South-West region, whichis unsurpris<strong>in</strong>g given the Sichuan reconstructionprogramme. It is followed by Central, which may havebenefited from the South West’s expansion thanks to itsgeographical proximity.It is disturb<strong>in</strong>g that the net effect on South Coast isnegative. This simulation outcome is partly attributed tothe magnitude of the impact of the crisis on the coastalregions. But the weakness of the impact of the countercrisismeasures on the South Coast is equally surpris<strong>in</strong>g.The export-oriented policies of the “unbalanced growth”strategy, with their aim of promot<strong>in</strong>g the coastal regions,may have created serious structural problems for theSouth Coast. The region was strategically shaped to behighly foreign-dependent, with poor economic l<strong>in</strong>kagesto domestic markets (see Figure 2). As a result, whileit has suffered considerably from the world recession,the South Coast may not have been able to benefitsufficiently from the government’s massive f<strong>in</strong>ancialcommitment to develop<strong>in</strong>g <strong>in</strong>l<strong>and</strong> regions. 6From 2011, the 12 th Five-year Plan will be implemented.It emphasizes the importance of structural transformationfrom an export-dependent architecture to a moreharmonious, susta<strong>in</strong>able economic system geared todomestic consumer dem<strong>and</strong>. The speech of PremierWen Jiabao on the open<strong>in</strong>g day of the 2011 NationalPeople’s Congress conta<strong>in</strong>ed a strong message toreduce <strong>in</strong>come <strong>in</strong>equality <strong>and</strong> improve the quality of life.After 30 years of ceaseless growth <strong>and</strong> expansion, theCh<strong>in</strong>ese economy is at a crossroads.112
Table 5Allocation of four trillion yuan (RMB) fiscal expenditureI. From massdem<strong>and</strong> to <strong>global</strong>supply <strong>cha<strong>in</strong>s</strong>Allocation to: %Priority projects on roads, railways, airways, water supply <strong>and</strong> improvement of city electric networks 37.5Reconstruction of the Sichuan region 25.0Construction of low rent/low-priced hous<strong>in</strong>g 10.0Construction of rural <strong>in</strong>frastructure 9.3Investment <strong>in</strong> R&D to adjust the <strong>in</strong>dustrial structure 9.3Investment <strong>in</strong> energy-sav<strong>in</strong>g, environmental protection <strong>and</strong> restor<strong>in</strong>g the ecosystem 5.3Investment <strong>in</strong> health, education, culture <strong>and</strong> social work 3.8Note: Investment is to be carried out <strong>in</strong> both 2009 <strong>and</strong> 2010.Source: 21 st Century Bus<strong>in</strong>ess Herald (<strong>in</strong> Japanese, 21 Shiji J<strong>in</strong>gji Baodao), 22 May 2009.Figure 4Comparison of crisis <strong>and</strong> policy impacts (<strong>in</strong> millions of US$)400,000II. Organizationof the <strong>global</strong>production processIII. Infrastructureservices <strong>in</strong> <strong>global</strong><strong>value</strong> <strong>cha<strong>in</strong>s</strong>IV. The evolutionof tariff policies300,000200,000100,000V. Foreign direct<strong>in</strong>vestment0-100,000-200,000North <strong>East</strong>North CoastNote: Crisis impact is the total <strong>value</strong> of the simulated amount of output decl<strong>in</strong>es from the third quarter of 2008. Policy impact is the additional output result<strong>in</strong>g from twoyears’ expenditure.Source: The Transnational Interregional Input-Output Table between Ch<strong>in</strong>a <strong>and</strong> Japan, 2000, <strong>IDE</strong>-<strong>JETRO</strong>.<strong>East</strong> CoastSouth CoastCentralNorth WestSouth WestCrisis impactsPolicy impactsNet effectsVI. IntegrateddiversityVII. An evolutionaryperspective onproduction networks<strong>in</strong> the <strong>Asia</strong>-US regionEndnotes1Much of the analysis <strong>in</strong> this chapter is based on twopreviously-written papers: Meng <strong>and</strong> Qu (2008), <strong>and</strong>Okamoto <strong>and</strong> Inomata (2011). The authors are most obligedto Mr. Chao Qu <strong>and</strong> Mr. Nobuhiro Okamoto for their k<strong>in</strong>dconsent to use these works <strong>in</strong> this study.2The analytical data were converted <strong>in</strong>to real terms us<strong>in</strong>g theGrid-Search Method, which was developed by Bo Meng <strong>and</strong><strong>in</strong>troduced <strong>in</strong> Meng <strong>and</strong> Qu (2008).3The basic layout of the Interregional Input-Output Tables ofCh<strong>in</strong>a is very similar to the <strong>Asia</strong>n International Input-OutputTables constructed by <strong>IDE</strong>-<strong>JETRO</strong> (see Annex 3 for a briefdescription).4See Round (1985), Dietzenbacher <strong>and</strong> Los (1998), <strong>and</strong> deBoer (2006) for the technical details of decomposition method.5In order to calculate the effect of Ch<strong>in</strong>a’s counter-crisismeasure, some assumptions were made <strong>in</strong> the simulationexercise. The composition of fiscal <strong>in</strong>jection is <strong>in</strong>dicated <strong>in</strong> Table5. In particular, 25 per cent of the expenditure is considered togo to the South-West region for the reconstruction of Sichuanprov<strong>in</strong>ce. It is assumed that 40 per cent of the expenditure is tobe carried out <strong>in</strong> 2009 <strong>and</strong> 60 per cent <strong>in</strong> 2010.6This outcome is theoretical <strong>and</strong> limited to the hypothesis statedfor the simulation. In particular it does not factor <strong>in</strong> the rapidrecovery of world trade <strong>in</strong> 2010.VIII. <strong>Trade</strong> <strong>in</strong><strong>in</strong>termediate goodsIX. Vertical trade<strong>and</strong> trade <strong>in</strong><strong>value</strong> addedX. Cross-regionalspillover ofeconomic growth113
<strong>Trade</strong> Patterns <strong>and</strong> Global Value Cha<strong>in</strong>s <strong>in</strong> <strong>East</strong> <strong>Asia</strong>XI. GlossaryAntidump<strong>in</strong>g duty: Duties imposed on goods deemed tobe dumped <strong>and</strong> caus<strong>in</strong>g <strong>in</strong>jury to competitors <strong>in</strong> the import<strong>in</strong>gcountry. Dump<strong>in</strong>g is any good sold on an export market atbelow its home cost of production.Applied duty/Applied tariff: Duty that is actually charged onimports. This can be below the bound duty.Bilateral trade balance: The difference between aneconomy’s exports <strong>and</strong> its imports with another economy.B<strong>in</strong>d<strong>in</strong>g coverage: The percentage of products (or “tariffl<strong>in</strong>es”) <strong>in</strong> a member’s list of commitments that are legallycommitted (or “bound”) <strong>in</strong> the WTO.Bound duty/Bound tariff: The tariff a WTO memberundertakes not to exceed. Once a rate of duty is bound, it maynot be raised without compensat<strong>in</strong>g the affected parties.Capital goods: Tangible items used <strong>in</strong> the production of othergoods. Examples <strong>in</strong>clude factories, mach<strong>in</strong>ery equipment (e.g.computers) <strong>and</strong> tools.Commercial services: All services except those provided bya government (i.e. services supplied neither on a commercialbasis, nor <strong>in</strong> competition with one or more service suppliers).Consumer goods: Goods dest<strong>in</strong>ed for f<strong>in</strong>al consumption by<strong>in</strong>dividual households or communities (e.g. food <strong>and</strong> beverages,video games, recorded CDs <strong>and</strong> DVDs, sports goods, etc.).Country of orig<strong>in</strong>: Accord<strong>in</strong>g to the Kyoto Convention <strong>in</strong><strong>in</strong>ternational merch<strong>and</strong>ise trade statistics, the country oforig<strong>in</strong> of a good (for imports) is determ<strong>in</strong>ed by rules of orig<strong>in</strong>established by each country. Individual countries are free todef<strong>in</strong>e orig<strong>in</strong>, but with<strong>in</strong> boundaries set by WTO rules.Dem<strong>and</strong> cha<strong>in</strong>: The dem<strong>and</strong> cha<strong>in</strong> is seen as the counterpartto the supply cha<strong>in</strong> <strong>in</strong> the total <strong>value</strong> cha<strong>in</strong>. It usually comprisesthe ma<strong>in</strong> activities <strong>in</strong> the context of market<strong>in</strong>g, sales <strong>and</strong>customer service. In dem<strong>and</strong>-driven supply <strong>cha<strong>in</strong>s</strong>, research<strong>and</strong> development are closely l<strong>in</strong>ked to market<strong>in</strong>g.Domestic content of exports (or domestic <strong>value</strong> addedcontent of exports): The domestic content of exportsmeasures exports net of imported <strong>in</strong>puts. It corresponds to theaccumulation of the <strong>value</strong> added created by each of the variousdomestic sectors that contributed directly or <strong>in</strong>directly to thesupply cha<strong>in</strong>.Entrepôt: A port or zone where goods can be imported <strong>and</strong>exported free of duties, without any additional process<strong>in</strong>g.Export process<strong>in</strong>g zone: Industrial zone with special<strong>in</strong>centives to encourage both domestic <strong>and</strong> foreign firms <strong>in</strong>vest<strong>in</strong> export-oriented activities.F<strong>in</strong>al consumption: F<strong>in</strong>al consumption consists of goods <strong>and</strong>services used up by <strong>in</strong>dividual households or the community.F<strong>in</strong>al dem<strong>and</strong>: Personal expenditures, capital expenditures<strong>and</strong> public sector expenditures for consumption <strong>and</strong> <strong>in</strong>vestmentby resident <strong>and</strong> non-resident agents.Fixed assets: Tangible or <strong>in</strong>tangible assets that are produced<strong>and</strong> then themselves used repeatedly to produce other goods.Foreign Direct Investment: Investment <strong>in</strong> foreign assetsthrough jo<strong>in</strong>t venture, merger <strong>and</strong> acquisition, with a longtermperspective. It usually <strong>in</strong>volves an active participation <strong>in</strong>management from the foreign <strong>in</strong>vestor.Global manufactur<strong>in</strong>g: Production activities <strong>in</strong> whichdifferent steps of the manufactur<strong>in</strong>g process take place <strong>in</strong>different countries.Goods for process<strong>in</strong>g: Materials or semi-processed goodsbelong<strong>in</strong>g to country A which are shipped to country B fortransformation <strong>and</strong> then returned to country A.Information Technology Agreement: Concluded <strong>in</strong> 1996,the ITA provides for participants to completely elim<strong>in</strong>ate dutieson IT products covered by the accord, <strong>in</strong>clud<strong>in</strong>g computers<strong>and</strong> semiconductors.Input coefficient matrix: The amount of goods <strong>and</strong> servicesdirectly required to produce one unit of output. It is derivedfrom the <strong>in</strong>termediate transaction matrix of the <strong>in</strong>put-outputtable by divid<strong>in</strong>g each of the transaction <strong>value</strong>s by the totaloutput of the respective <strong>in</strong>dustry.Input-Output table: Presents all <strong>in</strong>puts <strong>and</strong> outputs of aneconomy’s <strong>in</strong>dustries, <strong>in</strong>clud<strong>in</strong>g <strong>in</strong>termediate transactions,primary <strong>in</strong>puts, <strong>and</strong> sales to f<strong>in</strong>al users. If the external sectoris also described, it is called International Input-Output (II-O)table.Intermediate goods <strong>and</strong> services: Tangible <strong>and</strong> <strong>in</strong>tangibleproducts utilized as <strong>in</strong>puts <strong>in</strong> production, exclud<strong>in</strong>g fixed assets.114
Intermediate transaction matrix: The segment of the Input-Output table that captures the progressive commitment ofvarious <strong>in</strong>dustries <strong>in</strong> which the output of an <strong>in</strong>dustry is used asan <strong>in</strong>termediate <strong>in</strong>put of others. It presents the entire nexus ofsupply-use relations between producers.Intra-<strong>in</strong>dustry trade: <strong>Trade</strong> with<strong>in</strong> the same <strong>in</strong>dustry.Most-Favoured Nation (MFN): Key WTO pr<strong>in</strong>ciple thatbars signatories from any discrim<strong>in</strong>ation <strong>in</strong> treatment of othermembers.Non-tariff measures: Measures, other than ord<strong>in</strong>ary tariffs,that can limit imports. Examples <strong>in</strong>clude health regulations orphytosanitary rules. Used <strong>in</strong>terchangeably with the term “nontariffbarrier”.Offshor<strong>in</strong>g: Describes an enterprise’s decision to contractthe supply of specific goods <strong>and</strong> services to foreign suppliers.These suppliers can be <strong>in</strong>dependent or affiliated firms.Offshore-outsourc<strong>in</strong>g is a special case of outsourc<strong>in</strong>g, whenthe contractual parties are not resident of the same economy.Outsourc<strong>in</strong>g: An enterprise’s decision to acquire specific<strong>in</strong>puts <strong>and</strong> services from an outside (unaffiliated) company,<strong>in</strong>stead of produc<strong>in</strong>g them <strong>in</strong>ternally.Production network: A group of <strong>in</strong>terconnected companies<strong>in</strong>volved <strong>in</strong> the production of goods <strong>and</strong>/or services.Re-exports: Exports of foreign goods, <strong>in</strong> the same state aspreviously imported.Re-imports: Imports of domestic goods <strong>in</strong> the same state aspreviously exported.Sanitary <strong>and</strong> phytosanitary measures: Measures to ensurefood safety <strong>and</strong> animal <strong>and</strong> plant health.Self-sufficiency ratio: Expresses the size of production <strong>in</strong>relation to domestic utilization.Tariff l<strong>in</strong>e: A product as def<strong>in</strong>ed <strong>in</strong> lists of tariff rates, based onthe most detailed level of disaggregation.Total <strong>in</strong>put / Total output: The column end of Input-Outputtables shows the <strong>value</strong> of total <strong>in</strong>put, which amounts to thesum of the <strong>value</strong> of Intermediate <strong>in</strong>put <strong>and</strong> <strong>value</strong> added of each<strong>in</strong>dustry, <strong>and</strong> at the row end lies the <strong>value</strong> of total output, whichamounts to the sum of the <strong>value</strong> of <strong>in</strong>termediate dem<strong>and</strong> <strong>and</strong> the<strong>value</strong> of f<strong>in</strong>al dem<strong>and</strong> for each product. In a static framework,it is assumed that total <strong>in</strong>put equals total output, so that thecolumn <strong>and</strong> row ends for a given <strong>in</strong>dustry should match exactly.<strong>Trade</strong> <strong>in</strong> <strong>value</strong> added: An alternative to the traditional measureof <strong>in</strong>ternational exchanges <strong>in</strong> goods <strong>and</strong> services, adapted tothe evolution of <strong>global</strong> supply <strong>cha<strong>in</strong>s</strong>. Enables the domesticcontent <strong>in</strong>cluded <strong>in</strong> gross export flows to be estimated.Twenty-foot equivalent unit (TEU): A unit of measurementequal to the volume occupied by a st<strong>and</strong>ard 20-foot conta<strong>in</strong>er.Value added: The <strong>value</strong> of output m<strong>in</strong>us the <strong>value</strong> of all<strong>in</strong>termediate <strong>in</strong>puts. It represents the contribution of, <strong>and</strong>payments to, primary factors of production (wages, profit <strong>and</strong>taxes).Value cha<strong>in</strong> (<strong>global</strong>): The sequence of activities that firmsundertake to create <strong>value</strong>, <strong>in</strong>clud<strong>in</strong>g the various productionsteps (supply cha<strong>in</strong>), but also all activities belong<strong>in</strong>g to thedem<strong>and</strong> cha<strong>in</strong>, such as market<strong>in</strong>g, sales <strong>and</strong> customer service.Vertical <strong>in</strong>tegration: Complet<strong>in</strong>g the different process stagesof a product with<strong>in</strong> the same firm, or through establishmentsrelated to the same firm.Vertical specialization: Estimated as the proportion ofimported <strong>in</strong>puts or <strong>in</strong>termediate goods <strong>and</strong> services embedded<strong>in</strong> a country’s exports.Vertical trade: International exchanges of goods <strong>and</strong> servicesassociated with the sequential operations of <strong>global</strong> supply<strong>cha<strong>in</strong>s</strong>.Supply cha<strong>in</strong>: The sequence of steps, often completed <strong>in</strong>different firms <strong>and</strong>/or locations, needed to produce a f<strong>in</strong>al good.Tariff Escalation: Rais<strong>in</strong>g tariff barriers <strong>in</strong> l<strong>in</strong>e with the degreeof process<strong>in</strong>g <strong>in</strong> any imported good.115
<strong>Trade</strong> Patterns <strong>and</strong> Global Value Cha<strong>in</strong>s <strong>in</strong> <strong>East</strong> <strong>Asia</strong>XII. BibliographyAbdon, A., Bacate, M., Felipe, J. <strong>and</strong> Kumar, U. (2010),“Product Complexity <strong>and</strong> Economic Development”, EconomicsWork<strong>in</strong>g Paper Archive No. 616, The Levy Economics Institute.Ando, M., <strong>and</strong> Obashi, A. (2010), “The pervasiveness ofnon-tariff measures <strong>in</strong> ASEAN-evidences from the <strong>in</strong>ventoryapproach”, Ris<strong>in</strong>g Non-Tariff Protectionism <strong>and</strong> CrisisRecovery, United Nations Economic <strong>and</strong> Social Commissionfor <strong>Asia</strong> <strong>and</strong> the Pacific (ESCAP): 27-55.Araujo, S. (2009), “Vertical specialization <strong>and</strong> <strong>global</strong> <strong>value</strong><strong>cha<strong>in</strong>s</strong>”, OECD, STD/SES/WPTGS (2009)16.ASEAN Secretariat, “ASEAN-6 Achieves Zero Tariffs”, pressrelease, 31/12/2009, available at http://www.aseansec.org/24146.htm.Banga, R. <strong>and</strong> Goldar, R. (2007), “Impact of <strong>Trade</strong>Liberalization on Foreign Direct Investment <strong>in</strong> IndianIndustries”, <strong>Asia</strong>-Pacific Research <strong>and</strong> Tra<strong>in</strong><strong>in</strong>g Network on<strong>Trade</strong> (ARTNeT), Work<strong>in</strong>g Paper N° 3607.Baldw<strong>in</strong>, R. (2006), “Globalisation: the great unbundl<strong>in</strong>g(s)”,Globalisation challenges for Europe, Hels<strong>in</strong>ki: Secretariat ofthe Economic Council, F<strong>in</strong>nish Prime M<strong>in</strong>ister’s Office.Barefoot, K. B. <strong>and</strong> Mataloni, R. J., Jr. (2010), “U.S.Mult<strong>in</strong>ational Companies - Operations <strong>in</strong> the United States<strong>and</strong> Abroad <strong>in</strong> 2008”, BEA Survey of Current Bus<strong>in</strong>ess,August 2010.de Boer, P. (2006), “Structural decomposition analysis<strong>and</strong> <strong>in</strong>dex number theory: An empirical application of theMontgomery decomposition”, Rotterdam: Erasmus UniversityRotterdam, Econometric Institute, Econometric InstituteReport EI 2006-39.Boyenge, J.-P. S. (2007), “ILO database on export process<strong>in</strong>gzones (Revised)”, Geneva: International Labour Office,Sectoral Activities Programme Work<strong>in</strong>g Paper N° 251.Broadman, H.G. (Ed.) (2005), From Dis<strong>in</strong>tegration toRe<strong>in</strong>tegration: <strong>East</strong>ern Europe <strong>and</strong> the Former Soviet Union<strong>in</strong> International <strong>Trade</strong>, Wash<strong>in</strong>gton DC: The World Bank.Bus<strong>in</strong>ess Process Association of the Philipp<strong>in</strong>es (2010),Breakthroughs, January-March, 4(1).Dietzenbacher, E. <strong>and</strong> Los, B. (1998), “Structuraldecomposition techniques: Sense <strong>and</strong> sensitivity”, EconomicSystems Research 10(4): 307-324.Dietzenbacher, E., Romero, L. <strong>and</strong> Bosma, N.S. (2005),“Us<strong>in</strong>g Average Propagation Lengths to Identify ProductionCha<strong>in</strong>s <strong>in</strong> the Andalusian Economy”, Estudios de EconomíaAplicada 23: 405-422.Djankov, S., Freund, C. <strong>and</strong> Pham, C.S. (2006), “Trad<strong>in</strong>gon Time”, Wash<strong>in</strong>gton, DC: World Bank, Policy ResearchWork<strong>in</strong>g Paper Series N° 3909.The Economist, “The great unbundl<strong>in</strong>g: Does economics needa new theory of offshor<strong>in</strong>g?”, 18/1/2007.The Economist, “Leav<strong>in</strong>g home: Japan’s big companies areshipp<strong>in</strong>g production abroad”, 18/11/2010.Escaith, H. (2010), “Communication to the Work<strong>in</strong>g Group onthe Impact of Globalization on National Accounts”, Geneva:WTO, unpublished paper.- (2008), “Measur<strong>in</strong>g trade <strong>in</strong> <strong>value</strong> added <strong>in</strong> the new<strong>in</strong>dustrial economy: statistical implications”, Munich: UniversityLibrary of Munich, MPRA Paper 14454.Escaith, H., L<strong>in</strong>denberg, N., <strong>and</strong> Miroudot, S. (2010),“International Supply Cha<strong>in</strong>s <strong>and</strong> <strong>Trade</strong> Elasticity <strong>in</strong> Times ofGlobal Crisis”, Geneva: WTO, Staff Work<strong>in</strong>g Paper N° ERSD-2010-08.European Union (2010), EU energy <strong>and</strong> transport <strong>in</strong> figures,Luxembourg: Publications Office of the European Union.Fishman, C. (2006), The Wal-Mart Effect, The Pengu<strong>in</strong> PressHC.Friedman, T. (2005), “The World is Flat”, New York: Farrar,Straus <strong>and</strong> Giroux.Grossman, G.M. <strong>and</strong> Rossi-Hansberg, E. (2006), “The Riseof Offshor<strong>in</strong>g: It’s Not W<strong>in</strong>e for Cloth Anymore”, Proceed<strong>in</strong>gs:59-102.Hanson, G., Mataloni, R. <strong>and</strong> Slaughter, M. (2005), “Verticalproduction networks <strong>in</strong> mult<strong>in</strong>ational firms”, The Review ofEconomics <strong>and</strong> Statistics 87(4): 664-678.Hiratsuka, D. (2010), “Characteristics <strong>and</strong> determ<strong>in</strong>ants of<strong>East</strong> <strong>Asia</strong>’s trade <strong>patterns</strong>”, <strong>in</strong> Hiratsuka, D. <strong>and</strong> Uchida, Y.(Eds) (2010), Input <strong>Trade</strong> <strong>and</strong> Production Networks <strong>in</strong> <strong>East</strong><strong>Asia</strong>, <strong>IDE</strong>-<strong>JETRO</strong> <strong>and</strong> Edward Elgar Publish<strong>in</strong>g.Hirschman, A.O. (1958), The Strategy of EconomicDevelopment, New Haven, Conn.: Yale University Press.Hummels, D., Ishii, J., <strong>and</strong> Yi, K.-M. (2001), “The nature <strong>and</strong>growth of vertical specialization <strong>in</strong> world trade”, Journal ofInternational Economics, 54(1): 75-96.Ichimura, S. <strong>and</strong> Wang, H.-J. (2003), Interregional Input-Output Analysis of the Ch<strong>in</strong>ese Economy, S<strong>in</strong>gapore: WorldScientific Publish<strong>in</strong>g Co.116
<strong>IDE</strong>-<strong>JETRO</strong> (2006), “How to make the <strong>Asia</strong>n <strong>in</strong>put-outputtables”, Institute of Develop<strong>in</strong>g Economies, March.Ikensen, D. (2009), “Made on Earth – How Global EconomicIntegration Renders <strong>Trade</strong> Policy Obsolete”, <strong>Trade</strong> PolicyAnalysis N° 42, 2/12/2009.International Merch<strong>and</strong>ise <strong>Trade</strong> Statistics: Concepts <strong>and</strong>Def<strong>in</strong>itions 2010 (2010), available at http://unstats.un.org/unsd/EconStatKB/KnowledgebaseArticle10206.aspx.International <strong>Trade</strong> Centre (ITC) (2011), Investment Map,available at www.<strong>in</strong>vestmentmap.org.Isakson, H. (2007), “Add<strong>in</strong>g <strong>value</strong> to the European economy”,Swedish National Board of <strong>Trade</strong>.Johnson, R. C., <strong>and</strong> Noguera, G. (2009), “Account<strong>in</strong>g for<strong>in</strong>termediate production shar<strong>in</strong>g <strong>and</strong> trade <strong>in</strong> <strong>value</strong> added”,Forum for Research <strong>in</strong> Empirical International <strong>Trade</strong> (F.R.E.I.T.)Work<strong>in</strong>g Paper N° 63.Kawakami, M. <strong>and</strong> Sturgeon, T. (2010), “Global Value Cha<strong>in</strong>s<strong>in</strong> the Electronics Industry” <strong>in</strong> Cattaneo, O., Gereffi, G. <strong>and</strong>Staritz, C. (eds), Global Value Cha<strong>in</strong>s <strong>in</strong> a Post-crisis World,Wash<strong>in</strong>gton, DC: World Bank.Koopman, R., Wang, Z. <strong>and</strong> Wei, S.J. (2008), “How much ofCh<strong>in</strong>ese exports is really made <strong>in</strong> Ch<strong>in</strong>a? Assess<strong>in</strong>g domestic<strong>value</strong> added when process<strong>in</strong>g trade is pervasive”, NationalBureau of Economic Research (NBER) Work<strong>in</strong>g Paper N°14109.Krugman, P., <strong>and</strong> Obstfeld, M. (2005), International Economics:Theory <strong>and</strong> Policy, 7th edition, Boston: Addison Wesley.Lamy, P. (2011), “Global Manufactur<strong>in</strong>g <strong>and</strong> Outsourc<strong>in</strong>g ofBus<strong>in</strong>ess Functions”, Open<strong>in</strong>g Remarks to the Global Forumon <strong>Trade</strong> Statistics organized by Eurostat, UNSD <strong>and</strong> WTO,Geneva, Switzerl<strong>and</strong>.− (2010a), “Globalization of the Industrial Production Cha<strong>in</strong>s<strong>and</strong> Measur<strong>in</strong>g International <strong>Trade</strong> <strong>in</strong> Value Added”, Inauguralspeech at the conference “Mondialisation des chaînesproductives <strong>in</strong>dustrielles et mesure du commerce <strong>in</strong>ternationalen valeur ajoutée”, Senate, Paris, 15/10/2010.− (2010b), “Facts <strong>and</strong> Fictions <strong>in</strong> International <strong>Trade</strong>Economics”, Speech at the Conference of <strong>Trade</strong> <strong>and</strong> InclusiveGlobalization, Paris School of Economics.Leontief, W. (1951), “Input-Output Economics”, ScientificAmerican, October: 15-21.− (1963), “The Structure of Development” <strong>in</strong> Leontief, W. (ed),Input-Output Economics, Oxford: Oxford University Press.Leontief, W. <strong>and</strong> Strout, A. (1963), “Multiregional <strong>in</strong>put-outputanalysis”, <strong>in</strong> Barna, T. (ed), Structural <strong>in</strong>terdependence <strong>and</strong>economic development, London: Macmillan.Lev<strong>in</strong>son, M. (2006), The Box: How the Shipp<strong>in</strong>g Conta<strong>in</strong>erMade the World Smaller <strong>and</strong> the World Economy Bigger,Pr<strong>in</strong>ceton, NJ: Pr<strong>in</strong>ceton University Press.L<strong>in</strong>den, G., Dedrick, J. <strong>and</strong> Kraemer, K.L. (2008), “Innovation<strong>and</strong> job creation <strong>in</strong> a <strong>global</strong> economy: the case of Apple’siPod”, Irv<strong>in</strong>e, CA: UC Irv<strong>in</strong>e Personal Comput<strong>in</strong>g IndustryCenter.Lundgren, N. G. (1996), “Bulk trade <strong>and</strong> maritime transportcosts: The evolution of <strong>global</strong> markets”, Resources Policy22(1-2): 5‐32.Ma, A.C., Van Assche, A. <strong>and</strong> Hong, C. (2008), “GlobalProduction networks <strong>and</strong> Ch<strong>in</strong>a’s Process<strong>in</strong>g <strong>Trade</strong>”, Journalof <strong>Asia</strong>n Economics 20(6): 640-654.Mart<strong>in</strong>ez, A., Mora, J. <strong>and</strong> Signoret, J. (2009), “The CoreNTMs Database: A Compilation of Reported Non-TariffMeasures”, US ITC, Office of Economics Work<strong>in</strong>g PaperN° 2009-12A.Maurer, A., <strong>and</strong> Dega<strong>in</strong>, C. (2010), “Globalization <strong>and</strong> tradeflows: what you see is not what you get!”, WTO, Staff Work<strong>in</strong>gPaper N° ERSD-2010-12.Meng, B. <strong>and</strong> Miroudot, S. (2011), “Towards measur<strong>in</strong>g trade<strong>in</strong> <strong>value</strong> added <strong>and</strong> other <strong>in</strong>dicators of <strong>global</strong> <strong>value</strong> <strong>cha<strong>in</strong>s</strong>:current OECD work us<strong>in</strong>g I/O tables”, presentation held atthe Global Forum on <strong>Trade</strong> Statistics, organized by Eurostat,UNSD <strong>and</strong> WTO, Geneva, Switzerl<strong>and</strong>.Meng, B. <strong>and</strong> Qu, C. (2008), “Application of the <strong>in</strong>put-outputdecomposition technique to Ch<strong>in</strong>a’s regional economies”,Journal of Applied Regional Science 13: 27-46.Milberg, W. (2007), “Export process<strong>in</strong>g zones, <strong>in</strong>dustrialupgrad<strong>in</strong>g <strong>and</strong> economic development”, New York: SCEPA.Miroudot, S., <strong>and</strong> Ragoussis, A. (2009), “Vertical trade, tradecosts <strong>and</strong> FDI”, OECD, <strong>Trade</strong> Policy Work<strong>in</strong>g Papers N° 89.Miroudot, S., Lanz, R., <strong>and</strong> Ragoussis, A. (2009), “<strong>Trade</strong><strong>in</strong> <strong>in</strong>termediate goods <strong>and</strong> services”, OECD, <strong>Trade</strong> PolicyWork<strong>in</strong>g Papers N° 93.OECD (2011), OECD.Stat Database, available at http://stats.oecd.org/Index.aspx.Okamoto, N. <strong>and</strong> Inomata, S. (2011), “To what extent will theshock be alleviated? The evaluation of Ch<strong>in</strong>a’s counter-crisisfiscal expansion“, <strong>in</strong> Inomata, S. (ed), <strong>Asia</strong> Beyond the GlobalEconomic Crisis, The transmission mechanism of f<strong>in</strong>ancialshocks, <strong>IDE</strong>-<strong>JETRO</strong> <strong>and</strong> Edward Elgar Publish<strong>in</strong>g.Ozaki, I. (2004), “Industrial Structure of Japan” (<strong>in</strong> Japanese,Nihon no keizai-kouzou), Tokyo: Keio University Press.Porter, M. (1985), Competitive Advantage: Creat<strong>in</strong>g <strong>and</strong>Susta<strong>in</strong><strong>in</strong>g Superior Performance, New York: Free Press.Reserve Bank of India (2008-2009), Survey on ComputerSoftware & Information Technology Services Exports.Round, J. I. (1985), “Decompos<strong>in</strong>g multipliers for economicsystems <strong>in</strong>volv<strong>in</strong>g regional <strong>and</strong> world trade”, Economic Journal95: 383-399.117
<strong>Trade</strong> Patterns <strong>and</strong> Global Value Cha<strong>in</strong>s <strong>in</strong> <strong>East</strong> <strong>Asia</strong>Sturgeon, T. (2001), “How do we def<strong>in</strong>e <strong>value</strong> <strong>cha<strong>in</strong>s</strong> <strong>and</strong>production networks?”, IDS Bullet<strong>in</strong> 32(3).Sturgeon, T. <strong>and</strong> Gereffi, G. (2009), “Measur<strong>in</strong>g Success <strong>in</strong>the Global Economy: International <strong>Trade</strong>, Industrial Upgrad<strong>in</strong>g,<strong>and</strong> Bus<strong>in</strong>ess Function Outsourc<strong>in</strong>g <strong>in</strong> Global Value Cha<strong>in</strong>s”,Transnational Corporations 18(2).UNCTAD (2011), UNCTAD Stat Database, available at http://unctadstat.unctad.org/.- (2009), Non-Tariff Measures: Evidence from SelectedDevelop<strong>in</strong>g Countries <strong>and</strong> Future Research Agenda, Geneva:UNCTAD.- (1998), World Investment Report, Geneva: UNCTAD.Washizu, A. (2008), “Structural Analysis of <strong>Asia</strong>nDevelopment (II) – An extension of Leontief-Ozaki analyses”(Ajia no hatten nokouzou-bunseki II), Waseda shakaikagakusougoukenkyuu, 9(2).UN Comtrade Database, available at http://comtrade.un.org/.Williamson, O. E. (1991) “Strategiz<strong>in</strong>g, Economiz<strong>in</strong>g, <strong>and</strong>Economic Organization”, Strategic Management Journal 23.World Bank (2011), Do<strong>in</strong>g Bus<strong>in</strong>ess Database, available atwww.do<strong>in</strong>gbus<strong>in</strong>ess.org.- (2011), World Development Indicators Database, availableat http://data.worldbank.org/data-catalog/world-development<strong>in</strong>dicators.World <strong>Trade</strong> Organization (2010a), World Tariff Profiles 2010,Geneva: WTO.- (2010b), World <strong>Trade</strong> Report 2010: <strong>Trade</strong> <strong>in</strong> naturalresources, Geneva: WTO.- (2008), World <strong>Trade</strong> Report 2008: <strong>Trade</strong> <strong>in</strong> a <strong>global</strong>iz<strong>in</strong>gworld, Geneva: WTO.- (2004), World <strong>Trade</strong> Report 2004: Coherence, Geneva:WTO.X<strong>in</strong>g, Y. (2011), “Process<strong>in</strong>g <strong>Trade</strong>, Exchange Rates <strong>and</strong>Ch<strong>in</strong>a’s bilateral <strong>Trade</strong> Balances”, National Graduate Institutefor Policy Studies (GRIPS), Discussion Paper N° 10-30.X<strong>in</strong>g, Y., Detert, N. (2010), “How the iPhone widens theUnited States trade deficit with the People’s Republic ofCh<strong>in</strong>a”, <strong>Asia</strong>n Development Bank, ADBI Work<strong>in</strong>g Paper N°257.Yosh<strong>in</strong>o, Y. (2008) Africa-<strong>Asia</strong> trade <strong>and</strong> <strong>in</strong>vestment:Opportunities <strong>and</strong> challenges, Wash<strong>in</strong>gton, DC: World Bank.118
XIII. Abbreviations <strong>and</strong> symbolsAIOAPECASEANAFTABECBOPc.i.f.CISdwtEPREPZEUEUROSTATFDIf.o.b.GDPICTIDB<strong>IDE</strong>-<strong>JETRO</strong>I-OII-OILOIMFIMTSITALDCsMarisecMFNMNENAFTANIENTMOECDR&DSAARCSEZTEUUNCTADUNSDVAVSWIODWTO<strong>Asia</strong>n <strong>in</strong>put-output<strong>Asia</strong> Pacific Economic CooperationAssociation of Southeast <strong>Asia</strong>n NationsASEAN Free <strong>Trade</strong> Areabroad economic categoriesbalance of paymentscost, <strong>in</strong>surance <strong>and</strong> freightCommunity of Independent Statesdeadweight tonneeffective protection rateexport process<strong>in</strong>g zoneEuropean UnionStatistical Office of the European Communitiesforeign direct <strong>in</strong>vestmentfree on boardgross domestic product<strong>in</strong>formation <strong>and</strong> communication technologyIntegrated Database (WTO)Institute of Develop<strong>in</strong>g Economies - Japan External <strong>Trade</strong> Organization<strong>in</strong>put-output<strong>in</strong>ternational <strong>in</strong>put-outputInternational Labour OrganizationInternational Monetary FundInternational Merch<strong>and</strong>ise <strong>Trade</strong> StatisticsInformation Technology Agreementleast-developed countriesMaritime International Secretariat Servicesmost favoured nationmult<strong>in</strong>ational enterpriseNorth American Free <strong>Trade</strong> Agreementnewly <strong>in</strong>dustrialized economiesnon-tariff measureOrganisation for Economic Co-operation <strong>and</strong> Developmentresearch <strong>and</strong> developmentSouth <strong>Asia</strong>n Association for Regional Cooperationspecial economic zonetwenty-foot equivalent unitUnited Nations Conference on <strong>Trade</strong> <strong>and</strong> DevelopmentUnited Nations Statistics Division<strong>value</strong> addedvertical specializationWorld Input-Output DatabaseWorld <strong>Trade</strong> OrganizationThe follow<strong>in</strong>g symbols are used <strong>in</strong> this publication:... Not available0 Figure is zero or became zero due to round<strong>in</strong>gUS$ United States dollarsBillion means one thous<strong>and</strong> million.119
<strong>Trade</strong> Patterns <strong>and</strong> Global Value Cha<strong>in</strong>s <strong>in</strong> <strong>East</strong> <strong>Asia</strong>Annex 1Composition of regions <strong>and</strong> other economic group<strong>in</strong>gsNorth AmericaBermuda Canada Mexico United States of AmericaOther territories <strong>in</strong> the region not elsewhere specifiedSouth <strong>and</strong> Central America <strong>and</strong> the CaribbeanAntigua <strong>and</strong> Barbuda Brazil Ecuador Jamaica Sa<strong>in</strong>t LuciaArgent<strong>in</strong>a Chile El Salvador Netherl<strong>and</strong>s Antilles Sa<strong>in</strong>t V<strong>in</strong>cent <strong>and</strong> theGrenad<strong>in</strong>esBahamas Colombia Grenada Nicaragua Sur<strong>in</strong>ameBarbados Costa Rica Guatemala Panama Tr<strong>in</strong>idad <strong>and</strong> TobagoBelize Cuba Guyana Paraguay UruguayBolivarian Rep. Dom<strong>in</strong>ica Haiti Peruof VenezuelaPlur<strong>in</strong>ational State of Dom<strong>in</strong>ican Republic Honduras Sa<strong>in</strong>t Kitts <strong>and</strong> NevisBoliviaOther territories <strong>in</strong> the region not elsewhere specifiedEuropeAndorra Denmark Icel<strong>and</strong> Montenegro Slovak RepublicAustria Estonia Irel<strong>and</strong> Netherl<strong>and</strong>s Spa<strong>in</strong>Belgium F<strong>in</strong>l<strong>and</strong> Italy Norway SwedenBosnia <strong>and</strong> Herzegov<strong>in</strong>a France Latvia Pol<strong>and</strong> Switzerl<strong>and</strong>Bulgaria FYR Macedonia Liechtenste<strong>in</strong> Portugal TurkeyCroatia Germany Lithuania Romania United K<strong>in</strong>gdomCyprus Greece Luxembourg SerbiaCzech Republic Hungary Malta SloveniaOther territories <strong>in</strong> the region not elsewhere specifiedCommonwealth of Independent States (CIS)Armenia Georgia Moldova TurkmenistanAzerbaijan Kazakhstan Russian Federation Ukra<strong>in</strong>eBelarus Kyrgyz Republic Tajikistan UzbekistanOther territories <strong>in</strong> the region not elsewhere specifiedAfricaAlgeria Congo Gu<strong>in</strong>ea Morocco South AfricaAngola Congo, Dem. Rep. of Gu<strong>in</strong>ea-Bissau Mozambique SudanBen<strong>in</strong> Côte d'Ivoire Kenya Namibia Swazil<strong>and</strong>Botswana Djibouti Lesotho Niger TanzaniaBurk<strong>in</strong>a Faso Egypt Liberia, Rep. of Nigeria TogoBurundi Equatorial Gu<strong>in</strong>ea Libya Rw<strong>and</strong>a TunisiaCameroon Eritrea Madagascar São Tomé <strong>and</strong> Pr<strong>in</strong>cipe Ug<strong>and</strong>aCape Verde Ethiopia Malawi Senegal ZambiaCentral African Republic Gabon Mali Seychelles ZimbabweChad Gambia Mauritania Sierra LeoneComoros Ghana Mauritius SomaliaOther territories <strong>in</strong> the region not elsewhere specified120
Middle <strong>East</strong>Bahra<strong>in</strong>, K<strong>in</strong>gdom of Israel Lebanese Republic Saudi Arabia, K<strong>in</strong>gdom of YemenIran, Islamic Rep. of Jordan Oman Syrian Arab RepublicIraq Kuwait Qatar United Arab EmiratesOther territories <strong>in</strong> the region not elsewhere specified<strong>Asia</strong>Afghanistan Hong Kong (Ch<strong>in</strong>a) Malaysia Papua New Gu<strong>in</strong>ea TongaAustralia India Maldives The Philipp<strong>in</strong>es TuvaluBangladesh Indonesia Mongolia Samoa VanuatuBhutan Japan Myanmar S<strong>in</strong>gapore Viet NamBrunei Darussalam Kiribati Nepal Solomon Isl<strong>and</strong>sCambodia Korea, Rep. of New Zeal<strong>and</strong> Sri LankaCh<strong>in</strong>a Lao People’s Dem. Rep. Pakistan Ch<strong>in</strong>ese TaipeiFiji Macao (Ch<strong>in</strong>a) Palau Thail<strong>and</strong>Other territories <strong>in</strong> the region not elsewhere specifiedASEAN (Association of Southeast <strong>Asia</strong>n Nations) / AFTA (ASEAN Free <strong>Trade</strong> Area)Brunei Darussalam Lao People’s Dem. Rep. The Philipp<strong>in</strong>es Viet NamCambodia Malaysia S<strong>in</strong>gaporeIndonesia Myanmar Thail<strong>and</strong>Developed economiesAndorra F<strong>in</strong>l<strong>and</strong> Lithuania Spa<strong>in</strong>Australia France Luxembourg SwedenAustria Germany Malta Switzerl<strong>and</strong>Belgium Greece Netherl<strong>and</strong>s United K<strong>in</strong>gdomBermuda Hungary New Zeal<strong>and</strong> United States of AmericaBulgaria Icel<strong>and</strong> NorwayCanada Irel<strong>and</strong> Pol<strong>and</strong>Cyprus Italy PortugalCzech Republic Japan RomaniaDenmark Latvia Slovak RepublicEstonia Liechtenste<strong>in</strong> SloveniaDevelop<strong>in</strong>g <strong>Asia</strong>Afghanistan India Mongolia Solomon Isl<strong>and</strong>sBangladesh Indonesia Myanmar Sri LankaBhutan Kiribati Nepal Ch<strong>in</strong>ese TaipeiBrunei Darussalam Korea, Rep. of Pakistan Thail<strong>and</strong>Cambodia Lao People’s Dem. Rep. Papua New Gu<strong>in</strong>ea TongaCh<strong>in</strong>a Maldives The Philipp<strong>in</strong>es TuvaluFiji Macao (Ch<strong>in</strong>a) Samoa VanuatuHong Kong (Ch<strong>in</strong>a) Malaysia S<strong>in</strong>gapore Viet NamNewly Industrialized Economies (NIEs)Hong Kong (Ch<strong>in</strong>a)Korea, Rep. ofS<strong>in</strong>gaporeCh<strong>in</strong>ese Taipei121
<strong>Trade</strong> Patterns <strong>and</strong> Global Value Cha<strong>in</strong>s <strong>in</strong> <strong>East</strong> <strong>Asia</strong>APEC MembersAustralia Indonesia Papua New Gu<strong>in</strong>ea Thail<strong>and</strong>Brunei Darussalam Japan Peru United States of AmericaCanada Korea, Rep. of The Philipp<strong>in</strong>es Viet NamChile Malaysia Russian FederationCh<strong>in</strong>a Mexico S<strong>in</strong>gaporeHong Kong (Ch<strong>in</strong>a) New Zeal<strong>and</strong> Ch<strong>in</strong>ese TaipeiDevelop<strong>in</strong>g economiesAfghanistan Cuba Lebanon Rw<strong>and</strong>aAlbania Djibouti Lesotho Sa<strong>in</strong>t Kitts <strong>and</strong> NevisAlgeria Dom<strong>in</strong>ica Liberia, Rep. of Sa<strong>in</strong>t LuciaAmerican Samoa Dom<strong>in</strong>ican Republic Libya Sa<strong>in</strong>t V<strong>in</strong>cent <strong>and</strong> the Grenad<strong>in</strong>esAngola Ecuador Macao, Ch<strong>in</strong>a SamoaAntigua <strong>and</strong> Barbuda Egypt Madagascar São Tomé <strong>and</strong> Pr<strong>in</strong>cipeArgent<strong>in</strong>a El Salvador Malawi SenegalAruba Equatorial Gu<strong>in</strong>ea Malaysia SerbiaBahamas Eritrea Maldives Serbia <strong>and</strong> MontenegroBahra<strong>in</strong>, K<strong>in</strong>gdom of Ethiopia Mali SeychellesBangladesh Falkl<strong>and</strong> Isl<strong>and</strong>s Marshall Isl<strong>and</strong>s Sierra LeoneBarbados Fiji Mauritania S<strong>in</strong>gaporeBelize French Polynesia Mauritius Solomon Isl<strong>and</strong>sBen<strong>in</strong> FYR Macedonia Mexico SomaliaBhutan Gabon Micronesia South AfricaBolivarian Rep. of Venezuela Gambia Mongolia Sri LankaBolivia, Plur<strong>in</strong>ational State of Ghana Montenegro SudanBosnia <strong>and</strong> Herzegov<strong>in</strong>a Grenada Montserrat Sur<strong>in</strong>ameBotswana Guam Morocco Swazil<strong>and</strong>Brazil Guatemala Mozambique Syrian Arab RepublicBritish Virg<strong>in</strong> Isl<strong>and</strong>s Gu<strong>in</strong>ea Myanmar Ch<strong>in</strong>ese TaipeiBrunei Darussalam Gu<strong>in</strong>ea-Bissau Namibia TanzaniaBurk<strong>in</strong>a Faso Guyana Nauru Thail<strong>and</strong>Burundi Haiti Nepal Timor-Leste, Dem. Rep. ofCambodia Honduras Netherl<strong>and</strong>s Antilles TogoCameroon Hong Kong (Ch<strong>in</strong>a) New Caledonia TongaCape Verde India Nicaragua Tr<strong>in</strong>idad <strong>and</strong> TobagoCayman Isl<strong>and</strong>s Indonesia Niger TunisiaCentral African Republic Iran, Islamic Rep. of Nigeria TurkeyChad Iraq Niue TuvaluChile Israel Northern Mariana Isl<strong>and</strong>s Ug<strong>and</strong>aCh<strong>in</strong>a Jamaica Oman United Arab EmiratesColombia Jordan Pakistan UruguayComoros Kenya Palau VanuatuCongo Saudi Arabia, K<strong>in</strong>gdom of Panama Viet NamCongo, Dem. Rep. of Kiribati Papua New Gu<strong>in</strong>ea YemenCook Isl<strong>and</strong>s Korea, Dem. People's Rep. of Paraguay ZambiaCosta Rica Korea, Rep. of Peru ZimbabweCôte d'Ivoire Kuwait The Philipp<strong>in</strong>esCroatia Lao People's Dem. Rep. Qatar122
Annex 2Geographical coverage of Ch<strong>in</strong>ese regionsRegionGeographical coverageNorth <strong>East</strong>North Coast<strong>East</strong> CoastSouth CoastCentralNorth WestSouth WestLiaon<strong>in</strong>g (6), Jil<strong>in</strong> (7), Heilongjiang (8)Beij<strong>in</strong>g (1), Tianj<strong>in</strong> (2), Hebei (3), Sh<strong>and</strong>ong (15)Shanghai (9), Jiangsu (10), Zhejiang (11)Fujian (13), Guangdong (19), Ha<strong>in</strong>an (21)Shanxi (4), Anhui (12), Jiangxi (14), Henan (16), Hubei (17), Hunan (18)Inner Mongolia (5), Shaanxi (27), Gansu (28), Q<strong>in</strong>ghai (29), N<strong>in</strong>gxia (30), X<strong>in</strong>jiang (31)Guangxi (20), Chongq<strong>in</strong>g (22), Sichuan (23), Guizhou (24), Yunnan (25), Tibet (26)123
<strong>Trade</strong> Patterns <strong>and</strong> Global Value Cha<strong>in</strong>s <strong>in</strong> <strong>East</strong> <strong>Asia</strong>Annex 3The schematic presentation of the <strong>IDE</strong>-<strong>JETRO</strong> <strong>Asia</strong>nInternational Input-Output (AIO) TableIntermediate Dem<strong>and</strong> (A) F<strong>in</strong>al Dem<strong>and</strong> (F) Export (L)IndonesiaMalaysiaPhilipp<strong>in</strong>esS<strong>in</strong>gaporeThail<strong>and</strong>Ch<strong>in</strong>aCh<strong>in</strong>ese TaipeiKorea, Rep. ofJapanUnited StatesIndonesiaMalaysiaPhilipp<strong>in</strong>esS<strong>in</strong>gaporeThail<strong>and</strong>Ch<strong>in</strong>aCh<strong>in</strong>ese TaipeiKorea, Rep. ofJapanUnited StatesExport to IndiaExport to Hong Kong (Ch<strong>in</strong>a)Export to EUExport to R.O.W.Statistical DiscrepancyTotal Outputscode (AI) (AM) (AP) (AS) (AT) (AC) (AN) (AK) (AJ) (AU) (FI) (FM) (FP) (FS) (FT) (FC) (FN) (FK) (FJ) (FU) (LG) (LH) (LO) (LW) (QX) (XX)Indonesia (AI) A II A IM A IP A IS A IT A IC A IN A IK A IJ A IU F II F IM F IP F IS F IT F IC F IN F IK F IJ F IU L IG L IH L IO L IW Q I X IMalaysia (AM) A MI A MM A MP A MS A MT A MC A MN A MK A MJ A MU F MI F MM F MP F MS F MT F MC F MN F MK F MJ F MU L MG L MH L MO L MW Q M X MPhilipp<strong>in</strong>es (AP) A PI A PM A PP A PS A PT A PC A PN A PK A PJ A PU F PI F PM F PP F PS F PT F PC F PN F PK F PJ F PU L PG L PH L PO L PW Q P X PS<strong>in</strong>gapore (AS) A SI A SM A SP A SS A ST A SC A SN A SK A SJ A SU F SI F SM F SP F SS F ST F SC F SN F SK F SJ F SU L SG L SH L SO L SW Q S X SThail<strong>and</strong> (AT) A TI A TM A TP A TS A TT A TC A TN A TK A TJ A TU F TI F TM F TP F TS F TT F TC F TN F TK F TJ F TU L TG L TH L TO L TW Q T X TCh<strong>in</strong>a (AC) A CI A CM A CP A CS A CT A CC A CN A CK A CJ A CU F CI F CM F CP F CS F CT F CC F CN F CK F CJ F CU L CG L CH L CO L CW Q C X CCh<strong>in</strong>ese Taipei (AN) A NI A NM A NP A NS A NT A NC A NN A NK A NJ A NU F NI F NM F NP F NS F NT F NC F NN F NK F NJ F NU L NG L NH L NO L NW Q N X NValued atproducer’spriceKorea, Rep. of (AK) A KI A KM A KP A KS A KT A KC A KN A KK A KJ A KU F KI F KM F KP F KS F KT F KC F KN F KK F KJ F KU L KG L KH L KO L KW Q K X KJapan (AJ) A JI A JM A JP A JS A JT A JC A JN A JK A JJ A JU F JI F JM F JP F JS F JT F JC F JN F JK F JJ F JU L JG L JH L JO L JW Q J X JUnited States (AU) A UI A UM A UP A US A UT A UC A UN A UK A UJ A UU F UI F UM F UP F US F UT F UC F UN F UK F UJ F UU L UG L UH L UO L UW Q U X UFreight <strong>and</strong> Insurance (BF) BA I BA M BA P BA S BA T BA C BA N BA K BA J BA U BF I BF M BF P BF S BF T BF C BF N BF K BF J BF UImport from India (CG) A GI A GM A GP A GS A GT A GC A GN A GK A GJ A GU F GI F GM F GP F GS F GT F GC F GN F GK F GJ F GUtrade between member countries (A**, F**)International freight <strong>and</strong> <strong>in</strong>surance on theImport from Hong Kong (Ch<strong>in</strong>a) (CH) A HI A HM A HP A HS A HT A HC A HN A HK A HJ A HU F HI F HM F HP F HS F HT F HC F HN F HK F HJ F HUValued at C.I.FImport from EU (CO) A OI A OM A OP A OS A OT A OC A ON A OK A OJ A OU F OI F OM F OP F OS F OT F OC F ON F OK F OJ F OUTotal Inputs (XX) X I X M X P X S X T X C X N X K X J X UImport from the R.O.W. (CW) A WI A WM A WP A WS A WT A WC A WN A WK A WJ A WU F WI F WM F WP F WS F WT F WC F WN F WK F WJ F WUDuties <strong>and</strong> Import Commodity Taxes (DT) DA I DA M DA P DA S DA T DA C DA N DA K DA J DA U DF I DF M DF P DF S DF T DF C DF N DF K DF J DF UValue Added (VV) V I V M V P V S V T V C V N V K V J V UImport duties <strong>and</strong> import commoditytaxes levied on all trade* Each cell of A** <strong>and</strong> F** represents a matrix of 76 x 76 <strong>and</strong> 76 x 4 dimension, respectively.In a column-wise direction, each cell <strong>in</strong> the table shows the <strong>in</strong>put compositions of<strong>in</strong>dustries of a respective country. A II for example shows the <strong>in</strong>put compositions ofIndonesian <strong>in</strong>dustries vis-à-vis domestically produced goods <strong>and</strong> services, i.e. domestictransactions of Indonesia. A MI <strong>in</strong> contrast shows the <strong>in</strong>put composition of Indonesian<strong>in</strong>dustries for imported goods <strong>and</strong> services from Malaysia. The cells A PI , A SI , A TI , A CI , A NI ,A KI , A JI , A UI , A GI , A HI , A OI , A WI allow the same <strong>in</strong>terpretation for the imports from othercountries.BA <strong>and</strong> DA give <strong>in</strong>ternational freight <strong>and</strong> <strong>in</strong>surance <strong>and</strong> taxes on these importtransactions.Turn<strong>in</strong>g to the 11 th column from the left side of the table, it shows the compositions ofgoods <strong>and</strong> services that have gone to f<strong>in</strong>al dem<strong>and</strong> sectors of Indonesia. F II <strong>and</strong> F MI , forexample, maps the <strong>in</strong>flow <strong>in</strong>to Indonesian f<strong>in</strong>al dem<strong>and</strong> sectors, of goods <strong>and</strong> servicesdomestically produced <strong>and</strong> of those imported from Malaysia, respectively. The rest ofthe column is read <strong>in</strong> the same manner as the 1 st column of the table.L *G , L *H , L *O , L *W are exports (vectors) to India, Hong Kong (Ch<strong>in</strong>a), EU <strong>and</strong> the rest ofthe world.Vs <strong>and</strong> Xs are <strong>value</strong> added <strong>and</strong> total <strong>in</strong>put/output, as seen <strong>in</strong> the conventional nationalI-O table.124
Annex 4Visualization of supply <strong>cha<strong>in</strong>s</strong>The conventional approach to this type of study is the l<strong>in</strong>kage analysis, which generally seeks to measure the “strength”of <strong>in</strong>terconnectedness among <strong>in</strong>dustries, as discussed <strong>in</strong> Chapter VI. The magnitude of backward <strong>and</strong>/or forwardl<strong>in</strong>kages is calculated between countries, us<strong>in</strong>g the Leontief/Ghosh <strong>in</strong>verse matrix of an <strong>in</strong>ternational <strong>in</strong>put-output table.In Chapter VII, however, a new perspective for the evaluation of cross-border production networks was <strong>in</strong>troducedemploy<strong>in</strong>g the <strong>in</strong>put-output model of Average Propagation Lengths (Dietzenbacher et al. 2005).Average Propagation Lengths (APL) is def<strong>in</strong>ed as:v ij= 1*a ij/ (l ij– δ ij) + 2*[A 2 ] ij/ (l ij– δ ij) + 3*[A 3 ] ij/ (l ij– δ ij) + ...= ∑ ([ ] ⁄ ∑[ ] )where A is an <strong>in</strong>put coefficient matrix, a ijis its element, l ijis a Leontief <strong>in</strong>verse coefficient, δ ijis a Kronecker delta whichis δ ij= 1 if i = j <strong>and</strong> δ ij= 0 otherwise, <strong>and</strong> k is a number of production stages along the path. We also def<strong>in</strong>e v ij= 0 when(l ij– δ ij) = 0.The first term <strong>in</strong> the right-h<strong>and</strong> side of the upper equation shows that the impact delivered through one-step paths (k=1),i.e. direct impact, amounts to an a ij/ (l ij– δ ij) share of the total impact given by the Leontief <strong>in</strong>verse coefficient (less unityfor diagonal elements). Similarly, two-step paths (k=2) contribute an [A 2 ] ij/ (l ij– δ ij) share, <strong>and</strong> three-step paths (k=3) an[A 3 ] ij/ (l ij– δ ij) share of the total impact. This is evident from L = I + A + A 2 + A 3 + ... (L: the Leontief <strong>in</strong>verse matrix) which isrearranged as L – I = A + A 2 + A 3 + ... , <strong>and</strong> hence (L – I) ij= A ij+ [A 2 ] ij+ [A 3 ] ij+ ...As an illustrative example, consider the follow<strong>in</strong>g hypothetical supply cha<strong>in</strong>:Calculation of APLINDUSTRY AINDUSTRY El ae= 0.20 (100%)Industry D(2)l (2) = 0.10 (50%)(1)Industry CIndustry EIndustry A(1) (2)(3)(4)Industry B Industry C Industry D Industry El (4) = 0.02 (10%)(1)Industry B(2)Industry CIndustry D(3)Industry El (3) = 0.06 (30%)(3)Industry D(4)Industry El (4) = 0.02 (10%)Source: <strong>IDE</strong>-<strong>JETRO</strong>.125
<strong>Trade</strong> Patterns <strong>and</strong> Global Value Cha<strong>in</strong>s <strong>in</strong> <strong>East</strong> <strong>Asia</strong>When the share of an impact for each path is calculated as given at the ends of the branches, the APL between IndustryA <strong>and</strong> Industry E is derived as:v ea= 1 x 0% + 2 x 50% + 3 x 30% + 4 x (10+10)% + 5 x 0% + … = 2.7.That is, APL is formulated as a weighted average of the number of production stages <strong>in</strong> which an impact from <strong>in</strong>dustry j goesthrough until it ultimately reaches <strong>in</strong>dustry i, us<strong>in</strong>g the share of an impact at each stage as a weight. It represents the averagenumber of production blocks l<strong>in</strong><strong>in</strong>g up <strong>in</strong> every branch of all the supply <strong>cha<strong>in</strong>s</strong>, or, <strong>in</strong> short, an <strong>in</strong>dustry’s level of fragmentation.Us<strong>in</strong>g these two types of <strong>in</strong>formation, namely, the “length” <strong>and</strong> “strength” of l<strong>in</strong>kages, the supply <strong>cha<strong>in</strong>s</strong> can be visualizedas per the follow<strong>in</strong>g example. Table 1 shows the cross-national APL of <strong>Asia</strong>-US region <strong>in</strong> 1985, by country of orig<strong>in</strong> (theleft column) <strong>and</strong> country of dest<strong>in</strong>ation (the top row). The <strong>value</strong>s of APL were first calculated at the level of seven <strong>in</strong>dustrialsectors, <strong>and</strong> then aggregated <strong>in</strong>to one sector per country by tak<strong>in</strong>g weighted averages with output shares as weights.Table 1APL <strong>in</strong> the <strong>Asia</strong>-US region, 1985Ch<strong>in</strong>a Indonesia Japan Korea,Rep. ofMalaysiaCh<strong>in</strong>eseTaipeiPhilipp<strong>in</strong>es S<strong>in</strong>gapore Thail<strong>and</strong> UnitedStatesCh<strong>in</strong>a 3.45 3.21 4.55 3.09 4.59 2.80 2.72 2.97 3.27Indonesia 3.33 3.27 3.23 3.05 3.35 2.67 2.67 3.19 3.26Japan 3.84 3.48 3.74 3.35 3.90 3.57 3.39 3.52 3.76Korea, Rep. of 5.24 3.18 3.35 3.09 3.63 3.09 3.01 3.35 3.45Malaysia 3.41 3.19 3.30 3.27 3.30 2.59 2.48 2.85 3.20Ch<strong>in</strong>ese Taipei 3.70 3.16 3.32 3.63 3.14 3.27 3.00 3.29 3.37Philipp<strong>in</strong>es 3.39 3.05 3.41 3.33 2.83 3.45 2.87 3.02 3.22S<strong>in</strong>gapore 3.33 2.44 3.10 3.15 2.60 3.28 2.97 2.80 3.09Thail<strong>and</strong> 3.43 2.91 3.46 3.48 2.74 3.45 3.04 2.74 3.18United States 3.82 3.26 3.74 3.62 3.44 3.68 3.40 3.34 3.30Source: The <strong>Asia</strong>n International Input-Output Table, 1985, <strong>IDE</strong>-<strong>JETRO</strong>.The “strength” of l<strong>in</strong>kages, as def<strong>in</strong>ed <strong>in</strong> a technical note <strong>in</strong> Annex 5, is then referred to. If the strength of l<strong>in</strong>kage is lessthan 0.018, this particular supply cha<strong>in</strong> is omitted from the picture, result<strong>in</strong>g <strong>in</strong> a blank cell <strong>in</strong> the APL table. If, on theother h<strong>and</strong>, the strength registers as be<strong>in</strong>g more than 0.025, this supply cha<strong>in</strong> is considered as a card<strong>in</strong>al path, whichis translated as a bold number <strong>in</strong> a highlighted cell. The result of the operation gives the follow<strong>in</strong>g new APL table. Notethat we only consider cross-border l<strong>in</strong>kages, or off-diagonals, <strong>and</strong> that the <strong>value</strong>s have been rounded up <strong>in</strong>to <strong>in</strong>tegers.Table 2Screened-out Average Propagation Lengths <strong>in</strong> the <strong>Asia</strong>-US region, 1985Ch<strong>in</strong>a Indonesia Japan Korea,Rep. ofMalaysiaCh<strong>in</strong>eseTaipeiPhilipp<strong>in</strong>es S<strong>in</strong>gapore Thail<strong>and</strong> UnitedStatesCh<strong>in</strong>a 3Indonesia 3JapanKorea, Rep. ofMalaysia 3 2Ch<strong>in</strong>ese TaipeiPhilipp<strong>in</strong>esS<strong>in</strong>gapore 3Thail<strong>and</strong>United StatesSource: The <strong>Asia</strong>n International Input-Output Table, 1985, <strong>IDE</strong>-<strong>JETRO</strong>.The <strong>in</strong>formation given <strong>in</strong> Table 2 is mapped <strong>in</strong>to the diagram <strong>in</strong> Figure 1 of Chapter VII as the supply <strong>cha<strong>in</strong>s</strong> amongIndonesia, Japan, Malaysia <strong>and</strong> S<strong>in</strong>gapore <strong>in</strong> the case of the year 1985.126
Annex 5Other technical notesIndustrial specialization of countriesIndustrial specialization is measured by a deviation of output share of an <strong>in</strong>dustry from the average of output share ofthat <strong>in</strong>dustry across the countries, or more specifically:IS r i =x r i /Σ xr iΣ ( x r i /Σ xr i ) / nriiwhere x r is the output of <strong>in</strong>dustry i <strong>in</strong> country r, <strong>and</strong> n is the number of countries <strong>in</strong> the region. This measurementiis advantageous over the conventional Location Quotient (LQ) s<strong>in</strong>ce it avoids the overwhelm<strong>in</strong>g size effect of largeeconomies (like the United States) on the <strong>in</strong>dustrial structure of the region.Strength of l<strong>in</strong>kagesThe “strength” of l<strong>in</strong>kages is formulated as a simple element-to-element average of Leontief <strong>in</strong>verse coefficients (lessunity for diagonals) <strong>and</strong> Ghosh <strong>in</strong>verse coefficients (less unity for diagonals), or {(l ij– δ ij) + (g ij– δ ij)}/2, where l ijis a Leontief<strong>in</strong>verse coefficient, g ijis a Ghosh <strong>in</strong>verse coefficient, <strong>and</strong> δ ijis a Kronecker delta which is δ ij=1 if i=j <strong>and</strong> δ ij=0 otherwise.The <strong>value</strong>s were first calculated at the level of seven <strong>in</strong>dustrial sectors, <strong>and</strong> then aggregated <strong>in</strong>to one sector per countryby tak<strong>in</strong>g weighted averages with output shares as weights.Cross-border transfer of employment opportunitiesThe sectoral employment of each country generated by the f<strong>in</strong>al dem<strong>and</strong>s of its trade partners can be calculated <strong>in</strong> thefollow<strong>in</strong>g form:Emp rs = E r L rs y swhere E r is a diagonal matrix with employment coefficients (the number of workers required <strong>in</strong> order to produce oneunit of output) of country r <strong>in</strong> its correspond<strong>in</strong>g diagonal elements <strong>and</strong> zeros elsewhere, L rs is the <strong>in</strong>ternational Leontief<strong>in</strong>verse matrix, <strong>and</strong> y s is a f<strong>in</strong>al dem<strong>and</strong> vector of country s (= a trade partner).Cross-border transfer of <strong>value</strong> addedTransfer of <strong>value</strong> added from country s to country r can be def<strong>in</strong>ed as follows:TVA rs = u’V r L rs y swhere V r is a diagonal matrix with <strong>value</strong>-added coefficients of country r <strong>in</strong> its correspond<strong>in</strong>g diagonal elements <strong>and</strong> zeroselsewhere, L rs is the <strong>in</strong>ternational Leontief <strong>in</strong>verse matrix, y s is a f<strong>in</strong>al dem<strong>and</strong> vector of country s, <strong>and</strong> u is a summationvector. The calculated results are then st<strong>and</strong>ardized by tak<strong>in</strong>g a deviation of each country’s total figure from the regionalgr<strong>and</strong> average, to give <strong>in</strong>dices of <strong>value</strong>-added ga<strong>in</strong> <strong>and</strong> give-out potentials.127
<strong>Trade</strong> Patterns <strong>and</strong> Global Value Cha<strong>in</strong>s <strong>in</strong> <strong>East</strong> <strong>Asia</strong>Decomposition of growth contribution by orig<strong>in</strong>sConsider a three-region I-O model as given as follows:x = (I – A) -1 y = L ywhere x, A, y <strong>and</strong> L are, respectively, a vector of output, a matrix of <strong>in</strong>terregional <strong>in</strong>put coefficients, a vector of f<strong>in</strong>aldem<strong>and</strong>, <strong>and</strong> a matrix of the <strong>in</strong>terregional Leontief <strong>in</strong>verse. They are def<strong>in</strong>ed <strong>in</strong> the follow<strong>in</strong>g forms:1x 2A 11A 12A 13x 3 21A 31 22A 32 23A 33 2y 321L 3122L 3223L 33y 1 L 11 L 12 L 13x = ( ), A = ( ), y = ( ), L = ( ) = (I – A) -1where x 1 = (x 1 1 ,x1, 2 ...,x1 )’ represents the output vector of region 1 with n sectors, <strong>and</strong> I is an identity matrix with a dimensionnof 3n x 3n.Then the outputs of region 1 <strong>in</strong> the base year (0) <strong>and</strong> target year (t) can be given as follows.x 1 (0) = L 11 (0) y 1 (0) + L 12 (0) y 2 (0) + L 13 (0) y 3 (0)x 1 (t) = (L 11 (0) + ∆L 11 ) (y 1 (0) + ∆y 1 ) + (L 12 (0) + ∆L 12 ) (y 2 (0) + ∆y 2 ) + (L 13 (0) + ∆L 13 ) (y 3 (0) + ∆y 3 )Us<strong>in</strong>g the two equations above, the output growth rate of region 1 can be written as:[∆x 1 ] i/ [x 1 (0)] i= [(x 1 (t) – x 1 (0))] i/ [x 1 (0)] i(i = 1, 2, 3, ..., n)= [(L 11 (0) ∆y 1 + L 12 (0) ∆y 2 + L 13 (0) ∆y 3 )] i/ [x 1 (0)] i+ [(∆L 11 y 1 (0) + ∆L 12 y 2 (0) + ∆L 13 y 3 (0))] i/ [x 1 (0)] i+ [(ΔL 11 Δy 1 + ΔL 12 Δy 2 + ΔL 13 Δy 3 )] i/ [x 1 (0)] i<strong>in</strong> which the output growth of region 1 is decomposed <strong>in</strong>to the contribution of its own domestic dem<strong>and</strong> (Δy 1 ), of thedem<strong>and</strong> from region 2 (Δy 2 ), <strong>and</strong> of the dem<strong>and</strong> from region 3 (Δy 3 ), <strong>and</strong> correspond<strong>in</strong>g technical changes (ΔL 11 , ΔL 12 ,ΔL 13 ).128
© <strong>IDE</strong>-<strong>JETRO</strong> <strong>and</strong> World <strong>Trade</strong> Organization, 2011. Reproduction of materialconta<strong>in</strong>ed <strong>in</strong> this document may be made only with written permission of the<strong>IDE</strong>-<strong>JETRO</strong> <strong>and</strong> WTO Publications Managers.With written permission of the <strong>IDE</strong>-<strong>JETRO</strong> <strong>and</strong> WTO Publications Managers,reproduction <strong>and</strong> use of the material conta<strong>in</strong>ed <strong>in</strong> this document for non-commercialeducational <strong>and</strong> tra<strong>in</strong><strong>in</strong>g purposes is encouraged.WTO ISBN 978-92-870-3767-1This publication will also be available <strong>in</strong> French <strong>and</strong> SpanishFrench title ISBN: 978-92-870-3768-8Spanish title ISBN: 978-92-870-3769-5Pr<strong>in</strong>ted by the WTO SecretariatPublication designed by Giacomo Frigerio© World <strong>Trade</strong> Organization 2011World <strong>Trade</strong> OrganizationCentre William RappardRue de Lausanne 154CH-1211 Geneva 21Switzerl<strong>and</strong>Email: publications@wto.orgOnl<strong>in</strong>e WTO bookshop: http://onl<strong>in</strong>ebookshop.wto.orgPhoto credits: iStockphoto
The <strong>in</strong>creas<strong>in</strong>g <strong>in</strong>ternationalization of supply <strong>cha<strong>in</strong>s</strong> is challeng<strong>in</strong>g our<strong>in</strong>terpretation of conventional trade statistics, as traditional concepts likecountry of orig<strong>in</strong>, or the dist<strong>in</strong>ction between goods <strong>and</strong> services, becomeblurred.This publication, jo<strong>in</strong>tly produced by the WTO <strong>and</strong> <strong>IDE</strong>-<strong>JETRO</strong>, focuses on thefactors that have helped to shape <strong>global</strong> production. Start<strong>in</strong>g with dem<strong>and</strong>,it describes how a chang<strong>in</strong>g economic environment has contributed to thephenomenon of <strong>global</strong> production. Infrastructure services, tariffs, foreigndirect <strong>in</strong>vestment, cheaper technology <strong>and</strong> lower transportation costs haveall affected the trad<strong>in</strong>g environment <strong>and</strong> the <strong>in</strong>ternational exchange of goods,foster<strong>in</strong>g <strong>in</strong>creased market access, amplify<strong>in</strong>g cross-border l<strong>in</strong>ks betweencompanies <strong>and</strong> caus<strong>in</strong>g trade <strong>in</strong> <strong>in</strong>termediate goods to <strong>in</strong>crease. Thispublication considers the effect of these factors on <strong>in</strong>ternational productionnetworks, with a particular focus on “Factory <strong>Asia</strong>”. It also shows how thedevelopment <strong>and</strong> evolution of these production networks has promotedeconomic growth <strong>and</strong> employment <strong>in</strong> <strong>Asia</strong>.A new statistical measurement – trade <strong>in</strong> <strong>value</strong> added – is proposedto complement conventional trade statistics for a deeper <strong>and</strong> morecomprehensive analysis of trade <strong>patterns</strong>. This methodology offers a newperspective for trade analysts, as it dramatically re-evaluates the importanceof some economies as “countries of orig<strong>in</strong>”.The “Made <strong>in</strong> the World” <strong>in</strong>itiative hasbeen launched by the WTO to support theexchange of projects, experiences <strong>and</strong>practical approaches <strong>in</strong> measur<strong>in</strong>g <strong>and</strong>analys<strong>in</strong>g trade <strong>in</strong> <strong>value</strong> added.www.wto.org/miwi9 789287 037671