Trade patterns and global value chains in East Asia: - IDE-JETRO
Trade patterns and global value chains in East Asia: - IDE-JETRO
Trade patterns and global value chains in East Asia: - IDE-JETRO

Create successful ePaper yourself
Turn your PDF publications into a flip-book with our unique Google optimized e-Paper software.
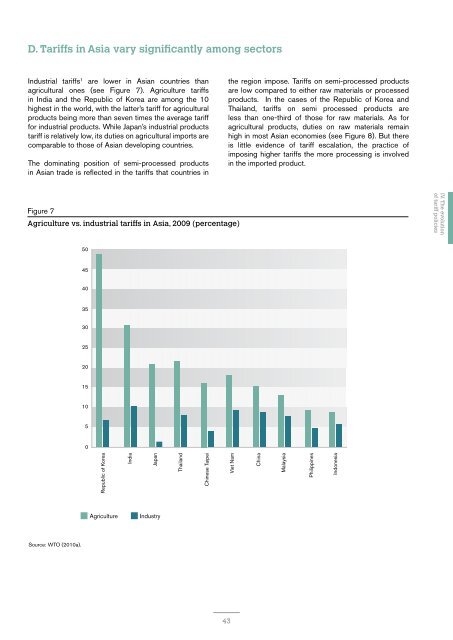
D. Tariffs <strong>in</strong> <strong>Asia</strong> vary significantly among sectorsI. From massdem<strong>and</strong> to <strong>global</strong>supply <strong>cha<strong>in</strong>s</strong>Industrial tariffs 1 are lower <strong>in</strong> <strong>Asia</strong>n countries thanagricultural ones (see Figure 7). Agriculture tariffs<strong>in</strong> India <strong>and</strong> the Republic of Korea are among the 10highest <strong>in</strong> the world, with the latter’s tariff for agriculturalproducts be<strong>in</strong>g more than seven times the average tarifffor <strong>in</strong>dustrial products. While Japan’s <strong>in</strong>dustrial productstariff is relatively low, its duties on agricultural imports arecomparable to those of <strong>Asia</strong>n develop<strong>in</strong>g countries.The dom<strong>in</strong>at<strong>in</strong>g position of semi-processed products<strong>in</strong> <strong>Asia</strong>n trade is reflected <strong>in</strong> the tariffs that countries <strong>in</strong>the region impose. Tariffs on semi-processed productsare low compared to either raw materials or processedproducts. In the cases of the Republic of Korea <strong>and</strong>Thail<strong>and</strong>, tariffs on semi processed products areless than one-third of those for raw materials. As foragricultural products, duties on raw materials rema<strong>in</strong>high <strong>in</strong> most <strong>Asia</strong>n economies (see Figure 8). But thereis little evidence of tariff escalation, the practice ofimpos<strong>in</strong>g higher tariffs the more process<strong>in</strong>g is <strong>in</strong>volved<strong>in</strong> the imported product.II. Organizationof the <strong>global</strong>production processIII. Infrastructureservices <strong>in</strong> <strong>global</strong><strong>value</strong> <strong>cha<strong>in</strong>s</strong>Figure 7Agriculture vs. <strong>in</strong>dustrial tariffs <strong>in</strong> <strong>Asia</strong>, 2009 (percentage)IV. The evolutionof tariff policies504540V. Foreign direct<strong>in</strong>vestment353025VI. Integrateddiversity2015105VII. An evolutionaryperspective onproduction networks<strong>in</strong> the <strong>Asia</strong>-US region0Republic of KoreaAgricultureIndiaJapanIndustryThail<strong>and</strong>Ch<strong>in</strong>ese TaipeiViet NamCh<strong>in</strong>aMalaysiaPhilipp<strong>in</strong>esIndonesiaVIII. <strong>Trade</strong> <strong>in</strong><strong>in</strong>termediate goodsIX. Vertical trade<strong>and</strong> trade <strong>in</strong><strong>value</strong> addedSource: WTO (2010a).X. Cross-regionalspillover ofeconomic growth43