Trade patterns and global value chains in East Asia: - IDE-JETRO
Trade patterns and global value chains in East Asia: - IDE-JETRO
Trade patterns and global value chains in East Asia: - IDE-JETRO

Create successful ePaper yourself
Turn your PDF publications into a flip-book with our unique Google optimized e-Paper software.
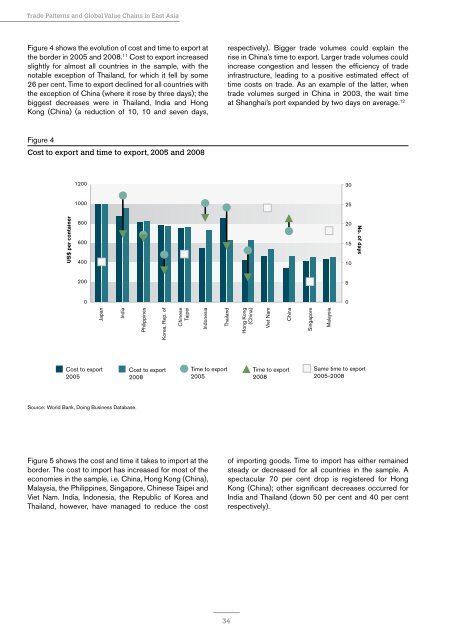
<strong>Trade</strong> Patterns <strong>and</strong> Global Value Cha<strong>in</strong>s <strong>in</strong> <strong>East</strong> <strong>Asia</strong>Figure 4 shows the evolution of cost <strong>and</strong> time to export atthe border <strong>in</strong> 2005 <strong>and</strong> 2008. 11 Cost to export <strong>in</strong>creasedslightly for almost all countries <strong>in</strong> the sample, with thenotable exception of Thail<strong>and</strong>, for which it fell by some26 per cent. Time to export decl<strong>in</strong>ed for all countries withthe exception of Ch<strong>in</strong>a (where it rose by three days); thebiggest decreases were <strong>in</strong> Thail<strong>and</strong>, India <strong>and</strong> HongKong (Ch<strong>in</strong>a) (a reduction of 10, 10 <strong>and</strong> seven days,respectively). Bigger trade volumes could expla<strong>in</strong> therise <strong>in</strong> Ch<strong>in</strong>a’s time to export. Larger trade volumes could<strong>in</strong>crease congestion <strong>and</strong> lessen the efficiency of trade<strong>in</strong>frastructure, lead<strong>in</strong>g to a positive estimated effect oftime costs on trade. As an example of the latter, whentrade volumes surged <strong>in</strong> Ch<strong>in</strong>a <strong>in</strong> 2003, the wait timeat Shanghai’s port exp<strong>and</strong>ed by two days on average. 12Figure 4Cost to export <strong>and</strong> time to export, 2005 <strong>and</strong> 2008120030100025US$ per conta<strong>in</strong>er800600400201510No. of days200500JapanIndiaPhilipp<strong>in</strong>esKorea, Rep. ofCh<strong>in</strong>eseTaipeiIndonesiaThail<strong>and</strong>Hong Kong(Ch<strong>in</strong>a)Viet NamCh<strong>in</strong>aS<strong>in</strong>gaporeMalaysiaCost to export2005Cost to export2008Time to export2005Time to export2008Same time to export2005-2008Source: World Bank, Do<strong>in</strong>g Bus<strong>in</strong>ess Database.Figure 5 shows the cost <strong>and</strong> time it takes to import at theborder. The cost to import has <strong>in</strong>creased for most of theeconomies <strong>in</strong> the sample, i.e. Ch<strong>in</strong>a, Hong Kong (Ch<strong>in</strong>a),Malaysia, the Philipp<strong>in</strong>es, S<strong>in</strong>gapore, Ch<strong>in</strong>ese Taipei <strong>and</strong>Viet Nam. India, Indonesia, the Republic of Korea <strong>and</strong>Thail<strong>and</strong>, however, have managed to reduce the costof import<strong>in</strong>g goods. Time to import has either rema<strong>in</strong>edsteady or decreased for all countries <strong>in</strong> the sample. Aspectacular 70 per cent drop is registered for HongKong (Ch<strong>in</strong>a); other significant decreases occurred forIndia <strong>and</strong> Thail<strong>and</strong> (down 50 per cent <strong>and</strong> 40 per centrespectively).34