Trade patterns and global value chains in East Asia: - IDE-JETRO
Trade patterns and global value chains in East Asia: - IDE-JETRO
Trade patterns and global value chains in East Asia: - IDE-JETRO

Create successful ePaper yourself
Turn your PDF publications into a flip-book with our unique Google optimized e-Paper software.
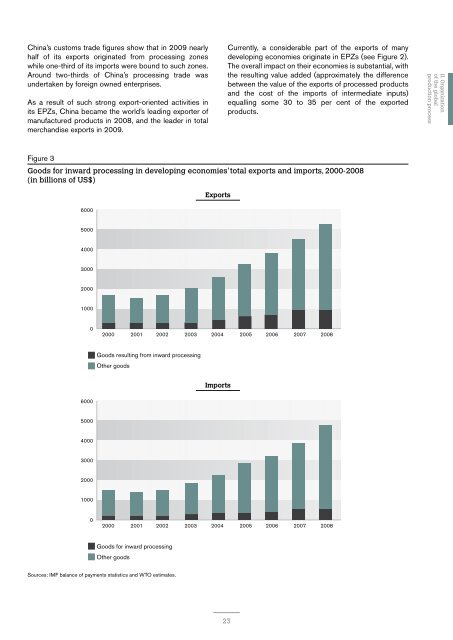
Ch<strong>in</strong>a’s customs trade figures show that <strong>in</strong> 2009 nearlyhalf of its exports orig<strong>in</strong>ated from process<strong>in</strong>g zoneswhile one-third of its imports were bound to such zones.Around two-thirds of Ch<strong>in</strong>a’s process<strong>in</strong>g trade wasundertaken by foreign owned enterprises.As a result of such strong export-oriented activities <strong>in</strong>its EPZs, Ch<strong>in</strong>a became the world’s lead<strong>in</strong>g exporter ofmanufactured products <strong>in</strong> 2008, <strong>and</strong> the leader <strong>in</strong> totalmerch<strong>and</strong>ise exports <strong>in</strong> 2009.Currently, a considerable part of the exports of manydevelop<strong>in</strong>g economies orig<strong>in</strong>ate <strong>in</strong> EPZs (see Figure 2).The overall impact on their economies is substantial, withthe result<strong>in</strong>g <strong>value</strong> added (approximately the differencebetween the <strong>value</strong> of the exports of processed products<strong>and</strong> the cost of the imports of <strong>in</strong>termediate <strong>in</strong>puts)equall<strong>in</strong>g some 30 to 35 per cent of the exportedproducts.Figure 3Goods for <strong>in</strong>ward process<strong>in</strong>g <strong>in</strong> develop<strong>in</strong>g economies’ total exports <strong>and</strong> imports, 2000-2008(<strong>in</strong> billions of US$)I. From massdem<strong>and</strong> to <strong>global</strong>supply <strong>cha<strong>in</strong>s</strong>II. Organizationof the <strong>global</strong>production processIII. Infrastructureservices <strong>in</strong> <strong>global</strong><strong>value</strong> <strong>cha<strong>in</strong>s</strong>60005000ExportsIV. The evolutionof tariff policies400030002000V. Foreign direct<strong>in</strong>vestment100002000 2001 2002 2003 2004 2005 2006 2007 2008VI. Integrateddiversity60005000Goods result<strong>in</strong>g from <strong>in</strong>ward process<strong>in</strong>gOther goodsImportsVII. An evolutionaryperspective onproduction networks<strong>in</strong> the <strong>Asia</strong>-US region400030002000VIII. <strong>Trade</strong> <strong>in</strong><strong>in</strong>termediate goods100002000 2001 2002 2003 2004 2005 2006 2007 2008IX. Vertical trade<strong>and</strong> trade <strong>in</strong><strong>value</strong> addedGoods for <strong>in</strong>ward process<strong>in</strong>gOther goodsSources: IMF balance of payments statistics <strong>and</strong> WTO estimates.X. Cross-regionalspillover ofeconomic growth23