CPI January - Uganda Bureau of Statistics
CPI January - Uganda Bureau of Statistics
CPI January - Uganda Bureau of Statistics

Create successful ePaper yourself
Turn your PDF publications into a flip-book with our unique Google optimized e-Paper software.
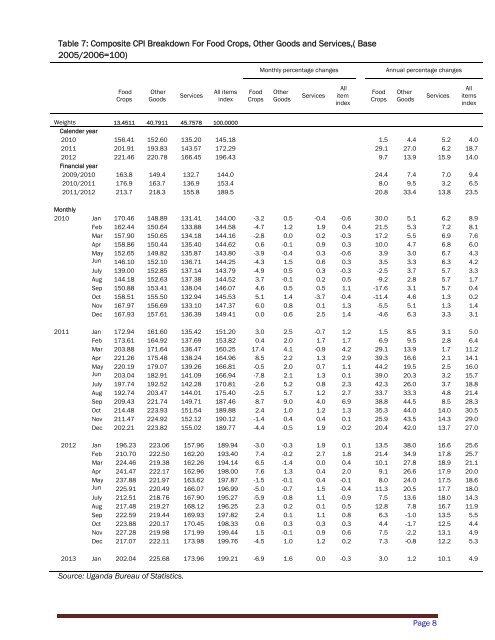
Table 7: Composite <strong>CPI</strong> Breakdown For Food Crops, Other Goods and Services,( Base2005/2006=100)Monthly percentage changesAnnual percentage changesFoodCropsOtherGoodsServicesAll itemsindexFoodCropsOtherGoodsServicesAllitemindexFoodCropsOtherGoodsServicesAllitemsindexWeights 13.4511 40.7911 45.7578 100.0000Calender year2010 156.41 152.60 135.20 145.18 1.5 4.4 5.2 4.02011 201.91 193.83 143.57 172.29 29.1 27.0 6.2 18.72012 221.46 220.78 166.45 196.43 9.7 13.9 15.9 14.0Financial year2009/2010 163.8 149.4 132.7 144.0 24.4 7.4 7.0 9.42010/2011 176.9 163.7 136.9 153.4 8.0 9.5 3.2 6.52011/2012 213.7 218.3 155.8 189.5 20.8 33.4 13.8 23.5Monthly2010 Jan 170.46 148.89 131.41 144.00 -3.2 0.5 -0.4 -0.6 30.0 5.1 6.2 8.9Feb 162.44 150.64 133.88 144.58 -4.7 1.2 1.9 0.4 21.5 5.3 7.2 8.1Mar 157.90 150.65 134.18 144.16 -2.8 0.0 0.2 -0.3 17.2 5.5 6.9 7.6Apr 158.86 150.44 135.40 144.62 0.6 -0.1 0.9 0.3 10.0 4.7 6.8 6.0May 152.65 149.82 135.87 143.80 -3.9 -0.4 0.3 -0.6 3.9 3.0 6.7 4.3Jun 146.10 152.10 136.71 144.25 -4.3 1.5 0.6 0.3 3.5 3.3 6.3 4.2July 139.00 152.85 137.14 143.79 -4.9 0.5 0.3 -0.3 -2.5 3.7 5.7 3.3Aug 144.18 152.63 137.38 144.52 3.7 -0.1 0.2 0.5 -9.2 2.8 5.7 1.7Sep 150.88 153.41 138.04 146.07 4.6 0.5 0.5 1.1 -17.6 3.1 5.7 0.4Oct 158.51 155.50 132.94 145.53 5.1 1.4 -3.7 -0.4 -11.4 4.6 1.3 0.2Nov 167.97 156.69 133.10 147.37 6.0 0.8 0.1 1.3 -5.5 5.1 1.3 1.4Dec 167.93 157.61 136.39 149.41 0.0 0.6 2.5 1.4 -4.6 6.3 3.3 3.12011 Jan 172.94 161.60 135.42 151.20 3.0 2.5 -0.7 1.2 1.5 8.5 3.1 5.0Feb 173.61 164.92 137.69 153.82 0.4 2.0 1.7 1.7 6.9 9.5 2.8 6.4Mar 203.88 171.64 136.47 160.25 17.4 4.1 -0.9 4.2 29.1 13.9 1.7 11.2Apr 221.26 175.48 138.24 164.96 8.5 2.2 1.3 2.9 39.3 16.6 2.1 14.1May 220.19 179.07 139.26 166.81 -0.5 2.0 0.7 1.1 44.2 19.5 2.5 16.0Jun 203.04 182.91 141.09 166.94 -7.8 2.1 1.3 0.1 39.0 20.3 3.2 15.7July 197.74 192.52 142.28 170.81 -2.6 5.2 0.8 2.3 42.3 26.0 3.7 18.8Aug 192.74 203.47 144.01 175.40 -2.5 5.7 1.2 2.7 33.7 33.3 4.8 21.4Sep 209.43 221.74 149.71 187.46 8.7 9.0 4.0 6.9 38.8 44.5 8.5 28.3Oct 214.48 223.93 151.54 189.88 2.4 1.0 1.2 1.3 35.3 44.0 14.0 30.5Nov 211.47 224.92 152.12 190.12 -1.4 0.4 0.4 0.1 25.9 43.5 14.3 29.0Dec 202.21 223.82 155.02 189.77 -4.4 -0.5 1.9 -0.2 20.4 42.0 13.7 27.02012 Jan 196.23 223.06 157.96 189.94 -3.0 -0.3 1.9 0.1 13.5 38.0 16.6 25.6Feb 210.70 222.50 162.20 193.40 7.4 -0.2 2.7 1.8 21.4 34.9 17.8 25.7Mar 224.46 219.38 162.26 194.14 6.5 -1.4 0.0 0.4 10.1 27.8 18.9 21.1Apr 241.47 222.17 162.96 198.00 7.6 1.3 0.4 2.0 9.1 26.6 17.9 20.0May 237.88 221.97 163.62 197.87 -1.5 -0.1 0.4 -0.1 8.0 24.0 17.5 18.6Jun 225.91 220.49 166.07 196.99 -5.0 -0.7 1.5 -0.4 11.3 20.5 17.7 18.0July 212.51 218.76 167.90 195.27 -5.9 -0.8 1.1 -0.9 7.5 13.6 18.0 14.3Aug 217.48 219.27 168.12 196.25 2.3 0.2 0.1 0.5 12.8 7.8 16.7 11.9Sep 222.59 219.44 169.93 197.82 2.4 0.1 1.1 0.8 6.3 -1.0 13.5 5.5Oct 223.88 220.17 170.45 198.33 0.6 0.3 0.3 0.3 4.4 -1.7 12.5 4.4Nov 227.28 219.98 171.99 199.44 1.5 -0.1 0.9 0.6 7.5 -2.2 13.1 4.9Dec 217.07 222.11 173.98 199.76 -4.5 1.0 1.2 0.2 7.3 -0.8 12.2 5.32013 Jan 202.04 225.68 173.96 199.21 -6.9 1.6 0.0 -0.3 3.0 1.2 10.1 4.9Source: <strong>Uganda</strong> <strong>Bureau</strong> <strong>of</strong> <strong>Statistics</strong>.Page 8