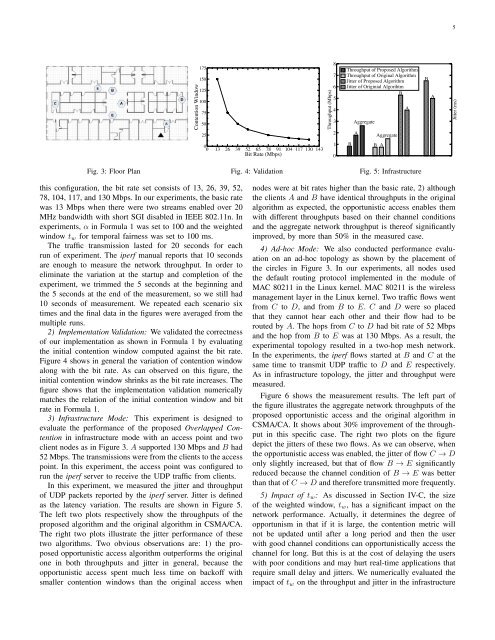
4selected values are near to the expectation in the normaldistribution.C. Temporal Fairness to Avoid StarvationThe equal probability access regardless <strong>of</strong> channel conditionsin the CSMA/CA leads to an anomaly that all nodes willhave identical throughputs in the long run [8], which is calledthroughput fairness. It is obvious that the nodes at lower bitrate hurt the throughputs <strong>of</strong> the nodes at higher bit rates aswell as the overall throughput <strong>of</strong> the network. This fairnessis not “fair” in temporal use <strong>of</strong> the channel among nodes.With the identical throughput, a node at the lowest bit rate ina network will use the channel for the longest time. On theother hand, as discussed in Section III, although opportunisticaccess can improve the network throughput by always favoringthe users with the best channel conditions, it may starve theusers with poor channel conditions. A solution both problems<strong>of</strong> identical throughputs and starvation is to achieve temporalfairness among nodes [19] that is defined as each node hasapproximately the identical amount <strong>of</strong> time in using channel.To achieve temporal fairness, we propose to use a bitrate normalized average throughput as a metric in computingthe initial contention window. Each node tracks the averagethroughput T updated in an exponentially weighted windowt w . Suppose Node K is the transmitter at a certain moment,T is updated at each node k that has packets ready fortransmission in each time slot with a low-pass filter as:{(1 −1tT k [m+1] =w) × T k [m] + 1t w× R k [m] if k = K(1 − 1t w) × T k [m]if k ≠ KThe bit rate normalized average throughput for node k havingbit rate R k in the m-th window is defined as:T normalized [k, m] = T k [m]/R k (3)This is used to compute the initial contention window. As aresult, Formula 1 is accordingly updated as:CW = α × T normolizd [k, m] × CW base (4)The contention with Formula 3 maintains two importantfeatures: temporal fairness and opportunism. The temporalfairness is achieved because the bit rate normalized averagethroughput can actually be explained as the temporal quota<strong>of</strong> a node in transmission period. This is clear if we rewritethe definition <strong>of</strong> T normalized [k, m] as (t c × T k [m]/R k )/t c ina period <strong>of</strong> length t c : t c × T k [m] is the average transmitteddata in bits and thereby t c × T k [m]/R k is the transmissiontime. Thus, (t c × T k [m]/R k )/t c is the the percentage <strong>of</strong> thetime that node k gains for transmission in a period <strong>of</strong> t c . Theopportunism in Formula 3 is driven by the bit rate. If a nodehas a high bit rate, its T normalized [k, m] tends to be small.According to Formula 4, a small T normalized [k, m] leads to asmall contention window CW to win the channel. If a nodeuses the channel for too long, it will end up with a largeaverage throughput T k [m], thereby a large T normalized [k, m]that enlarges its contention window and decreases its chanceto win the channel.Note that the size <strong>of</strong> the weighted window, t w , is associatedwith the latency requirement <strong>of</strong> applications. If t w is large, itallows the node with the optimal channel condition to use thechannel for a long duration, but may hurt other nodes havingapplications requiring low latency. If it is small, the channel isfrequently switched among nodes <strong>of</strong> different bit rates and theoverall performance degrades. Another concern is the support<strong>of</strong> QoS. If multiple classes <strong>of</strong> applications are involved, eachclass has different requirements, especially regarding latency.Then, a weight parameter φ c for each class <strong>of</strong> application isnecessary in updating the average throughput as: T k [m + 1] =(1 − 1t w) × T k [m] + 1t w× φ × R k [m].V. PERFORMANCE EVALUATIONWe extensively evaluated the performance <strong>of</strong> the proposedopportunistic access algorithms with both prototyping andsimulation.A. Evaluation with PrototypingTo evaluate the opportunistic access performance in realworld, we implemented a Linux based testbed. The implementationincludes only the first algorithm–Overlapped Contentionbecause the other two require the modification <strong>of</strong> the lowerbound <strong>of</strong> the back<strong>of</strong>f window that is “sealed” as 0 in the closedfirmware to which we do not have access.1) Implementation Platform and Experiment Settings: Ourprototype testbed consists <strong>of</strong> six embedded computing nodesbased on Alix 3dc SBC that has a 512 MHz AMD LX800CPU, 256M RAM, and 8GB SD Card storage, and runsLinux kernel version 3.3.1. Each node is equipped with aminiPCI IEEE 802.11a/b/g/n WiFi adapter, MkroTik R52Hn,that is based on Atheros AR9220 chipset that is well supportedby the open source Linux driver Ath9k [10]. Each interfaceis connected to a pair <strong>of</strong> external high gain antennas. Theimplementation is based on the Linux wireless modules [9].The testbed were deployed in the second floor <strong>of</strong> the BobbyChain Science <strong>Tech</strong>nology Building on campus with a floorplan as shown in Figure 3. The building consists <strong>of</strong> laboratories,<strong>of</strong>fices and classrooms. Both infrastructure (WLAN)and infrastructureless (Ad-hoc) modes were evaluated. Ininfrastructure mode, one <strong>of</strong> the nodes was configured to workas the access point represented by the black triangle in Figure 3and two client nodes were placed at the locations <strong>of</strong> circlesA and B in the figure. The five hexagons in Figure 3 showthe infrastructureless mesh topology. We conducted all ourexperiments at midnight to minimize the external surroundinginterference such as walking people because all classes weredismissed and people were away from work. There are threenon-overlapping channels(1, 6, 11) available in IEEE 802.11.We chose channel 1 since channel 6 and channel 11 wereheavily used by surrounding networks. As for the s<strong>of</strong>twaretools, we use iperf [26] to generate and collect UDP trafficfrom clients to the access point. We did not choose TCP trafficbecause we would focus on the evaluation <strong>of</strong> the MAC accessperformance. The network was set in the IEEE 802.11n modewith two transmission streams and 20MHz bandwidth. With
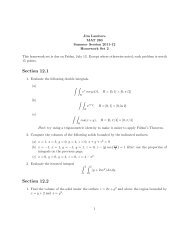
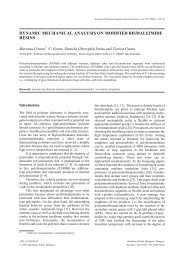
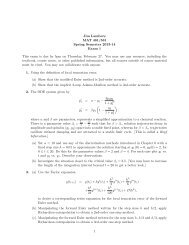
5Contention Window175150125100755025Throughput (Mbps)8765432Throughput <strong>of</strong> Proposed AlgorithmThroughput <strong>of</strong> Original AlgorithmJitter <strong>of</strong> Proposed AlgorithmJitter <strong>of</strong> Originial AlgorihtmBAggregateAAggregateABAJitter (ms)00 13 26 39 52 65 78 91 104 117 130 143Bit Rate (Mbps)10BB AFig. 3: Floor PlanFig. 4: ValidationFig. 5: Infrastructurethis configuration, the bit rate set consists <strong>of</strong> 13, 26, 39, 52,78, 104, 117, and 130 Mbps. In our experiments, the basic ratewas 13 Mbps when there were two streams enabled over 20MHz bandwidth with short SGI disabled in IEEE 802.11n. Inexperiments, α in Formula 1 was set to 100 and the weightedwindow t w for temporal fairness was set to 100 ms.The traffic transmission lasted for 20 seconds for eachrun <strong>of</strong> experiment. The iperf manual reports that 10 secondsare enough to measure the network throughput. In order toeliminate the variation at the startup and completion <strong>of</strong> theexperiment, we trimmed the 5 seconds at the beginning andthe 5 seconds at the end <strong>of</strong> the measurement, so we still had10 seconds <strong>of</strong> measurement. We repeated each scenario sixtimes and the final data in the figures were averaged from themultiple runs.2) Implementation Validation: We validated the correctness<strong>of</strong> our implementation as shown in Formula 1 by evaluatingthe initial contention window computed against the bit rate.Figure 4 shows in general the variation <strong>of</strong> contention windowalong with the bit rate. As can observed on this figure, theinitial contention window shrinks as the bit rate increases. Thefigure shows that the implementation validation numericallymatches the relation <strong>of</strong> the initial contention window and bitrate in Formula 1.3) Infrastructure Mode: This experiment is designed toevaluate the performance <strong>of</strong> the proposed Overlapped Contentionin infrastructure mode with an access point and twoclient nodes as in Figure 3. A supported 130 Mbps and B had52 Mbps. The transmissions were from the clients to the accesspoint. In this experiment, the access point was configured torun the iperf server to receive the UDP traffic from clients.In this experiment, we measured the jitter and throughput<strong>of</strong> UDP packets reported by the iperf server. Jitter is definedas the latency variation. The results are shown in Figure 5.The left two plots respectively show the throughputs <strong>of</strong> theproposed algorithm and the original algorithm in CSMA/CA.The right two plots illustrate the jitter performance <strong>of</strong> thesetwo algorithms. Two obvious observations are: 1) the proposedopportunistic access algorithm outperforms the originalone in both throughputs and jitter in general, because theopportunistic access spent much less time on back<strong>of</strong>f withsmaller contention windows than the original access whennodes were at bit rates higher than the basic rate, 2) althoughthe clients A and B have identical throughputs in the originalalgorithm as expected, the opportunistic access enables themwith different throughputs based on their channel conditionsand the aggregate network throughput is there<strong>of</strong> significantlyimproved, by more than 50% in the measured case.4) Ad-hoc Mode: We also conducted performance evaluationon an ad-hoc topology as shown by the placement <strong>of</strong>the circles in Figure 3. In our experiments, all nodes usedthe default routing protocol implemented in the module <strong>of</strong>MAC 80211 in the Linux kernel. MAC 80211 is the wirelessmanagement layer in the Linux kernel. Two traffic flows wentfrom C to D, and from B to E. C and D were so placedthat they cannot hear each other and their flow had to berouted by A. The hops from C to D had bit rate <strong>of</strong> 52 Mbpsand the hop from B to E was at 130 Mbps. As a result, theexperimental topology resulted in a two-hop mesh network.In the experiments, the iperf flows started at B and C at thesame time to transmit UDP traffic to D and E respectively.As in infrastructure topology, the jitter and throughput weremeasured.Figure 6 shows the measurement results. The left part <strong>of</strong>the figure illustrates the aggregate network throughputs <strong>of</strong> theproposed opportunistic access and the original algorithm inCSMA/CA. It shows about 30% improvement <strong>of</strong> the throughputin this specific case. The right two plots on the figuredepict the jitters <strong>of</strong> these two flows. As we can observe, whenthe opportunistic access was enabled, the jitter <strong>of</strong> flow C → Donly slightly increased, but that <strong>of</strong> flow B → E significantlyreduced because the channel condition <strong>of</strong> B → E was betterthan that <strong>of</strong> C → D and therefore transmitted more frequently.5) Impact <strong>of</strong> t w : As discussed in Section IV-C, the size<strong>of</strong> the weighted window, t w , has a significant impact on thenetwork performance. Actually, it determines the degree <strong>of</strong>opportunism in that if it is large, the contention metric willnot be updated until after a long period and then the userwith good channel conditions can opportunistically access thechannel for long. But this is at the cost <strong>of</strong> delaying the userswith poor conditions and may hurt real-time applications thatrequire small delay and jitters. We numerically evaluated theimpact <strong>of</strong> t w on the throughput and jitter in the infrastructure