Correlation between corona current and radio interference due to ...
Correlation between corona current and radio interference due to ...
Correlation between corona current and radio interference due to ...

Create successful ePaper yourself
Turn your PDF publications into a flip-book with our unique Google optimized e-Paper software.
<strong>Correlation</strong> <strong>between</strong> <strong>corona</strong> <strong>current</strong> <strong>and</strong> <strong>radio</strong> <strong>interference</strong> <strong>due</strong> <strong>to</strong> high voltageinsula<strong>to</strong>r stringSubba Reddy BSenior Member, IEEEDept. of Electrical Engg,Indian Institute of ScienceBangalore-560012, INDIAreddy@hve.iisc.ernet.inAbstract -- The Radio Interference (RI) from electric powertransmission line hardware, if not controlled, poses seriouselectromagnetic <strong>interference</strong> <strong>to</strong> system in the vicinity. Thepresent work mainly concerns with the RI from the insula<strong>to</strong>rstring along with the associated line hardware. The labora<strong>to</strong>rytesting for the RI levels are carried out through the measuremen<strong>to</strong>f the conducted <strong>radio</strong> <strong>interference</strong> levels. However suchmeasurements do not really locate the <strong>corona</strong>ting point, as wellas, the mode of <strong>corona</strong>. At the same time experience shows that itis rather difficult <strong>to</strong> locate the <strong>corona</strong>ting points by mereinspection. After a thorough look in<strong>to</strong> the intricacies of theproblem, it is ascertained that the measurement of associatedground end <strong>current</strong>s could give a better picture of the prevailing<strong>corona</strong> modes <strong>and</strong> their intensities. A study on the same isattempted in the present work. Various intricacies of theproblem, features of ground end <strong>current</strong> pulses <strong>and</strong> itscorrelation with RI are dealt with. Owing <strong>to</strong> the complexity ofsuch experimental investigations, the study made is not fullycomplete nevertheless it seems <strong>to</strong> be first of its kind.Index Terms--Radio <strong>interference</strong>, <strong>corona</strong>, high voltagetransmission, insula<strong>to</strong>rs, conduc<strong>to</strong>r hardware, <strong>corona</strong> <strong>current</strong>.I. INTRODUCTIONA. Sources of <strong>corona</strong> on line conduc<strong>to</strong>rs <strong>and</strong> hardwareThe local electric breakdown of air or the <strong>corona</strong> is quitecommon on the high voltage power transmission linehardware. The operating stress is ideally lower than the<strong>corona</strong> inception levels, however, <strong>due</strong> <strong>to</strong> some manufacturingdefects, damages caused during the transportation <strong>and</strong>installation, deposition of contaminants like dust particles orwater droplets etc. the local field can get significantlyintensified. As a result, the <strong>corona</strong> can occur on lineconduc<strong>to</strong>rs, nuts <strong>and</strong> bolts of the hardware, arcing horns,guard rings, suspension clamps, etc. Also, since theconduc<strong>to</strong>rs <strong>and</strong> tie-wires with the <strong>to</strong>ps of the insula<strong>to</strong>r; <strong>and</strong>the pins with the entire surface of the thread in the pin holes,do not make perfect electrical contacts, <strong>corona</strong> may occur inthe intervening air gaps.B, The generation mechanism of Radio noiseRadio noise in High Voltage transmission line is associatedwith the pulsating modes of <strong>corona</strong> discharges developing atthe line conduc<strong>to</strong>r <strong>and</strong> hardware, sparking resulting from poorelectrical contact <strong>and</strong> scintillations on the contaminatedinsula<strong>to</strong>r surfaces. The <strong>current</strong> pulse associated withUdaya KumarDept of Electrical EnggIndian Institute of ScienceBangalore- 560012, INDIAuday@hve.iisc.ernet.inDebasish NathDept. of Electrical EnggIndian Institute of ScienceBangalore-560012, INDIAnath@ee.iisc.ernet.inindividual <strong>corona</strong> discharges typically possess a rise timemeasurable in 10s of ns, which is followed by a slow tailmeasured in 100s of ns. A several discharges are produced inevery half cycle of the power frequency voltage <strong>and</strong> therecould be several sites producing <strong>corona</strong> <strong>and</strong> the noisegenerated has considerably wide frequency spectrum. The RIlevel is high in the broadcast frequency range (0.5-1.6MHz)<strong>and</strong> then decreases gradually at higher frequencies [1].Detailed studies of <strong>corona</strong> <strong>current</strong> characteristics have shownthat positive <strong>corona</strong> is the main source of <strong>radio</strong> noise fromtransmission line [1].C. Consequence of <strong>radio</strong> noise: The Radio Interference (RI)from electric power transmission line hardware, if notcontrolled, poses serious electromagnetic <strong>interference</strong> <strong>to</strong>system in the vicinity [2,3]. Also, in future, if the transmissionlines are <strong>to</strong> be employed for general communications, itbecomes imperative <strong>to</strong> limit the <strong>corona</strong> generatedelectromagnetic noise [4-6].With regard <strong>to</strong> the transmission lines, the sources of RI areboth line conduc<strong>to</strong>rs <strong>and</strong> the line hardware including theinsula<strong>to</strong>r strings [8]. The present work mainly concerns withthe insula<strong>to</strong>r string along with the associated line hardware.The existing st<strong>and</strong>ards have two tests pertaining <strong>to</strong> RI <strong>and</strong><strong>corona</strong>. First one involves measurement of conducted RIthrough suitable circuit configuration <strong>and</strong> a <strong>radio</strong> noise meter.The second one involves identification of onset a visual<strong>corona</strong>, which is relatively subjective.D. Associated st<strong>and</strong>ard: Hence, governing st<strong>and</strong>ards haveprefixed upper limits for <strong>radio</strong> <strong>interference</strong> levels fromdifferent components of high voltage transmission lines [2].For convenience, the labora<strong>to</strong>ry testing for the RI levels arecarried out through the measurement of the conducted <strong>radio</strong><strong>interference</strong> levels [2,7,12].E. Problem identificationThe RI measurement does not really locate the <strong>corona</strong>tingpoint, as well as, the modes of <strong>corona</strong>. At the same timeexperience shows that it is rather difficult <strong>to</strong> locate the<strong>corona</strong>ting points by mere inspection. The associatedgeometry involves both highly localized field intensificationpoints, as well as, relatively extended moderate fieldintensification points. This in turn leads <strong>to</strong> both point <strong>corona</strong><strong>and</strong> a diffuse <strong>corona</strong> <strong>to</strong> start with, which later transform in<strong>to</strong>
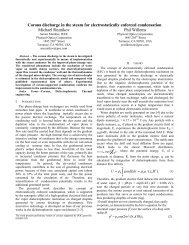
<strong>corona</strong> streamers at high field points. In other words, differentmodes of <strong>corona</strong> like burst, glow <strong>and</strong> streamer all will beonset as the test voltage is increased. After a thorough lookin<strong>to</strong> the intricacies of the problem, it is ascertained that themeasurement of associated ground end <strong>current</strong>s along with theresulting conducted noise could give a better picture of theprevailing <strong>corona</strong> modes <strong>and</strong> their intensities. This forms thebasic objective of the present work. It is worth mentioninghere that the literature addressing the above stated problem ishard <strong>to</strong> find <strong>and</strong> hence the present work can be considered asone of the first attempts in this area.II.PRESENT WORKIn the intended experimental approach, on theapplication of voltage <strong>to</strong> the insula<strong>to</strong>r string both resulting<strong>radio</strong> noise <strong>and</strong> ground end <strong>current</strong>s are <strong>to</strong> be measured. Withregard <strong>to</strong> the ground end <strong>current</strong> it can be convenientlymeasured indirectly by measuring the voltages.A. Details of experimental investigationsExperimental arrangement commonly used test circuits formeasuring <strong>radio</strong> <strong>interference</strong> are those recommended by IEC<strong>and</strong> NEMA. For the present work the IEC circuit shown inFigure 1 is employed. The main components of the circuit arehigh voltage source (50 Hz, 150 kV, 300 kVA transformerwith primary voltage of 230/440 V <strong>and</strong> with a ratedcontinuous <strong>current</strong> of 2A), low pass filter which can be tuned<strong>to</strong> the required frequency, high voltage bus end terminations,coupling capaci<strong>to</strong>r (0.00161 F realised by two units of0.00322 F of GE make connected in series), measuringimpedance (R1=265 , R2=50 <strong>and</strong> L=2.2 mH) <strong>and</strong> <strong>radio</strong>noise meter type SMV 11, VEB Messelektronik Berlin makeis used for the measurements. The input voltage <strong>to</strong> thetransformer is 400 V two phase ac. The testing arrangement isso designed <strong>to</strong> be simpler for operation <strong>and</strong> all the necessaryprecautions have been incorporated for proper safety <strong>and</strong>protection with essential tripping arrangements. The tes<strong>to</strong>bject consisted of 9-disc insula<strong>to</strong>rs(132kV system) <strong>and</strong> thetest voltage was 85kV.Fig. 1. RIV Measuring circuit as per IEC [2] augmented with ground end<strong>current</strong> measurementThe details of the parameters measured are as follows:B. Radio Interference MeasurementsThe International St<strong>and</strong>ard [2] specifies the procedure for a<strong>radio</strong> <strong>interference</strong> (RI) test carried out in a labora<strong>to</strong>ry onclean <strong>and</strong> dry insula<strong>to</strong>rs at a frequency of 0,5 MHz or 1 MHzor, alternatively, at other frequencies <strong>between</strong> 0.5 MHz <strong>and</strong> 2MHz. The frequencies of 0.5 or 1 Mhz are preferred because,usually the level of <strong>radio</strong> noise at this part of the spectrum <strong>and</strong>also because 1 MHz lies <strong>between</strong> the low <strong>and</strong> mediumfrequency <strong>radio</strong> broadcast b<strong>and</strong>s.As per the st<strong>and</strong>ard [2], the measuring apparatus, as per thespecification of CISPR 16-1, has been <strong>current</strong>ly used for theRI characteristics of insula<strong>to</strong>rs.The voltage is gradually applied in steps, <strong>to</strong> reach a valueof 90 kV (15% above phase voltage), held for at least fiveminutes, <strong>to</strong> allow RIV phenomenon <strong>to</strong> stabilize. Then, voltageis reduced slowly in steps. The <strong>radio</strong> noise generated by theinsula<strong>to</strong>r string is observed. Three such cycles are repeated,<strong>and</strong> RIV in dB (above 1 mV) at different voltages is recordedfor four insula<strong>to</strong>r strings. The experiments were repeated atleast five times <strong>to</strong> check for repeatability.C. Current MeasurementsThe <strong>corona</strong> <strong>current</strong> in principle is measurable at two endsof the string i.e. from high voltage end <strong>and</strong> from ground end.Of course, for very accurate measurements, optical link<strong>between</strong> measuring system <strong>and</strong> the oscilloscope would beessential. At present, <strong>due</strong> <strong>to</strong> the non-availability of such asystem at our labora<strong>to</strong>ry, conventional method is onlyemployed. The <strong>current</strong> is indirectly sensed by measuring thevoltage across a 50 Ω resis<strong>to</strong>r connected at the ground end. Itapplies <strong>to</strong> both the ground end lead of insula<strong>to</strong>r string, as wellas, the input <strong>to</strong> RIV meter as indicated in the figure. However,for safety purpose, in the ground end lead of insula<strong>to</strong>r string ahigh resistance 5 kΩ is also inserted. However, beforeproceeding further on measurement, the following needs <strong>to</strong> bediscussed.The <strong>corona</strong> <strong>current</strong> pulses are known <strong>to</strong> have short frontdurations measured in 10s of ns. As a consequence, theirpropagation characteristics would be more like waves onantenna rather than classical circuit domain pulses <strong>and</strong>further, their propagation is not governed by the appliedvoltages. A very similar situation prevails with themeasurement of partial discharge pulses in high voltagepower apparatus <strong>and</strong> cables. Therefore, the quantity measuredat any given point on the circuit need not be <strong>and</strong> will not bethe actual <strong>corona</strong> <strong>current</strong> pulse generated at the source.Nevertheless, owing <strong>to</strong> the linearity of the system for suchpulses, measured <strong>current</strong> should be directly related <strong>to</strong> the<strong>corona</strong> pulse at the generation point.Amongst the two possible <strong>current</strong> measurement points, theinvestigation is started with measuring the <strong>current</strong> at the input<strong>to</strong> RIV meter. The reasons for the same are as follows. Firstly,the reference value as per prevailing st<strong>and</strong>ards, the RIVmeasurement as per the prescribed circuit is the testingmethod <strong>and</strong> therefore, the <strong>current</strong> coupled through the RIVcoupling capaci<strong>to</strong>r governs the test result. Therefore, it wouldbe prudent first <strong>to</strong> consider this <strong>current</strong> <strong>and</strong> study whetherintended identification of <strong>corona</strong>ting source could be carried
out. Secondly, as mentioned before, the <strong>corona</strong> pulse willpropagate on ground lead in an antenna mode <strong>and</strong> henceseveral reflections <strong>and</strong> attenuation can be expected in the pathof the ground lead which has several bends <strong>and</strong> runs alongsupporting steel frame. It will therefore be quite involved <strong>to</strong>correlate the signal strength at the RIV input. Consideringthese, first the input <strong>to</strong> the RIV meter itself is considered forits characteristics.III. EXPERIMENTAL RESULTSA. Some observations on the waveshape of measured <strong>current</strong>Sample voltage waveforms at the RIV input is presented infigure 2. To verify whether a small surface abrasion such asbird droppings or collection of conducting dust cansignificantly alter the noise levels, a con<strong>to</strong>ur of GI wire isplaced firmly on the surface (using tape) around the capregion (with a physical contact <strong>to</strong> the cap). The results with<strong>and</strong> without this GI wire loop is categorized by with defect inthe figures. Due <strong>to</strong> the strong influence of local <strong>radio</strong>broadcasting stations <strong>and</strong> other communication <strong>to</strong>wers, therewas a consistent background noise measuring peak-<strong>to</strong>-peakamplitude of less than 10 – 20 millivolts. The same can beseen in figures 2 & 3. There are several types of waveformsthat could be seen, however, two kinds of waveforms werevery frequent. They have been shown in figure 2 as type 1 <strong>and</strong>2. The type1 waveform has initial high frequency oscillations(caused by the <strong>corona</strong> pulse initiated travelling waves on thesystem), which is followed by the lower frequencyoscillations. The excitation of the low frequency oscillationscan be attributed <strong>to</strong> the 1 MHz tuned filter at the source end<strong>and</strong> the coupling capaci<strong>to</strong>r of the RIV arm. The induc<strong>to</strong>r atthe low voltage arm of RIV part may not be participatingmuch <strong>due</strong> <strong>to</strong> the existence of parallel relatively low strengthresistive branch. The excitation of the low frequencyoscillation is expected <strong>due</strong> <strong>to</strong> a surface discharge on theinsula<strong>to</strong>r (porcelain disc <strong>and</strong> supporting insulating surface ofthe source side tuned filter).On the other h<strong>and</strong>, the type 2 waveform is attributed <strong>to</strong> theconduc<strong>to</strong>r <strong>to</strong> air type discharges, which on average is found <strong>to</strong>have lower magnitude <strong>and</strong> much shorter duration. Study isbeing continued <strong>to</strong> further ascertain the above identificationof the source.B. <strong>Correlation</strong> <strong>between</strong> the <strong>radio</strong> noise <strong>and</strong> averaged peakamplitude of <strong>corona</strong> generated <strong>current</strong>It is evident from the earlier sections that the actual <strong>corona</strong>generated pulse will be extremely difficult <strong>to</strong> be measured onany high voltage test system for RIV level. As explainedearlier, the <strong>corona</strong> pulse induces the waves in the system <strong>and</strong><strong>due</strong> <strong>to</strong> linearity of the system, possesses a direct correlationwith respect <strong>to</strong> the measurable <strong>current</strong> at the ground end. Theground end <strong>current</strong> waveforms at the RIV coupling capaci<strong>to</strong>r(measured through the voltage across a 50 Ω resis<strong>to</strong>r) <strong>and</strong>RIV levels are compared in table 1. It is worth noting herethat the amplitude of the waveforms at any voltage level is notthe fixed one. Measured peak <strong>to</strong> peak values vary from lowerlevel <strong>to</strong> higher levels. However, for the tabulation, only themost frequently observed values are given along with someinfrequent values at the higher end. There seems <strong>to</strong> be a goodcorrelation <strong>between</strong> the most frequent values <strong>and</strong> the RIVlevels.IV. SUMMARY AND CONCLUSIONSThe practical RI measurement does not really locate the<strong>corona</strong>ting point, as well as, the modes of <strong>corona</strong> on insula<strong>to</strong>rstring <strong>and</strong> associated hardware. This work proposed themeasurement of ground end <strong>current</strong>s <strong>to</strong> possibly aid theidentification of types of <strong>corona</strong> involved. The experimentalinvestigation carried out indicated the difficulties arising ou<strong>to</strong>f noise <strong>due</strong> <strong>to</strong> <strong>radio</strong> <strong>and</strong> communication signals, dis<strong>to</strong>rtion ofthe <strong>corona</strong> <strong>current</strong> pulse along the path <strong>to</strong> ground <strong>and</strong>existence of simultaneous sources of <strong>corona</strong> on the testspecimen. Based on the distinct features of ground end<strong>current</strong>s, an attempt is made <strong>to</strong> at least identify two kinds of<strong>corona</strong> sources. Also, a correlation is shown <strong>to</strong> exist <strong>between</strong>the most frequent peak <strong>to</strong> peak values of ground end <strong>current</strong>s<strong>and</strong> the <strong>radio</strong> <strong>interference</strong> levels. Even though the presentstudy made is not fully complete it is opined that it is first ofits kind.REFERENCES[1] Transmission line reference book 345kV <strong>and</strong> above, published byEPRI Palo Al<strong>to</strong>, CA 94304, 1979.[2] IEC 60437, Radio Interference test on high voltage insula<strong>to</strong>rs, 1997.[3] IEEE Std 539, IEEE st<strong>and</strong>ard definitions of terms relating <strong>to</strong> Corona<strong>and</strong> Field effects of overhead power lines, 1990.[4] Sharma Maruvada <strong>and</strong> Giao Trinhn, “ A basis for setting limits <strong>to</strong>Radio <strong>interference</strong> from high voltage transmission lines”, IEEE Transon PAS, Vol PAS 94, Sept/Oct 1975, pp 1714-1724.[5] P Sharma Maruvada, “ Electrostatic field effects from HV power linesin substations”, CIGRE session Paris, Aug 25 th – 2 nd Sept 1976.[6] E R Taylor, VL Chartier, DN Rice “Audible Noise <strong>and</strong> Visual Coronafrom HV <strong>and</strong> EHV Transmission Lines <strong>and</strong> Substation”, IEEETransactions on Power Apparatus <strong>and</strong> Systems, Vol. PAS 88, No.5,May1969, pp-666-679[7] IEEE Std 187, IEEE St<strong>and</strong>ard on Radio Receivers, 1990.[8] J Golinski et al, “Measurements of RIV on large EHV apparatus in HVlabora<strong>to</strong>ry”, IEEE Trans on PAS, Vol. PAS-98, No.3, May/June 1979,pp 817-822.[9] E.V. Atta, E.L. White, "Radio Interference from line insula<strong>to</strong>rs", TransAIEE, pp 1-5, 1930[10] Luigi Paris, Mario Sforzini, "RI problems in HV line design, IEEETransactions on Power Apparatus <strong>and</strong> Systems, Vol. PAS-87, No. 4,April 1968.[11] P. Sarma Maruvada, N. Giao Trinh, "A basis for setting limits <strong>to</strong> <strong>radio</strong><strong>interference</strong> from high voltage transmission lines", IEEE Transactionson Power Apparatus <strong>and</strong> Systems, Vol. PAS-94, No. 5,September/Oc<strong>to</strong>ber 1975.[12] IEEE Radio Noise Subcommittee Report – Working Group No. 3,"Radio noise design guide for high voltage transmission lines", IEEETransactions on Power Apparatus <strong>and</strong> Systems, Vol. PAS-90, No. 2,March/April 1971.[13] Soliman El Debeiky <strong>and</strong> Mohammad Khalifa, " Calculating the <strong>corona</strong>pulse characteristics <strong>and</strong> its <strong>radio</strong> ineterference", IEEE Trans on PASVol. PAS-90, No.1,pp 165-179, Jan/Feb 1971.
Table 1. Comparison of measured RIV levels <strong>and</strong> peak<strong>to</strong> peak voltage (<strong>current</strong> Χ 50 Ω) levelsVoltage RIV(dB)(kV)Most frequentlymeasured voltage levels(mV)p-pforwardbackwardLessfrequentlymeasuredvoltage levels(mV)p-p40** 19-20 10050 26-27 132-140 94-12260 31-31.5 134-146 136-180 15270 36-36.5 184-230 170-200 190-23075/76 37-37.5 238 180-236 260 – 30080 39-39.5 244 236-250 300+ - 400** This correspond <strong>to</strong> ambient noise, which exhibits some fluctuationsFig. 2(c) 90 kVtype 1 with defectFig.2(a) 80 kV type 1 with defectFig. 2(d) 85 kV type 1Fig.2(b) 85 kV type 1 with defectFig.2(e) 85 kV type 2 with defect
Fig.2(f) 90 kV type 2 with defectFig.3(a) 85 kV with defectFig.2(g) 85 kV type 2Fig.3(b) 90 kV with defectFigure 3. Sample measured voltage(<strong>current</strong> Χ 50 Ω) waveformsat the ground end lead of insula<strong>to</strong>r stringFig.2(h) 90 kV type 2Figure 2. Sample measured voltage (<strong>current</strong> Χ 50 Ω) waveformsat the input <strong>to</strong> the RIV meter