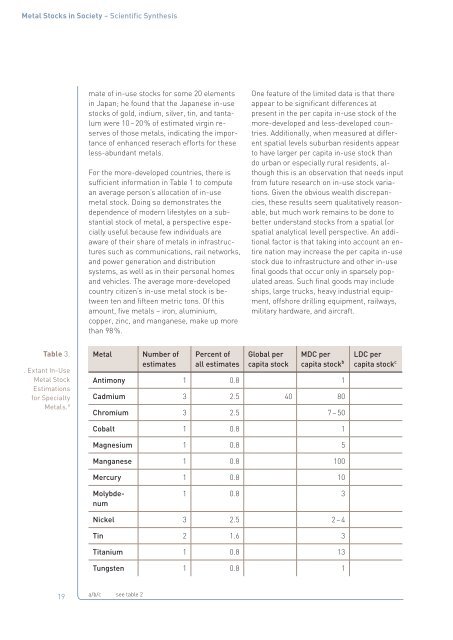
<strong>Metal</strong> <strong>Stocks</strong> <strong>in</strong> <strong>Society</strong> – <strong>Scientific</strong> <strong>Synthesis</strong>and one for the aggregate of all types of steel(a mixture that is roughly 95 % iron). Geographically,an overwhelm<strong>in</strong>g majority of theestimates concern more-developed countries.Ona global basis, top-down estimatesfor <strong>in</strong>-use stocks exist for only four of theseelements: alum<strong>in</strong>ium, copper, iron, and lead.The per capita stock of iron is largest, asbefits its high rate of flow <strong>in</strong>to use; alum<strong>in</strong>ium’sstock is slightly larger than that ofcopper, and that for lead is significantlylower. (Global values are generated by divid<strong>in</strong>gtotal estimated <strong>in</strong>-use stock by globalpopulation. The results should not be <strong>in</strong>terpretedas suggest<strong>in</strong>g equivalent per capita<strong>in</strong>-use stocks around the world; most stocksclearly reside <strong>in</strong> more-developed countries.)a bottom-up basis. The locales are diverse:Stockholm, Vienna, New Haven, Cape Town,Beij<strong>in</strong>g, and Sydney. There are still too fewbottom-up studies to evaluate the accuracy ofthis approach, although where comparisonsof results can be made, they appear reasonable.At the city level, it is possible to allocatethe stock on a spatial basis, and this hasbeen done for Cape Town and Sydney.Anthropogenic stock estimates exist for fiveprecious metals, as shown <strong>in</strong> Table 2; mostare for more developed countries. The exceptionis silver, for which a rather poorly documentedglobal estimate exists.Table 2.Extant In-Use<strong>Metal</strong> StockEstimationsfor Precious<strong>Metal</strong>s. a<strong>Metal</strong>Number ofestimatesPercent ofall estimatesGlobal percapita stockMDC percapita stock bGold 2 1.6 35 – 90Palladium 2 1.6 1 – 4Plat<strong>in</strong>um 2 1.6 1 – 3Rhodium 1 0.8 0.2Silver 2 1.6 110 13LDC percapita stock ca The years of the determ<strong>in</strong>ations <strong>in</strong> Tables 1 – 3 vary, but most are for the period 2000 – 2006. The units of per capita stock arekg of metal <strong>in</strong> most cases, but g of metal for cadmium, gold, mercury, palladium, plat<strong>in</strong>um, rhodium, and silver. The totalnumber of estimates is 124.b The more-developed countries (MDC) used <strong>in</strong> this calculation are Australia, Canada, the European Union EU15, Norway,Switzerland, Japan, New Zealand, and the United States (altogether about 860 million people <strong>in</strong> 2005).c The less-developed countries (LDC) used <strong>in</strong> this calculation consist of all countries except those <strong>in</strong> the “more-developed”category (altogether about 5620 million people <strong>in</strong> 2005).18Few stock estimates are available on a regionalbasis - only alum<strong>in</strong>ium for Europe,copper for North America and Europe, andsta<strong>in</strong>less steel for several. The stock evaluationsare all quite recent, and appear reasonablyreliable. On a country basis, data existfor Japan, USA, Australia, and several Europeancountries.Urban-level evaluations have been performedfor several metals and several cities, all onFor the “specialty metals” (those used <strong>in</strong>more modest quantities than the major eng<strong>in</strong>eer<strong>in</strong>gmetals, particular for unique physicalor chemical properties), Table 3 gives the anthropogenicstock estimates. Twelve differentmetals are listed, none with more than threedeterm<strong>in</strong>ations. The only global estimate <strong>in</strong>this group is for cadmium; it is seriously outof date and cannot be regarded with confidence.In a recent unpublished presentation,Halada (2008) described a top-down esti-
<strong>Metal</strong> <strong>Stocks</strong> <strong>in</strong> <strong>Society</strong> – <strong>Scientific</strong> <strong>Synthesis</strong>mate of <strong>in</strong>-use stocks for some 20 elements<strong>in</strong> Japan; he found that the Japanese <strong>in</strong>-usestocks of gold, <strong>in</strong>dium, silver, t<strong>in</strong>, and tantalumwere 10 – 20 % of estimated virg<strong>in</strong> reservesof those metals, <strong>in</strong>dicat<strong>in</strong>g the importanceof enhanced reserach efforts for theseless-abundant metals.For the more-developed countries, there issufficient <strong>in</strong>formation <strong>in</strong> Table 1 to computean average person’s allocation of <strong>in</strong>-usemetal stock. Do<strong>in</strong>g so demonstrates thedependence of modern lifestyles on a substantialstock of metal, a perspective especiallyuseful because few <strong>in</strong>dividuals areaware of their share of metals <strong>in</strong> <strong>in</strong>frastructuressuch as communications, rail networks,and power generation and distributionsystems, as well as <strong>in</strong> their personal homesand vehicles. The average more-developedcountry citizen’s <strong>in</strong>-use metal stock is betweenten and fifteen metric tons. Of thisamount, five metals – iron, alum<strong>in</strong>ium,copper, z<strong>in</strong>c, and manganese, make up morethan 98 %.One feature of the limited data is that thereappear to be significant differences atpresent <strong>in</strong> the per capita <strong>in</strong>-use stock of themore-developed and less-developed countries.Additionally, when measured at differentspatial levels suburban residents appearto have larger per capita <strong>in</strong>-use stock thando urban or especially rural residents, althoughthis is an observation that needs <strong>in</strong>putfrom future research on <strong>in</strong>-use stock variations.Given the obvious wealth discrepancies,these results seem qualitatively reasonable,but much work rema<strong>in</strong>s to be done tobetter understand stocks from a spatial (orspatial analytical level) perspective. An additionalfactor is that tak<strong>in</strong>g <strong>in</strong>to account an entirenation may <strong>in</strong>crease the per capita <strong>in</strong>-usestock due to <strong>in</strong>frastructure and other <strong>in</strong>-usef<strong>in</strong>al goods that occur only <strong>in</strong> sparsely populatedareas. Such f<strong>in</strong>al goods may <strong>in</strong>cludeships, large trucks, heavy <strong>in</strong>dustrial equipment,offshore drill<strong>in</strong>g equipment, railways,military hardware, and aircraft.Table 3.. Extant In-Use<strong>Metal</strong> StockEstimationsfor Specialty<strong>Metal</strong>s. a<strong>Metal</strong>Number ofestimatesPercent ofall estimatesGlobal percapita stockMDC percapita stock bAntimony 1 0.8 1Cadmium 3 2.5 40 80Chromium 3 2.5 7 – 50Cobalt 1 0.8 1Magnesium 1 0.8 5Manganese 1 0.8 100Mercury 1 0.8 10LDC percapita stock cMolybdenum1 0.8 3Nickel 3 2.5 2 – 4T<strong>in</strong> 2 1.6 3Titanium 1 0.8 13Tungsten 1 0.8 119a/b/c see table 2