Estimation of Groundwater Recharge under various land ... - RMZ
Estimation of Groundwater Recharge under various land ... - RMZ
Estimation of Groundwater Recharge under various land ... - RMZ
Create successful ePaper yourself
Turn your PDF publications into a flip-book with our unique Google optimized e-Paper software.
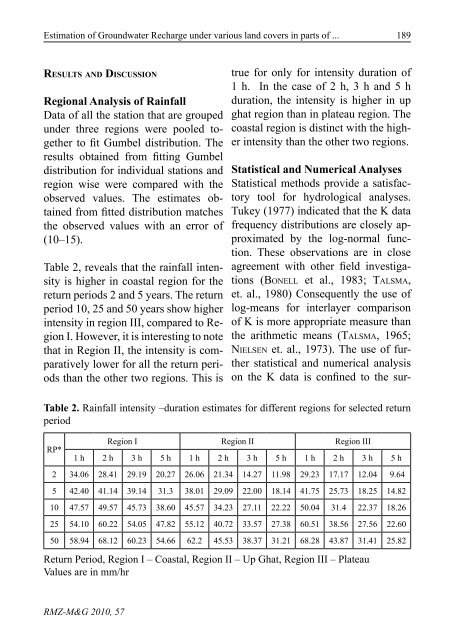
<strong>Estimation</strong> <strong>of</strong> <strong>Groundwater</strong> <strong>Recharge</strong> <strong>under</strong> <strong>various</strong> <strong>land</strong> covers in parts <strong>of</strong> ...189Results and DiscussionRegional Analysis <strong>of</strong> RainfallData <strong>of</strong> all the station that are grouped<strong>under</strong> three regions were pooled togetherto fit Gumbel distribution. Theresults obtained from fitting Gumbeldistribution for individual stations andregion wise were compared with theobserved values. The estimates obtainedfrom fitted distribution matchesthe observed values with an error <strong>of</strong>(10–15).Table 2, reveals that the rainfall intensityis higher in coastal region for thereturn periods 2 and 5 years. The returnperiod 10, 25 and 50 years show higherintensity in region III, compared to RegionI. However, it is interesting to notethat in Region II, the intensity is comparativelylower for all the return periodsthan the other two regions. This istrue for only for intensity duration <strong>of</strong>1 h. In the case <strong>of</strong> 2 h, 3 h and 5 hduration, the intensity is higher in upghat region than in plateau region. Thecoastal region is distinct with the higherintensity than the other two regions.Statistical and Numerical AnalysesStatistical methods provide a satisfactorytool for hydrological analyses.Tukey (1977) indicated that the K datafrequency distributions are closely approximatedby the log-normal function.These observations are in closeagreement with other field investigations(Bonell et al., 1983; Talsma,et. al., 1980) Consequently the use <strong>of</strong>log-means for interlayer comparison<strong>of</strong> K is more appropriate measure thanthe arithmetic means (Talsma, 1965;Nielsen et. al., 1973). The use <strong>of</strong> furtherstatistical and numerical analysison the K data is confined to the sur-Table 2. Rainfall intensity –duration estimates for different regions for selected returnperiodRP*Region I Region II Region III1 h 2 h 3 h 5 h 1 h 2 h 3 h 5 h 1 h 2 h 3 h 5 h2 34.06 28.41 29.19 20.27 26.06 21.34 14.27 11.98 29.23 17.17 12.04 9.645 42.40 41.14 39.14 31.3 38.01 29.09 22.00 18.14 41.75 25.73 18.25 14.8210 47.57 49.57 45.73 38.60 45.57 34.23 27.11 22.22 50.04 31.4 22.37 18.2625 54.10 60.22 54.05 47.82 55.12 40.72 33.57 27.38 60.51 38.56 27.56 22.6050 58.94 68.12 60.23 54.66 62.2 45.53 38.37 31.21 68.28 43.87 31.41 25.82Return Period, Region I – Coastal, Region II – Up Ghat, Region III – PlateauValues are in mm/hr<strong>RMZ</strong>-M&G 2010, 57


