benefits and challengers (A/Prof Simon Goldsworthy, SARDI) - MISA
benefits and challengers (A/Prof Simon Goldsworthy, SARDI) - MISA
benefits and challengers (A/Prof Simon Goldsworthy, SARDI) - MISA
Create successful ePaper yourself
Turn your PDF publications into a flip-book with our unique Google optimized e-Paper software.
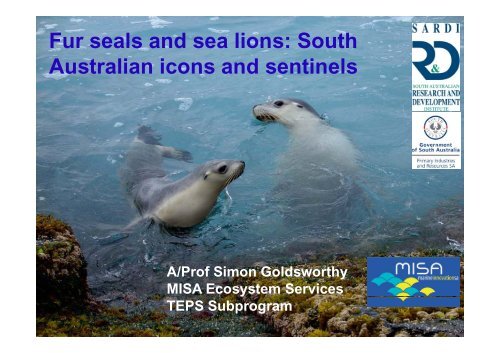
Fur seals <strong>and</strong> sea lions: SouthAustralian icons <strong>and</strong> sentinelsA/<strong>Prof</strong> <strong>Simon</strong> <strong>Goldsworthy</strong><strong>MISA</strong> Ecosystem ServicesTEPS Subprogram
The Australian sea lion: an overview1. Australia's seal heartl<strong>and</strong>2. Bycatch assessment <strong>and</strong> mitigation3. Habitat modelling <strong>and</strong> foraging strategies4. Biological sentinels to map change in our oceans
SA – Australia’s Seal Heartl<strong>and</strong>Australian fur sealAustraliansea lionRecentlycolonised>85%0 500 1,000New Zeal<strong>and</strong>fur sealkilometres >85%
Post-sealing recovery …or not?New Zeal<strong>and</strong> fur seal:~19,000 pups born annually3.5 fold increase in last 25 yearsPopulation size~ 85-90,000Australian sea lion:~3,000 pups per breeding seasonNot recovering, stable or declining populationPopulation size ~ 11,900 (Threatened Species)
1. Bycatch assessment, mitigation <strong>and</strong> managementCommonwealth Managed (AFMA)Demersal gillnet shark fisheryFishing effort 2006-2009Average effort ~100,000 km.hrs/yrASL foraging densityCircumstantial evidence that lack ofrecovery/decline in sea lions was dueto bycatch in gillnet fisheriesModelling of foraging effort identifiedconsiderable spatial overlap withfishing effort~1.62 million seal days/yrPhoto D Hamer
1. Bycatch assessment, mitigation <strong>and</strong> managementObserved net haulObserved net haul with ASL bycatch mortalityASL colonyBycatcheffortper unit of fishingProbability of encountering sealsIndependent observer data• Feb 2006- Jan 2008• 234 net-hauls (2.4% fishingeffort)• bycatch • 789 km mortality net-setrates highly correlated with estimated ASL foraging density• provides • 12 ASL a mortalities tool to estimate bycatch from any distribution of fishing effort• bycatch • 0.013 ASL/km of individuals net-set (females <strong>and</strong> males) can be apportioned back toindividual • 2 l<strong>and</strong>ed, subpopulations10 (83%) drop-outsZero Low Medium High
1. Bycatch assessment, mitigation <strong>and</strong> managementProvided estimates of impact on sea lion populationsBycatch levels unsustainable 270- 500 sea lion mortalities per 18 month breeding cycleProvided range of mitigation options <strong>and</strong> estimates of their effectivenessFishery closures based on core foraging areas, distance<strong>and</strong> depth rangesAdvised on <strong>and</strong> assessed management strategiesIndependent observer program, closurestrategies, bycatch trigger limits,assessment <strong>and</strong> monitoringOutcomes: major reduction in fishingeffort <strong>and</strong> sea lion bycatch mortality
2. Habitat modelling, foraging strategiesGPS tracks form 7 ASL females –Nuyts ArchipelagoFatsLoc GPS tagsMore data, higher precisionEnable finer scale habitat analyses
Crittercam data in has been used to map benthichabitats as part of marine planning processProvide alternate predator perspective of habitatquality vs. anthropocentric approaches
3. Biological sentinels to map change Australia’s ocean environment>500 deploymentson 7 speciesGAB has highest density ofpelagic predators inAustralia’s s coastal waters• What are the key physical oceanographic features that underpin the distribution, foraginglocations, movements <strong>and</strong> migratory patterns of apex predators?• How do foraging distributions <strong>and</strong> movements of different apex predator species respond tochange in the ocean environment?
3. Biological sentinels to map change Australia’s ocean environment• animal borne sensors interactwith both physical <strong>and</strong> biologicaloceanographic features• add observational power at places<strong>and</strong> times not possible with otherplatforms• they directly target ecologicallyimportant regions where informationof oceanography is most needed• can collect physical data at anunprecedented temporal <strong>and</strong>spatial scaleMonitoring of spatial <strong>and</strong> temporal extent ofupwelling in eastern GAB
AcknowledgmentsObservations – future directionsBrad PagePaul RogersInteractions between apex predatorsAndrew Lowther<strong>and</strong> their environment provide aCharlie Huveneersunique means to underst<strong>and</strong> the keyPeter ee Shaughnessyecological <strong>and</strong> oceanographic<strong>MISA</strong>processes that underpin our uniqueFisheries Research & Development CorporationAustralian Marine Mammal Centre (DSEWPC)marine ecosystemsDepartment t of Environment, Water, Natural ResourcesPIRSA Fisheries <strong>and</strong> AquacultureDevelopments in biologging technology willAFMAmean that marine animals will increasingly gyIMOSbe mapping <strong>and</strong> monitoring our marineSA Seafood Industryecosystems for usSA MuseumUniversity of AdelaideFlinders UniversityitUniversity of TasmaniaMacquarie UniversitySea World Research <strong>and</strong> Rescue FoundationAustralian Antarctic DivisionSA Nature Foundation


