Shades of Green - RAC Foundation
Shades of Green - RAC Foundation
Shades of Green - RAC Foundation
- No tags were found...

You also want an ePaper? Increase the reach of your titles
YUMPU automatically turns print PDFs into web optimized ePapers that Google loves.
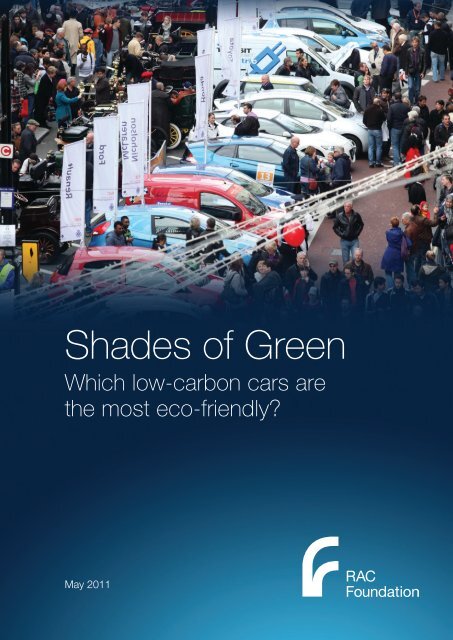
<strong>Shades</strong> <strong>of</strong> <strong>Green</strong>Which low-carbon cars arethe most eco-friendly?May 2011
iForewordThe Royal Automobile Club’s <strong>RAC</strong> Brighton to London Future Car Challenge was unique.It showcased scores <strong>of</strong> the most advanced green vehicles in front <strong>of</strong>hundreds <strong>of</strong> thousands <strong>of</strong> eager spectators – the very people who mustbuy the cars on display if there is to be a green transport revolution. If theevent achieved only one thing, it was to demonstrate that determininghow drivers can realistically do their bit to save the planet is a complexmatter. There is no simple answer, in part because we have yet toadequately define the question.Is the most eco-friendly car the one which uses the least energy, or the one generatingfewest CO 2emissions? Should environmental impact be considered solely in relation toeach journey a vehicle makes? What about the manufacture and distribution <strong>of</strong> fuel?This report graphically illustrates how the green credentials <strong>of</strong> cars alter significantlydepending on which angle you view them from.For all <strong>of</strong> us who run a car this is not an academic exercise. Over the coming decades themake-up <strong>of</strong> the vehicle parc will change dramatically as manufacturers encourage us tobuy their latest electric, hybrid or hydrogen-powered cars on the basis <strong>of</strong> theirenvironmental performance.Since the beginning <strong>of</strong> this year the Government has been <strong>of</strong>fering grants <strong>of</strong> up to £5,000for those early adopters who are ready to take the plunge and commit to buying anultra-green car – that which produces 75 gCO 2/km or less.For these pioneers there is plainly a lot to consider. Cutting through the jargon – CO 2equivalents, tank-to-wheel, well-to-wheel – is only part <strong>of</strong> the problem. Even once adriver has made a theoretical choice, he or she is then likely to be confronted with the notinsignificant practical problem <strong>of</strong> how to afford the object <strong>of</strong> their desire: while green carsmight be cheap to run, many are anything but cheap to buy.What happens when an owner finally wants to swap his now not-so-young automobilefor something new? How will the used-car market price what is very much unproventechnology? The questions are legion, but this report – and the event its launch coincideswith – goes some way first to better defining them, and then answering them.One thing is clear: when it comes to environmentally friendly vehicles, there’s green andthen there’s green.David QuarmbyChairman, <strong>RAC</strong> <strong>Foundation</strong>
The inaugural <strong>RAC</strong>Future Car Challengetook place on 6 November 2010over a 57-mile route.BLondonABrighton1The event showcased 63 <strong>of</strong> the greenest vehicles on the road.50 <strong>of</strong> the entrants allowed the organisers to collect data to analysewho used the least energy to complete the journey.Entries were divided into three groups according to the power train:1. pure electric2. hybrids, including plug-ins, and hydrogen fuel cells3. internal combustion engines emitting no more than 110 gCO 2/kmMeasured in megajoules per kilometre on a tank-to-wheel basis, on average:• Electric vehicles used 0.61MJ/km• Hybrids used 1.16 MJ/km• Diesels used 1.74 MJ/km• The only petrol vehicle used 0.91 MJ/km• And the only hydrogen fuel cell vehicle used 1.23 MJ/km• In miles per gallon (petrol equivalent) this equates to 147 mpg for electric cars, 83mpg for hybrids, 65 mpg for diesels, 95 mpg for the sole petrol car and 71 mpg forthe hydrogen vehicleDriving style, and vehicle and passenger weight, had a considerable impact on fuelconsumption. Where the same make and model <strong>of</strong> vehicle was entered more than once,consumption ranged from 65 and 126 mpg for one <strong>of</strong> the hybrid models, and between 38and 76 mpg for one <strong>of</strong> the diesel vehiclesUnsurprisingly electric and hydrogen vehicles performed best in CO 2emission terms whenmeasured on a tank-to-wheel basis, emitting zero carbon dioxideBut on a well-to-wheel measurement, things were rather different. On average:• Hybrids emitted 103 gCO 2/km• Electric vehicles emitted 105 gCO 2/km• Diesel internal combustion engines emitted 147 gCO 2/km• The petrol internal combustion engines emitted 81 gCO 2/km• The hydrogen fuel cell vehicle emitted 112 gCO 2/kmThe eco-credentials <strong>of</strong> electric cars depend on when they are charged. At night electricityis greener than during the day when more fossil fuels are burnedThe observed levels <strong>of</strong> carbon emissions from the exhausts <strong>of</strong> the internal combustionengine vehicles were on average a quarter higher than European drive cycle figuresFuel costs for the Challenge ranged between £1.44 and £7.42, with electric vehicles thecheapest to run
2<strong>Shades</strong> <strong>of</strong> <strong>Green</strong> - Which low-carbon cars are the most eco-friendly?The RunIn its first year, the <strong>RAC</strong> Future Car Challenge attracted 63 entries from a wide range <strong>of</strong>manufacturers – from large to small volume as well as niche manufacturers. The vehicleswere divided into three categories and in several cases there was more than one instance <strong>of</strong>a particular model in a given category:Table 1: Power train typesPower trainNumber <strong>of</strong> vehicles(analysed: see section below)Category 1 Pure electric vehicles 21 (16)Category 2Hybrid, plug-in hybrid, extended-rangeand hydrogen fuel cell vehicles26 (20)Category 3 Pure internal combustion engine (ICE) vehicles 16 (14)Entrants had to agree to a set <strong>of</strong> regulations covering technical and competitionrequirements. All vehicles had to be road-legal, and vehicles in Category 3 were notpermitted to exceed a maximum <strong>of</strong> 110 gCO 2/km as measured by the <strong>of</strong>ficial Europeandrive cycle. As for the competition, the organisers stipulated a minimum and maximum timefor completing the course, and a half-way stop at Crawley.Measuring energy consumptionEntrants wishing to take part in the competition for the most efficient vehicle prize hadto agree to have their vehicle measured for energy consumption – this paper analyses 50entries. The energy consumption was measured as follows. 1The electric vehicles were fitted with a data logger situated between the battery pack andthe electric motor which measured electricity use in kilowatt-hours (kWh). Although it wouldhave been desirable to charge the vehicles to 100% battery capacity at the start and againat the finish for technical reasons concerned with accuracy <strong>of</strong> measurement; this waslogistically impossible because <strong>of</strong> long charging times (up to five hours for this particularrun) and the fact that the results were required immediately to determine the winner.Hybrids and ICE vehicles were topped up to 100% with fuel at the start and finish todetermine exactly how much was used during the run; an uncertainty factor was includedto account for inaccuracies due to the refuelling process. 1 In addition to being refuelled,the plug-in hybrids were also fitted with data loggers as they are able to run exclusivelyon electricity for a considerable distance. The only hydrogen fuel cell vehicle that wasmeasured had a fuel consumption display on the dashboard which indicated kilograms <strong>of</strong>hydrogen used for the trip.
<strong>Shades</strong> <strong>of</strong> <strong>Green</strong> - Which low-carbon cars are the most eco-friendly? 3Energy ConsumptionTo make a like-for-like comparison, energy consumption has to be expressed in a consistentmetric: the chosen denominator is megajoules per kilometre (MJ/km) which can be easilyconverted into miles per gallon (mpg) petrol equivalent for ease <strong>of</strong> understanding.Figure 1: Energy consumption per vehicle2.52MJ/km1.510.50Electric Hybrid Petrol Hydrogen DieselFigure 1 shows a clear picture: electric vehicles used the least amount <strong>of</strong> energy (averaging147 mpg petrol equivalent), while hybrids made up the mid range (averaging 83 mpg)and diesel vehicles used the most (averaging 65 mpg), although there is some overlap,especially between the latter two categories. The average fuel economy <strong>of</strong> all vehicles was80 mpg petrol equivalent. The only petrol-powered ICE car achieved 95 mpg, performingbetter than average and in fact also better than most hybrids thanks to its weight, while theonly hydrogen fuel cell vehicle used 71 mpg petrol equivalent. To put this in perspective:the average UK car uses around 40 mpg and the average new car achieves 50 mpg. 2 Thefindings confirm expectations that the larger the degree <strong>of</strong> power train electrification, themore energy-efficient the vehicle.It is noticeable that the figures vary by a factor <strong>of</strong> 5, with the most efficient vehicle achieving182 mpg petrol equivalent and the least efficient achieving 36 mpg. Even within thecategories, consumption varied by a factor <strong>of</strong> 3 for hybrids, 2.6 for ICE vehicles and 2 forelectric vehicles.Although the variations can be explained by differences in enginetechnology, design and weight, driving style had a considerable impacton fuel economy. In the hybrid vehicle category, for example, fuelconsumption varied between 65 and 126 mpg for one <strong>of</strong> themodels, and between 59 and 113 mpg for one <strong>of</strong> the others.In the ICE category, it varied between 38 and 76 mpg forone <strong>of</strong> the models, and in the electric vehicle category thevariation was less marked at between 116 and 124 mpgpetrol equivalent.
4<strong>Shades</strong> <strong>of</strong> <strong>Green</strong> - Which low-carbon cars are the most eco-friendly?CostsFigure 2, which displays the fuel costs per vehicle for the run, shows a significant variation<strong>of</strong> between £1.44 and £7.42, and also reveals that electric vehicles were the cheapest torun, mainly because there is no tax on electricity. In the hybrid category, fuel costs varied byas much as £2.43 for one particular model, illustrating one <strong>of</strong> the benefits <strong>of</strong> ‘eco-driving’,i.e. steady acceleration and deceleration, early gear shifts, and so on.Figure 2: Total fuel costs per vehicle for the run (November 2010 prices)87Total costs (£)6543210Electric Hybrid Petrol DieselNote: the assumptions are £1.19 per litre <strong>of</strong> petrol, £1.22 per litre <strong>of</strong> diesel and £0.13 per kWh<strong>of</strong> electricity. 3,4 Costs were not estimated for the fuel cell vehicle because there is currently noestablished price for hydrogen.CO 2EmissionsIn order to obtain CO 2emission figures, the energy consumption results had to beconverted using certain factors, as the CO 2intensity <strong>of</strong> one unit <strong>of</strong> energy varies betweenthe different fuel types (electricity, petrol, diesel and hydrogen).Before converting the figures, however, it is necessary to distinguish between emissions fromthe exhaust – ‘tank-to-wheel’ emissions – and emissions over the life cycle – ‘well-to-wheel’emissions. The latter comprise tank-to-wheel emissions plus ‘well-to-tank’ (or ‘indirect’)emissions which are defined as ‘those… emitted prior to the use <strong>of</strong> a fuel/energy carrier (orin the case <strong>of</strong> electricity, prior to the point <strong>of</strong> generation), i.e. as a result <strong>of</strong> extracting andtransforming the primary energy source (e.g. crude oil) into the energy carrier (e.g. petrol)’ 5 :Well-to-Tank + Tank-to-Wheel = Well-to-WheelAn even more comprehensive analysis would take account <strong>of</strong> ‘embedded’ emissions arisingfrom vehicle production and scrappage, but this was beyond the scope <strong>of</strong> this analysis asthe data is not readily available.The rationale behind this distinction is that while an analysis <strong>of</strong> well-to-wheel emissionsis crucial for understanding a vehicle’s impact on global warming, a consideration <strong>of</strong>
<strong>Shades</strong> <strong>of</strong> <strong>Green</strong> - Which low-carbon cars are the most eco-friendly? 5only tank-to-wheel emissions highlights the <strong>of</strong>ten-ignored issue <strong>of</strong> local air quality. Roadvehicles, particularly diesels, are the main emitters <strong>of</strong> pollutants in urban areas, and areestimated to cause 50,000 premature deaths per year. In fact, the UK could face sanctions<strong>of</strong> the order <strong>of</strong> £300 million from the EU for continuously breaching its national air qualitytargets. 6 This is a clear benefit <strong>of</strong> electric vehicles, which have zero emissions at theexhaust, and hydrogen fuel cells which emit only water vapour.Tank-to-wheel CO 2emissionsAs electric vehicles have no emissions at the exhaust, and hydrogen fuel cell vehiclesemit merely water vapour, tank-to-wheel emissions only have to be calculated for all thevehicles that used petrol or diesel, i.e. all ICE vehicles and hybrids. The conversion isstraightforward, as petrol and diesel have a specific volumetric energy content and CO 2intensity, so emissions can be calculated directly from the amount <strong>of</strong> energy used. While theformer was provided by the fuel supplier, <strong>of</strong>ficial government estimates were used for theCO 2intensity per litre 5 :Table 2: Tank-to-wheel CO 2conversion factorsCO 2emissions (g/MJ)Petrol 74.7Diesel 70.3AssumptionCalorific value <strong>of</strong> 30.8 MJ/litre and CO 2emissions <strong>of</strong>2.30 kgCO 2/litreCalorific value <strong>of</strong> 37.6 MJ/litre and CO 2emissions <strong>of</strong>2.64 kgCO 2/litreUsing these factors gives the following results: hybrids, averaging 87 gCO 2/km, performedbetter than ICE vehicles, which on average emitted 120 gCO 2/km. Most hybrids emitted lessthan 75 gCO 2/km, some <strong>of</strong> them even as little as 50 gCO 2/km. The only petrol ICE vehicleentry emitted 68 gCO 2/km, 22% less than the average hybrid.Figure 3: Tank-to-wheel CO 2emissionsgCO 2/km180160140120100806040200Hybrid Petrol DieselTwo points are noteworthy: the variation in emissions performance between different vehicletechnologies within the same category, and the divergence between <strong>of</strong>ficially measured and
6<strong>Shades</strong> <strong>of</strong> <strong>Green</strong> - Which low-carbon cars are the most eco-friendly?actual emissions. Whereas the variation between the different models in the ICE vehiclecategory is over tw<strong>of</strong>old, the variation within the hybrid category is as high as threefoldbetween the different models. This confirms one <strong>of</strong> the King Review’s findings that buyingbest-in-class vehicle models can reduce emissions by 25% compared to the class average 7– in this case even more.The second point is that although the entry regulations specified a maximum <strong>of</strong> 110 gCO 2/km for ICE vehicles as measured by the <strong>of</strong>ficial European drive cycle (indicated by thedotted blue line in Figure 3), 9 out <strong>of</strong> 14 entries actually exceeded this threshold despite thefact that the nature <strong>of</strong> the event encouraged eco-driving. Equally, some <strong>of</strong> the ICE vehiclesand in fact the majority <strong>of</strong> hybrids performed better than was <strong>of</strong>ficially claimed.Well-to-wheel CO 2emissionsIn the case <strong>of</strong> electric vehicles, well-to-wheel emissions depend on the assumptions madeabout ‘grid carbon intensity’ – this refers to the CO 2content <strong>of</strong> one unit <strong>of</strong> electricity fromthe plug commonly measured in grams <strong>of</strong> CO 2equivalents per kWh (gCO 2e/kWh). Themeasure is expressed in CO 2equivalents as it not only takes into account CO 2emissionsbut also methane and nitrous oxide, weighted according to their global warming potential. 5The difficulty arises because grid carbon intensity varies: during the day it is high sinceelectricity is produced from more abundant and carbon-intensive resources such as gasand coal to meet higher demand, while at night it is less carbon-intensive because lowerdemand means that a greater proportion <strong>of</strong> supply can be met by electricity generated fromnuclear baseload. 8There is also the issue <strong>of</strong> whether to use an average emissions factor (AEF) or marginalemissions factor (MEF). The AEF takes into account the average electricity mix andassociated emissions over a longer period <strong>of</strong> time. It typically fluctuates between 470 gCO 2/kWh at night and 550 gCO 2/kWh during the day 9,10 ; the Government uses a rolling average<strong>of</strong> 542 gCO 2/kWh. 5 The MEF, on the other hand, captures the emissions from the ‘marginal’power plant. The rationale is that rather than looking at the average, it is necessary to takeinto account the emissions from generating the extra electricity that is specifically used foran additional load. Currently the MEF is around 690 gCO 2/kWh 8 ; it is higher than the AEFbecause peak demand is met through the use <strong>of</strong> more abundant, carbon-intensive sourcessuch as coal and gas. This paper will not argue the case for one over theother – instead, it will illustrate the implications<strong>of</strong> assuming different factors at differenttimes <strong>of</strong> day.Indirect emissions add 75gCO 2e/kWh to the rollingaverage <strong>of</strong> 542 gCO 2/kWh, giving a figure <strong>of</strong> 617gCO 2e/kWh for electricity,adding also around 20% tothe petrol and diesel factorsused to calculate tank-towheelemissions5,11 :
<strong>Shades</strong> <strong>of</strong> <strong>Green</strong> - Which low-carbon cars are the most eco-friendly? 7Table 3: Well-to-wheel CO 2conversion factorsCO 2emissions (g/MJ)Petrol 88.7Diesel 84.5AssumptionCalorific value <strong>of</strong> 30.8 MJ/litre and CO 2emissions <strong>of</strong>2.73 kgCO 2e/litre 5Calorific value <strong>of</strong> 37.6 MJ/litre and CO 2emissions <strong>of</strong>3.18 kgCO 2e/litre 5Electricity 171.4 2008 UK grid rolling average <strong>of</strong> 617 gCO 2e/kWh 5Hydrogen 91.7Calorific value <strong>of</strong> 120 MJ/kg, produced from steamreformednatural gas 1Using these <strong>of</strong>ficial conversion factors means that hybrids performed best, ranging from61 to 190 gCO 2e/km, averaging 103 gCO 2e/km. Electric vehicles made up the mid range,with emissions ranging from 82 to 173 gCO 2e/km and having an average <strong>of</strong> 105 gCO 2e/km. Emissions <strong>of</strong> diesel ICEs varied between 95 and 203 gCO 2e/km, with an average <strong>of</strong>147 gCO 2e/km. The petrol ICE entry emitted 81 gCO 2e/km, whereas the hydrogen fuel cellvehicle emitted 112 gCO 2e/km.Figure 4: Well-to-wheel CO 2e emissions using government conversion factors200gCO 2e/km150100500Electric Hybrid Petrol Hydrogen DieselFigure 5 shows the ‘worst case scenario’ for electric vehicles today – assuming that theyare charged at peak hours, i.e. the early evening, at which time grid carbon intensity isassumed to be 690 gCO 2/kWh (MEF). Figure 6, on the other hand, illustrates the ‘best casescenario’ in which electric vehicles are charged at night using lower carbon electricity, whengrid carbon intensity is 470 gCO 2/kWh (AEF). The results differ significantly and illustrate theimportance <strong>of</strong> encouraging charging at night – which is most likely to be done at home –through the use <strong>of</strong> tariffs which maximise CO 2reduction and minimise fuel costs because <strong>of</strong>cheaper electricity.
AcknowledgementsThis report has been prepared by Luca Lytton, Research Analyst at the <strong>RAC</strong> <strong>Foundation</strong>.The author would like to thank <strong>RAC</strong> <strong>Foundation</strong> colleagues, Chris Walsh from Cenex and DrDavid Howey from Imperial College London for their valuable comments.References<strong>Shades</strong> <strong>of</strong> <strong>Green</strong> - Which low-carbon cars are the most eco-friendly? 91Howey, D. A., Martinez-Botas, R. M., Cussons, B. & Lytton, L. (2011). Comparativemeasurements <strong>of</strong> the energy consumption <strong>of</strong> 50 electric, hybrid and internal combustionengine vehicles. Transportation Research D, forthcoming.2SMMT (2011). New Car CO 2Report 2011. London: Society <strong>of</strong> Motor Manufacturers andTraders.3DECC (2011). Quarterly energy prices table 2.2.3: Average annual domestic electricity billsfor selected towns and cities in the UK and average unit cost. Retrieved 25 March 2011from http://www.decc.gov.uk/media/viewfile.ashx?filepath=statistics/source/prices/qep223.xls&filetype=4&minwidth=true.4DECC (2011). Weekly fuel prices. Retrieved 25 March 2011 from http://www.decc.gov.uk/publications/basket.aspx?filepath=statistics%2fsource%2fprices%2fweeklyfuel.xls&filetype=4&minwidth=true.5AEA Technology (2010). 2010 Guidelines to Defra / DECC’s GHG Conversion Factors forCompany Reporting. Retrieved 16 March 2011 from http://www.defra.gov.uk/environment/business/reporting/pdf/100805-guidelines-ghg-conversion-factors.pdf.6Environmental Audit Committee (2010). Air Quality: Fifth report <strong>of</strong> session 2009–10.Volume I. London: The Stationary Office.7HM Treasury (2007). The King Review <strong>of</strong> low-carbon cars – Part I: the potential for CO 2reduction. London: The Stationary Office.8Hawkes, A. D. (2010). Estimating marginal CO 2emissions rates for national electricitysystems. Energy Policy, 38(10): 5977-5987.9ecotricity (2011). UK Grid LIVE. Retrieved 25 March 2011 fromhttp://www.ecotricity.co.uk/our-green-energy/energy-independence/uk-grid-live.10Realtimecarbon (2011). Real Time Carbon. Retrieved 25 March 2011 fromrealtimecarbon.org.11Arup & Cenex (2008). Investigation into the Scope for the Transport Sector to Switch toElectric Vehicles and Plug-in Hybrid Vehicles. Retrieved 16 March 2011 from http://www.berr.gov.uk/files/file48653.pdf.12HM Government (2009). The UK Low Carbon Transition Plan: National strategy for climateand energy. London: The Stationary Office.The Royal Automobile Club <strong>Foundation</strong> for Motoring Limited is a charity which explores theeconomic, mobility, safety and environmental issues relating to roads and responsible roadusers. Independent and authoritative research, carried out for the public benefit, is centralto the <strong>Foundation</strong>’s activities.