Document - FAVV
Document - FAVV
Document - FAVV
- No tags were found...

Create successful ePaper yourself
Turn your PDF publications into a flip-book with our unique Google optimized e-Paper software.
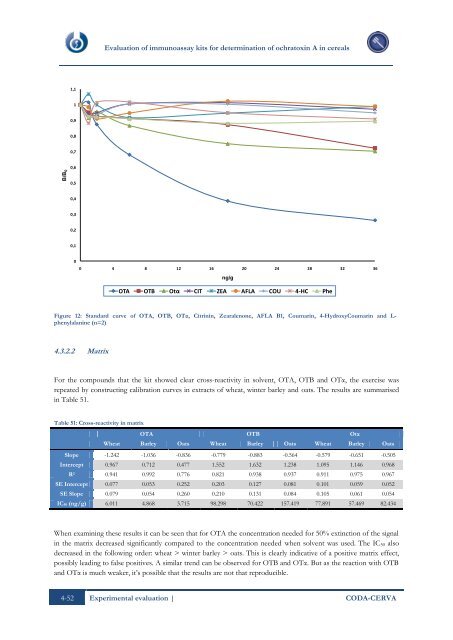
Evaluation of immunoassay kits for determination of ochratoxin A in cereals1,110,90,80,7B/B 00,60,50,40,30,20,100 4 8 12 16 20 24 28 32 36ng/gOTA OTB Otα CIT ZEA AFLA COU 4-HC PheFigure 12: Standard curve of OTA, OTB, OTα, Citrinin, Zearalenone, AFLA B1, Coumarin, 4-HydroxyCoumarin and L-phenylalanine (n=2)4.3.2.2 MatrixFor the compounds that the kit showed clear cross-reactivity in solvent, OTA, OTB and OTα, the exercise wasrepeated by constructing calibration curves in extracts of wheat, winter barley and oats. The results are summarisedin Table 51.Table 51: Cross-reactivity in matrixOTA OTB OtαWheat Barley Oats Wheat Barley Oats Wheat Barley OatsSlope -1.242 -1.036 -0.836 -0.779 -0.883 -0.564 -0.579 -0.651 -0.505Intercept 0.967 0.712 0.477 1.552 1.632 1.238 1.095 1.146 0.968R 2 0.941 0.992 0.776 0.821 0.938 0.937 0.911 0.975 0.967SE Intercept 0.077 0.053 0.252 0.203 0.127 0.081 0.101 0.059 0.052SE Slope 0.079 0.054 0.260 0.210 0.131 0.084 0.105 0.061 0.054IC50 (ng/g) 6.011 4.868 3.715 98.298 70.422 157.419 77.891 57.469 82.434When examining these results it can be seen that for OTA the concentration needed for 50% extinction of the signalin the matrix decreased significantly compared to the concentration needed when solvent was used. The IC 50 alsodecreased in the following order: wheat > winter barley > oats. This is clearly indicative of a positive matrix effect,possibly leading to false positives. A similar trend can be observed for OTB and OTα. But as the reaction with OTBand OTα is much weaker, it‟s possible that the results are not that reproducible.4-52 Experimental evaluation | CODA-CERVA