Document - FAVV
Document - FAVV
Document - FAVV
- No tags were found...

You also want an ePaper? Increase the reach of your titles
YUMPU automatically turns print PDFs into web optimized ePapers that Google loves.
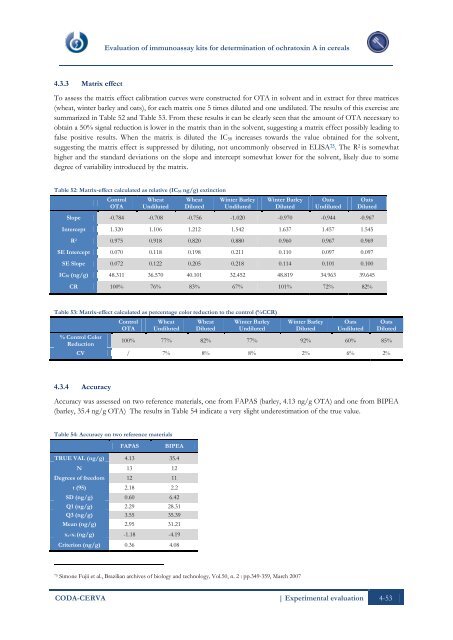
Evaluation of immunoassay kits for determination of ochratoxin A in cereals4.3.3 Matrix effectTo assess the matrix effect calibration curves were constructed for OTA in solvent and in extract for three matrices(wheat, winter barley and oats), for each matrix one 5 times diluted and one undiluted. The results of this exercise aresummarized in Table 52 and Table 53. From these results it can be clearly seen that the amount of OTA necessary toobtain a 50% signal reduction is lower in the matrix than in the solvent, suggesting a matrix effect possibly leading tofalse positive results. When the matrix is diluted the IC 50 increases towards the value obtained for the solvent,suggesting the matrix effect is suppressed by diluting, not uncommonly observed in ELISA 75 . The R 2 is somewhathigher and the standard deviations on the slope and intercept somewhat lower for the solvent, likely due to somedegree of variability introduced by the matrix.Table 52: Matrix-effect calculated as relative (IC50 ng/g) extinctionControlOTAWheatUndilutedWheatDilutedWinter BarleyUndilutedWinter BarleyDilutedOatsUndilutedOatsDilutedSlope -0.784 -0.708 -0.756 -1.020 -0.970 -0.944 -0.967Intercept 1.320 1.106 1.212 1.542 1.637 1.457 1.545R 2 0.975 0.918 0.820 0.880 0.960 0.967 0.969SE Intercept 0.070 0.118 0.198 0.211 0.110 0.097 0.097SE Slope 0.072 0.122 0.205 0.218 0.114 0.101 0.100IC50 (ng/g) 48.311 36.570 40.101 32.452 48.819 34.963 39.645CR 100% 76% 83% 67% 101% 72% 82%Table 53: Matrix-effect calculated as percentage color reduction to the control (%CCR)% Control ColorReductionControlOTAWheatUndilutedWheatDilutedWinter BarleyUndilutedWinter BarleyDilutedOatsUndilutedOatsDiluted100% 77% 82% 77% 92% 60% 85%CV / 7% 8% 8% 2% 6% 2%4.3.4 AccuracyAccuracy was assessed on two reference materials, one from FAPAS (barley, 4.13 ng/g OTA) and one from BIPEA(barley, 35.4 ng/g OTA) The results in Table 54 indicate a very slight underestimation of the true value.Table 54: Accuracy on two reference materialsFAPASBIPEATRUE VAL (ng/g) 4.13 35.4N 13 12Degrees of freedom 12 11t (95) 2.18 2.2SD (ng/g) 0.60 6.42Q1 (ng/g) 2.29 28.31Q3 (ng/g) 3.55 35.39Mean (ng/g) 2.95 31.21xe-xt (ng/g) -1.18 -4.19Criterion (ng/g) 0.36 4.0875Simone Fujii et al., Brazilian archives of biology and technology, Vol.50, n. 2 : pp.349-359, March 2007CODA-CERVA | Experimental evaluation 4-53