PPT - hcyuen@swk.cuhk.edu.hk
PPT - hcyuen@swk.cuhk.edu.hk
PPT - hcyuen@swk.cuhk.edu.hk
You also want an ePaper? Increase the reach of your titles
YUMPU automatically turns print PDFs into web optimized ePapers that Google loves.
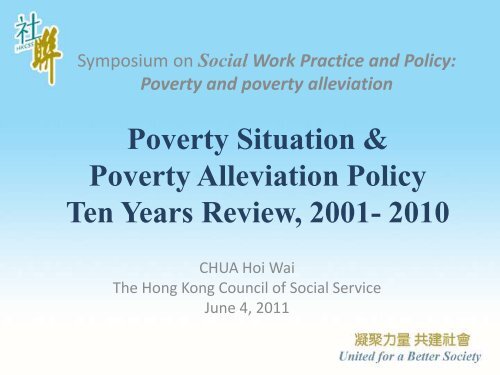
Symposium on Social Work Practice and Policy:Poverty and poverty alleviationPoverty Situation &Poverty Alleviation PolicyTen Years Review, 2001- 2010CHUA Hoi WaiThe Hong Kong Council of Social ServiceJune 4, 2011
An overview ofPoverty Situationin Hong Kong
Poverty LineHK$• No official poverty line in Hong Kong• HKCSS - Poverty line: Half of the median monthly domestichousehold income of the corresponding household sizeHousehold size 1999 2004 2009 2009(1 st half)2010(1 st half)1 person 3,500 3,065 3,300 3300 3,2752 persons 7,500 6,500 6,500 6750 7,1003 persons 8,500 8,000 9,000 9150 10,0004+ persons 10,700 10,500 12,400 12650 12,000Poverty Rate 17.2% 17.6% 17.3% 17.9% 18.1%Poverty Population (’000) 1,130.2 1,185.7 1,196.0 1,236.2 1,260.0Source: Census and Statistics Department, HK Govt.
Poverty Population (‘000)Poverty Population and Poverty Rate in HongKong, 1999-2010(1 st half)1300126018.3%1260.018.1%18.4%18.2%18.0%1220118017.6%1,185.7119617.8%17.6%17.4%114017.2%17.3%17.2%17.0%11001103.216.8%16.6%106016.4%PovertyRateSource: Census and Statistics Department
Poverty Rate and GDP per capita* in Hong Kong,1999-2010 (1 st half)300000250000200000163,84418.3%196,976231,63818.4%18.1% 18.2%18.0%17.8%17.6%15000010000017.2%17.6%17.3%17.4%17.2%17.0%5000016.8%16.6%016.4%PovertyRateSource: Census and Statistics Department* In Chained (2009) Dollars
Composition of Poverty Populationin Hong Kong, (2010 1 st half)35%30%Poverty rate by age group33.9%25%20%15%10%5%24.0%20.1%10.5%16.6%0%Children (0-14 yr) Youth (15-24 yr) Adult (25-44yr) Adult (45-64yr) Elderly (65yr +)Source: Census and Statistics Department
210,000Households withat least 1 MemberBeing Employed,(45%)The composition of the 470,000 household in poverty,2010 1 st half106,000 Singleor Dual ElderlyHouseholdswith NoMember BeingEmployed,(22%)155,000 Non -Single or DualElderlyHouseholds withNo MemberBeing Employed(33%)Source: Census and Statistics Department
Poverty population and poverty rate ofmiddle aged group (45-64 yrs), 1999-2010 (1 st Half)400380360340320300280260240220200PovertyPopulation(‘000)15.9%227.218%16.3% 15.9% 16.6% 16%355.214%330.712%319.610%8%6%4%2%0%1999 2000 2001 2002 2003 2004 2005 2006 2007 2008 2009 20101sthalfPovertyRateSource: Census and Statistics Department
No. of Household(`000)No. of Household in Working Poverty(1999-2010 1 st half)220210200190180195.1201 200.7190.8181.4190.5178.8194.9204.5200.8197.1210.5170160Source: Census and Statistics Department
Higher dependency ratio amongworking poverty households, 2007No. of working povertyhousehold withchildren aged 15 orbelowNo. of working povertyhousehold with elderlyaged 65 or below110,90045,700Total 142,500Dependency RatioWorking Poverty Household 447Hong Kong average 340Percentage to totalno. of working povertyhousehold69.7%Source: Census and Statistics Department
Wealth Gapin Hong Kong
DecileMonthly household median income ofdomestic households by decile (HK$)(at price level of June2006)1996 2001 20061996 – 2006change1st (lowest) 2,952 2,888 2,400 - 19%2nd 7,277 6,548 6,000 -18%3rd 9,840 9,700 9,000 -9%4th 12,300 12,610 12,000 -2%5th 15,646 16,005 15,300 -2%6th 19,188 19,885 19,500 +2%7th 23,124 24,934 24,250 +5%8th 29,282 31,583 31,000 +6%9th 39,360 43,311 42,900 +9%10th (highest) 68,880 77,600 78,000 +13%GiniCoefficient0.518 0.525 0.533 ----Source: Census and Statistics Department
year 1989 1999 2001 2003 2005 2007 2009HighIncomeHouseholdLowIncomeHouseholdRatio of monthly median income of high incomehousehold and low income household,1989, 1999 - 2010 1 st half2010(1 st half)25,000 29,940 33,720 32,887 32,853 33,049 31,504 32,9509,615 9,980 10,537 9,476 9,656 9,808 9,146 9,000Ratio 2.6 3.0 3.2 3.5 3.4 3.4 3.4 3.7Per capitaGDP134,683 163,844 174,898 183,022 210,006 235,217 231,638 --Source: Census and Statistics DepartmentGDP per capita: chained (2009) dollars
Situation of People with Disabilities2000 2007% of disabilities to totalpopulation4.0% 5.2%% of people withdisabilities who areeconomically active(HK in general)Unemployment rate ofpeople with disabilities(HK in general)Median income ofpeople with disabilities(HK in general)22.9%(60.5%)12.1%(4.9%)8,000(10,000)*excluding persons with intellectual disabilitySource: Census and Statistics Department13.2%(60.6)10.5%(4.0%)6,800(10,100)
Major Policies&Changes
Old Age Income ProtectionMPF (Pillar 2)- Set up in 2000- Reviews in 2005 & 2010: on lower/ upper income limitsOld Age Allowance (Pillar 1)- Amount increased to $1000 in 2008CSSA (Pillar 0)Portable CSSA – extended to Fujian Province in 2005Pillars 0 – 2: 5 pillar old age income protection system of World Bank, 2005
Comprehensive Social Security Assistance(CSSA)• No. of cases: 230,681 in 1999289,139 in 2009• No. of recipients: 376,507 in 1999482,001 in 2009• With 187,875 recipients are aged 60 and over (14.9% ofthe population in the same age group) in 2009
Comprehensive Social Security Assistance(CSSA)Percentage of CSSA Cases by Category, 1999-200960.0%50.0%40.0%30.0%20.0%10.0%0.0%-10.0%12.5%1999 2000 2001 2002 2003 2004 2005 2006 2007 2008 200953.1%11.5%8.7%6.3%5.4%2.5%Old AgePermanentdisabilityIll healthSingle parentLow earningsUnemploymentOthersSource: Census and Statistics Department, Hong Kong MonthlyDigest of Statistics September 2010
CSSA Expenditure and its Percentage in Total RecurrentGovernment Expenditure, 1999-2000 to 2009-2010Expenditure$billion19.518.517.57.5% 7.3%8.1% 8.8% 9.2%17.617.39.5% 9.3%17.817.69.0% 8.7% 8.6%18.0 18.6 19.0%10.0%9.0%8.0%7.0%16.515.516.16.0%5.0%4.0%14.53.0%13.513.6 13.62.0%1.0%12.50.0%Source: Census and Statistics Department, Hong Kong MonthlyDigest of Statistics September 2010
Comprehensive Social Security Assistance (CSSA)1999: r<strong>edu</strong>ced the standard rates of CSSApayments to families of 3 and 4+ by 10%and 20% respectively; cut in special grantsand long-term supplement; mandatoryemployment services for able-bodyrecipients2002: seven-year residency requirement ofCSSA2003: r<strong>edu</strong>ced the standard rates of CSSApayments, special grants and long-termsupplement, on grounds of deflation2006: New Dawn programme for singleparent families on CSSA with youngestchild aged 12-14 . Penalty imposed ifrefused.2007-2011: Special 1 or 2 months extraCSSA/OAA/DA payments to recipientsAverage Monthly CSSA Payments byNumber of Eligible Members,1999-2000 to 2009-2010Number ofeligiblemembers1999-20002005-20062009-20101 3,764 3,477 3,8842 6,253 5,798 6,2193 8,387 7,779 8,2404 10,083 9,172 9,7385 11,614 10,896 11,4626 and above 14,535 13,646 14,282Source: Census and Statistics Department, HongKong Monthly Digest of Statistics September 2010
Year Policies initiated Financialimplication2001 Community Investment & Inclusive Fund( 社 區 投 資 共 享 基 金 )$300m2005 Partnership Fund for the Disadvantaged ( 攜手 扶 弱 基 金 )$300m+$200m (2010’)2005 - 2007 Commission on Poverty ( 扶 貧 委 員 會 ) -2006 Enhancing Self-Reliance Through DistrictPartnership Programme(" 伙 伴 倡 自 強 " 社 區 協 作 計 劃 )2007 Transport Support Scheme( 交 通 費 支 援 計 劃 )2008 Child Development Fund( 兒 童 發 展 基 金 )$150m$365m$300m
Recent policies on poverty alleviationYear Policies initiated Financial implicationOct 2010Community Care Fund( 關 愛 基 金 )$5b + $ ? bMay 2011 Minimum Wage -Oct 2011Transport Support Scheme Work Incentive Transport SubsidyScheme ( 鼓 勵 就 業 交 通 津 貼 計 劃 )$4.85b for the first 3years
Recap and Policy DirectionsRecap• Widening wealth gap in Hong Kong• Payroll growth falling behind the economy• Working Poverty – impact of minimum wageto be monitored• Old Age Poverty: remain most important factorof poverty now and in future
Policy Directions1. Commission on Poverty – mission incomplete?2. Old Age Income Protection– Comprehensive review of retirement system or improvement toexisting social security system?3. Working Poverty– CSSA or many helping hands (housing, health care, LTC, etc.)?4. Other vulnerable groups– People with disabilities, new arrivals, cross-border families, etc.


