Benchmarking Foundation Administrative Expenses: Update on ...
Benchmarking Foundation Administrative Expenses: Update on ...
Benchmarking Foundation Administrative Expenses: Update on ...

You also want an ePaper? Increase the reach of your titles
YUMPU automatically turns print PDFs into web optimized ePapers that Google loves.
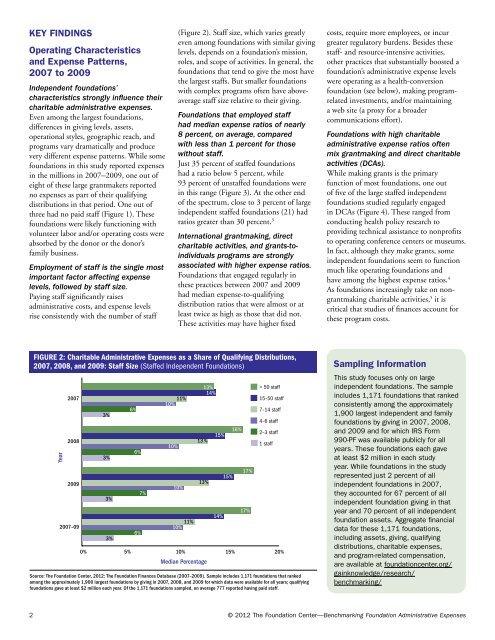
KEY FINDINGSOperating Characteristicsand Expense Patterns,2007 to 2009Independent foundati<strong>on</strong>s’characteristics str<strong>on</strong>gly influence theircharitable administrative expenses.Even am<strong>on</strong>g the largest foundati<strong>on</strong>s,differences in giving levels, assets,operati<strong>on</strong>al styles, geographic reach, andprograms vary dramatically and producevery different expense patterns. While somefoundati<strong>on</strong>s in this study reported expensesin the milli<strong>on</strong>s in 2007–2009, <strong>on</strong>e out ofeight of these large grantmakers reportedno expenses as part of their qualifyingdistributi<strong>on</strong>s in that period. One out ofthree had no paid staff (Figure 1). Thesefoundati<strong>on</strong>s were likely functi<strong>on</strong>ing withvolunteer labor and/or operating costs wereabsorbed by the d<strong>on</strong>or or the d<strong>on</strong>or’sfamily business.Employment of staff is the single mostimportant factor affecting expenselevels, followed by staff size.Paying staff significantly raisesadministrative costs, and expense levelsrise c<strong>on</strong>sistently with the number of staff(Figure 2). Staff size, which varies greatlyeven am<strong>on</strong>g foundati<strong>on</strong>s with similar givinglevels, depends <strong>on</strong> a foundati<strong>on</strong>’s missi<strong>on</strong>,roles, and scope of activities. In general, thefoundati<strong>on</strong>s that tend to give the most havethe largest staffs. But smaller foundati<strong>on</strong>swith complex programs often have aboveaveragestaff size relative to their giving.<str<strong>on</strong>g>Foundati<strong>on</strong></str<strong>on</strong>g>s that employed staffhad median expense ratios of nearly8 percent, <strong>on</strong> average, comparedwith less than 1 percent for thosewithout staff.Just 35 percent of staffed foundati<strong>on</strong>shad a ratio below 5 percent, while93 percent of unstaffed foundati<strong>on</strong>s werein this range (Figure 3). At the other endof the spectrum, close to 3 percent of largeindependent staffed foundati<strong>on</strong>s (21) hadratios greater than 30 percent. 3Internati<strong>on</strong>al grantmaking, directcharitable activities, and grants-toindividualsprograms are str<strong>on</strong>glyassociated with higher expense ratios.<str<strong>on</strong>g>Foundati<strong>on</strong></str<strong>on</strong>g>s that engaged regularly inthese practices between 2007 and 2009had median expense-to-qualifyingdistributi<strong>on</strong> ratios that were almost or atleast twice as high as those that did not.These activities may have higher fixedcosts, require more employees, or incurgreater regulatory burdens. Besides thesestaff- and resource-intensive activities,other practices that substantially boosted afoundati<strong>on</strong>’s administrative expense levelswere operating as a health-c<strong>on</strong>versi<strong>on</strong>foundati<strong>on</strong> (see below), making programrelatedinvestments, and/or maintaininga web site (a proxy for a broadercommunicati<strong>on</strong>s effort).<str<strong>on</strong>g>Foundati<strong>on</strong></str<strong>on</strong>g>s with high charitableadministrative expense ratios oftenmix grantmaking and direct charitableactivities (DCAs).While making grants is the primaryfuncti<strong>on</strong> of most foundati<strong>on</strong>s, <strong>on</strong>e outof five of the large staffed independentfoundati<strong>on</strong>s studied regularly engagedin DCAs (Figure 4). These ranged fromc<strong>on</strong>ducting health policy research toproviding technical assistance to n<strong>on</strong>profitsto operating c<strong>on</strong>ference centers or museums.In fact, although they make grants, someindependent foundati<strong>on</strong>s seem to functi<strong>on</strong>much like operating foundati<strong>on</strong>s andhave am<strong>on</strong>g the highest expense ratios. 4As foundati<strong>on</strong>s increasingly take <strong>on</strong> n<strong>on</strong>grantmakingcharitable activities, 5 it iscritical that studies of finances account forthese program costs.Figure 2: Charitable <str<strong>on</strong>g>Administrative</str<strong>on</strong>g> <str<strong>on</strong>g>Expenses</str<strong>on</strong>g> as a Share of Qualifying Distributi<strong>on</strong>s,2007, 2008, and 2009: Staff Size (Staffed Independent <str<strong>on</strong>g>Foundati<strong>on</strong></str<strong>on</strong>g>s)Year2007200820093%3%3%6%6%7%11%10%10%10%7 11%2007–0910%6%3%13%14%> 50 staff15–50 staff7–14 staff4–6 staff2–3 staff1 staff0% 5% 10% 15% 20%13%13%Median PercentageSource: The <str<strong>on</strong>g>Foundati<strong>on</strong></str<strong>on</strong>g> Center, 2012: The <str<strong>on</strong>g>Foundati<strong>on</strong></str<strong>on</strong>g> Finances Database (2007–2009). Sample includes 1,171 foundati<strong>on</strong>s that rankedam<strong>on</strong>g the approximately 1,900 largest foundati<strong>on</strong>s by giving in 2007, 2008, and 2009 for which data were available for all years; qualifyingfoundati<strong>on</strong>s gave at least $2 milli<strong>on</strong> each year. Of the 1,171 foundati<strong>on</strong>s sampled, <strong>on</strong> average 777 reported having paid staff.15%14%15%16%17%17%Sampling Informati<strong>on</strong>This study focuses <strong>on</strong>ly <strong>on</strong> largeindependent foundati<strong>on</strong>s. The sampleincludes 1,171 foundati<strong>on</strong>s that rankedc<strong>on</strong>sistently am<strong>on</strong>g the approximately1,900 largest independent and familyfoundati<strong>on</strong>s by giving in 2007, 2008,and 2009 and for which IRS Form990-PF was available publicly for allyears. These foundati<strong>on</strong>s each gaveat least $2 milli<strong>on</strong> in each studyyear. While foundati<strong>on</strong>s in the studyrepresented just 2 percent of allindependent foundati<strong>on</strong>s in 2007,they accounted for 67 percent of allindependent foundati<strong>on</strong> giving in thatyear and 70 percent of all independentfoundati<strong>on</strong> assets. Aggregate financialdata for these 1,171 foundati<strong>on</strong>s,including assets, giving, qualifyingdistributi<strong>on</strong>s, charitable expenses,and program-related compensati<strong>on</strong>,are available at foundati<strong>on</strong>center.org/gainknowledge/research/benchmarking/2 © 2012 The <str<strong>on</strong>g>Foundati<strong>on</strong></str<strong>on</strong>g> Center—<str<strong>on</strong>g>Benchmarking</str<strong>on</strong>g> <str<strong>on</strong>g>Foundati<strong>on</strong></str<strong>on</strong>g> <str<strong>on</strong>g>Administrative</str<strong>on</strong>g> <str<strong>on</strong>g>Expenses</str<strong>on</strong>g>