Figure 5: Charitable <str<strong>on</strong>g>Administrative</str<strong>on</strong>g> <str<strong>on</strong>g>Expenses</str<strong>on</strong>g> as a Share of Qualifying Distributi<strong>on</strong>s,2007–2009: Health C<strong>on</strong>versi<strong>on</strong> <str<strong>on</strong>g>Foundati<strong>on</strong></str<strong>on</strong>g>s (Staffed Independent <str<strong>on</strong>g>Foundati<strong>on</strong></str<strong>on</strong>g>s)Giving RangeLess than$5 milli<strong>on</strong>$5 milli<strong>on</strong>or moreAllHealth C<strong>on</strong>versi<strong>on</strong>N<strong>on</strong>-Health C<strong>on</strong>versi<strong>on</strong>n=14 18.9%n=319 8.1%n=16 16.6%n=428 7.2%n=30 17.8%n=747 7.7%0% 5% 10% 15% 20%Median PercentageSource: The <str<strong>on</strong>g>Foundati<strong>on</strong></str<strong>on</strong>g> Center, 2012: The <str<strong>on</strong>g>Foundati<strong>on</strong></str<strong>on</strong>g> Finances Database (2007–2009). Sample includes 1,171 foundati<strong>on</strong>s that rankedam<strong>on</strong>g the approximately 1,900 largest foundati<strong>on</strong>s by giving in 2007, 2008, and 2009 for which data were available for all years; qualifyingfoundati<strong>on</strong>s gave at least $2 milli<strong>on</strong> each year. Of the 1,171 foundati<strong>on</strong>s sampled, <strong>on</strong> average 777 reported having paid staff.Family <str<strong>on</strong>g>Foundati<strong>on</strong></str<strong>on</strong>g>s’ Lifespan Decisi<strong>on</strong>s and Spending LevelsIn general, knowledge is scarce about the lifespan intenti<strong>on</strong>s of independentfoundati<strong>on</strong>s. However, based <strong>on</strong> resp<strong>on</strong>ses to a 2008 <str<strong>on</strong>g>Foundati<strong>on</strong></str<strong>on</strong>g> Center survey offamily foundati<strong>on</strong>s, 175 staffed foundati<strong>on</strong>s in this study were coded as limited-life(24), perpetual (95), or undecided (56). 1 For the limited life foundati<strong>on</strong>s, the decisi<strong>on</strong>to spend down was associated with lower median expense levels than those of allfamily foundati<strong>on</strong>s in the study. The few limited-life foundati<strong>on</strong>s had a4 percent median expense ratio, compared with an 8 percent ratio for foundati<strong>on</strong>sthat planned to exist in perpetuity or were undecided. The lower ratios of somespend-down foundati<strong>on</strong>s correlate with their n<strong>on</strong>-endowed (pass-through) status. Buteven the largest endowed foundati<strong>on</strong>s had very low ratios. Since these foundati<strong>on</strong>shave formally opted to spend out their assets, they presumably had greater flexibilitythan perpetual foundati<strong>on</strong>s after the stock market crash to maintain or increasegiving. They were also less likely to add costly infrastructure.1The subset of 175 family foundati<strong>on</strong>s for which lifespan intenti<strong>on</strong>s were known represented 40 percentof the 441 family foundati<strong>on</strong>s in this study. Of the 24 limited-life foundati<strong>on</strong>s in the sample, 15 had2007–2009 giving of $10 milli<strong>on</strong> or greater, <strong>on</strong> average. For informati<strong>on</strong> about the survey findings, downloadPerpetuity or Limited Lifespan: How Do Family <str<strong>on</strong>g>Foundati<strong>on</strong></str<strong>on</strong>g>s Decide? (foundati<strong>on</strong>center.org/gainknowledge)figure 6: Charitable <str<strong>on</strong>g>Administrative</str<strong>on</strong>g> <str<strong>on</strong>g>Expenses</str<strong>on</strong>g> as a Share of Qualifying Distributi<strong>on</strong>s,2007–2009: Family versus N<strong>on</strong>-Family (Staffed Independent <str<strong>on</strong>g>Foundati<strong>on</strong></str<strong>on</strong>g>s)Giving Range$50 milli<strong>on</strong>or more$10 milli<strong>on</strong> to$50 milli<strong>on</strong>$5 milli<strong>on</strong> to$10 milli<strong>on</strong>$3 milli<strong>on</strong> to$5 milli<strong>on</strong>Less than$3 milli<strong>on</strong>n=23n=27n=118n=81n=111n=84n=124n=97n=65n=47Family4.2%N<strong>on</strong>-FamilyAll n=4416.1%n=33610.2%0% 2% 4% 6% 8% 10% 12%Median PercentageSource: The <str<strong>on</strong>g>Foundati<strong>on</strong></str<strong>on</strong>g> Center, 2012: The <str<strong>on</strong>g>Foundati<strong>on</strong></str<strong>on</strong>g> Finances Database (2007–2009). Sample includes 1,171 foundati<strong>on</strong>s that rankedam<strong>on</strong>g the approximately 1,900 largest foundati<strong>on</strong>s by giving in 2007, 2008, and 2009 for which data were available for all years; qualifyingfoundati<strong>on</strong>s gave at least $2 milli<strong>on</strong> each year. Of the 1,171 foundati<strong>on</strong>s sampled, <strong>on</strong> average 777 reported having paid staff.5.4%6.3%7.1%7.0%10.2%10.1%9.9%11.3%11.1%Between 2007 and 2009, there wasrelatively little year-to-year change inthe factors that drive expense ratios.Although the three-year average evens outsome marked increases in expense levelsin 2008 or 2009, the underlying patternsremain c<strong>on</strong>sistent. The characteristics thatinfluence expenses were the same in eachindividual year and their impact <strong>on</strong> expenselevels was also very similar.historical trends andstudy implicati<strong>on</strong>sChanges in the ec<strong>on</strong>omy affect assetand giving levels of foundati<strong>on</strong>s andthus the relati<strong>on</strong>ship of their expensesto qualifying distributi<strong>on</strong>s, but spendingpatterns tend to even out over time.Independent foundati<strong>on</strong>s are very sensitiveto stock market trends since their mandatedpayout levels are based <strong>on</strong> their net assets.After growing robustly through 2007, 8foundati<strong>on</strong> endowments fell victim tothe 2008 financial meltdown (Figure 7).Since giving and payout are driven by assetvaluati<strong>on</strong> in the preceding year (or overa few years), a majority of foundati<strong>on</strong>sreduced their 2009 giving after holdingsteady or increasing giving in 2008.<str<strong>on</strong>g>Administrative</str<strong>on</strong>g> expenses increased by doubledigits in this period, perhaps reflecting adelayed adjustment to five years of solidgrowth in foundati<strong>on</strong> portfolios. 9 Whenexpense levels increase faster than giving, theexpense porti<strong>on</strong> of qualifying distributi<strong>on</strong>sincreases. Between 2007 and 2009, theyearly median expense ratio for staffedfoundati<strong>on</strong>s rose slightly. But averaged overthree years, the median ratio for this period,was the same as for 2004–2006 (nearly8 percent).The factors that drive expense levelsof independent foundati<strong>on</strong>s were thesame in 2007 to 2009 as they werein earlier periods.For foundati<strong>on</strong>s of comparable size, eachof the operating characteristics that had ameasurable effect <strong>on</strong> expense levels in 2001to 2003 and 2004 to 2006 had a c<strong>on</strong>sistentinfluence <strong>on</strong> expense patterns in this period,even if the median ratios were sometimesa little higher or lower. Thus, the effect ofdifferences in large foundati<strong>on</strong>s’ operatingcharacteristics <strong>on</strong> their spending patternshas now been documented over threec<strong>on</strong>secutive but distinct ec<strong>on</strong>omic periods4 © 2012 The <str<strong>on</strong>g>Foundati<strong>on</strong></str<strong>on</strong>g> Center—<str<strong>on</strong>g>Benchmarking</str<strong>on</strong>g> <str<strong>on</strong>g>Foundati<strong>on</strong></str<strong>on</strong>g> <str<strong>on</strong>g>Administrative</str<strong>on</strong>g> <str<strong>on</strong>g>Expenses</str<strong>on</strong>g>
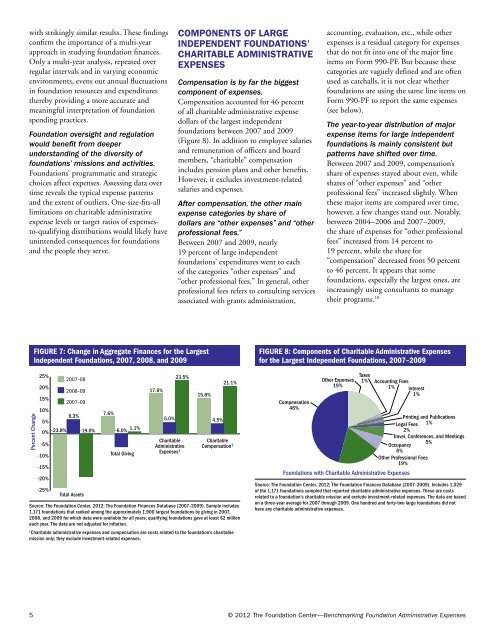
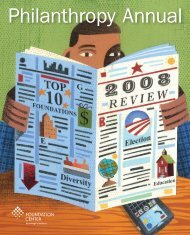
with strikingly similar results. These findingsc<strong>on</strong>firm the importance of a multi-yearapproach in studying foundati<strong>on</strong> finances.Only a multi-year analysis, repeated overregular intervals and in varying ec<strong>on</strong>omicenvir<strong>on</strong>ments, evens out annual fluctuati<strong>on</strong>sin foundati<strong>on</strong> resources and expendituresthereby providing a more accurate andmeaningful interpretati<strong>on</strong> of foundati<strong>on</strong>spending practices.<str<strong>on</strong>g>Foundati<strong>on</strong></str<strong>on</strong>g> oversight and regulati<strong>on</strong>would benefit from deeperunderstanding of the diversity offoundati<strong>on</strong>s’ missi<strong>on</strong>s and activities.<str<strong>on</strong>g>Foundati<strong>on</strong></str<strong>on</strong>g>s’ programmatic and strategicchoices affect expenses. Assessing data overtime reveals the typical expense patternsand the extent of outliers. One-size-fits-alllimitati<strong>on</strong>s <strong>on</strong> charitable administrativeexpense levels or target ratios of expensesto-qualifyingdistributi<strong>on</strong>s would likely haveunintended c<strong>on</strong>sequences for foundati<strong>on</strong>sand the people they serve.comp<strong>on</strong>ents of largeindependent foundati<strong>on</strong>s’charitable administrativeexpensesCompensati<strong>on</strong> is by far the biggestcomp<strong>on</strong>ent of expenses.Compensati<strong>on</strong> accounted for 46 percentof all charitable administrative expensedollars of the largest independentfoundati<strong>on</strong>s between 2007 and 2009(Figure 8). In additi<strong>on</strong> to employee salariesand remunerati<strong>on</strong> of officers and boardmembers, “charitable” compensati<strong>on</strong>includes pensi<strong>on</strong> plans and other benefits.However, it excludes investment-relatedsalaries and expenses.After compensati<strong>on</strong>, the other mainexpense categories by share ofdollars are “other expenses” and “otherprofessi<strong>on</strong>al fees.”Between 2007 and 2009, nearly19 percent of large independentfoundati<strong>on</strong>s’ expenditures went to eachof the categories “other expenses” and“other professi<strong>on</strong>al fees.” In general, otherprofessi<strong>on</strong>al fees refers to c<strong>on</strong>sulting servicesassociated with grants administrati<strong>on</strong>,accounting, evaluati<strong>on</strong>, etc., while otherexpenses is a residual category for expensesthat do not fit into <strong>on</strong>e of the major lineitems <strong>on</strong> Form 990-PF. But because thesecategories are vaguely defined and are oftenused as catchalls, it is not clear whetherfoundati<strong>on</strong>s are using the same line items <strong>on</strong>Form 990-PF to report the same expenses(see below).The year-to-year distributi<strong>on</strong> of majorexpense items for large independentfoundati<strong>on</strong>s is mainly c<strong>on</strong>sistent butpatterns have shifted over time.Between 2007 and 2009, compensati<strong>on</strong>’sshare of expenses stayed about even, whileshares of “other expenses” and “otherprofessi<strong>on</strong>al fees” increased slightly. Whenthese major items are compared over time,however, a few changes stand out. Notably,between 2004–2006 and 2007–2009,the share of expenses for “other professi<strong>on</strong>alfees” increased from 14 percent to19 percent, while the share for“compensati<strong>on</strong>” decreased from 50 percentto 46 percent. It appears that somefoundati<strong>on</strong>s, especially the largest <strong>on</strong>es, areincreasingly using c<strong>on</strong>sultants to managetheir programs. 10Percent ChangeFigure 7: Change in Aggregate Finances for the LargestIndependent <str<strong>on</strong>g>Foundati<strong>on</strong></str<strong>on</strong>g>s, 2007, 2008, and 200925%20%15%10%5%0% -23.8%-5%-10%-15%-20%-25%2007–082008–092007–096.3%Total Assets-19.0%7.6%-6.0% 1.1% 17.6%Total GivingCharitable<str<strong>on</strong>g>Administrative</str<strong>on</strong>g><str<strong>on</strong>g>Expenses</str<strong>on</strong>g> 1CharitableCompensati<strong>on</strong> 1Source: The <str<strong>on</strong>g>Foundati<strong>on</strong></str<strong>on</strong>g> Center, 2012: The <str<strong>on</strong>g>Foundati<strong>on</strong></str<strong>on</strong>g> Finances Database (2007–2009). Sample includes1,171 foundati<strong>on</strong>s that ranked am<strong>on</strong>g the approximately 1,900 largest foundati<strong>on</strong>s by giving in 2007,2008, and 2009 for which data were available for all years; qualifying foundati<strong>on</strong>s gave at least $2 milli<strong>on</strong>each year. The data are not adjusted for inflati<strong>on</strong>.1Charitable administrative expenses and compensati<strong>on</strong> are costs related to the foundati<strong>on</strong>’s charitablemissi<strong>on</strong> <strong>on</strong>ly; they exclude investment-related expenses.5.0%23.5%15.8%4.5%21.1%Figure 8: Comp<strong>on</strong>ents of Charitable <str<strong>on</strong>g>Administrative</str<strong>on</strong>g> <str<strong>on</strong>g>Expenses</str<strong>on</strong>g>for the Largest Independent <str<strong>on</strong>g>Foundati<strong>on</strong></str<strong>on</strong>g>s, 2007–2009Compensati<strong>on</strong>46%Other <str<strong>on</strong>g>Expenses</str<strong>on</strong>g>19%Taxes1%Accounting Fees1% Interest1%<str<strong>on</strong>g>Foundati<strong>on</strong></str<strong>on</strong>g>s with Charitable <str<strong>on</strong>g>Administrative</str<strong>on</strong>g> <str<strong>on</strong>g>Expenses</str<strong>on</strong>g>Printing and Publicati<strong>on</strong>sLegal Fees 1%2%Travel, C<strong>on</strong>ferences, and Meetings5%Occupancy6%Other Professi<strong>on</strong>al Fees19%Source: The <str<strong>on</strong>g>Foundati<strong>on</strong></str<strong>on</strong>g> Center, 2012; The <str<strong>on</strong>g>Foundati<strong>on</strong></str<strong>on</strong>g> Finances Database (2007–2009). Includes 1,029of the 1,171 foundati<strong>on</strong>s sampled that reported charitable administrative expenses. These are costsrelated to a foundati<strong>on</strong>’s charitable missi<strong>on</strong> and exclude investment-related expenses. The data are based<strong>on</strong> a three-year average for 2007 through 2009. One hundred and forty-two large foundati<strong>on</strong>s did nothave any charitable administrative expenses.5 © 2012 The <str<strong>on</strong>g>Foundati<strong>on</strong></str<strong>on</strong>g> Center—<str<strong>on</strong>g>Benchmarking</str<strong>on</strong>g> <str<strong>on</strong>g>Foundati<strong>on</strong></str<strong>on</strong>g> <str<strong>on</strong>g>Administrative</str<strong>on</strong>g> <str<strong>on</strong>g>Expenses</str<strong>on</strong>g>77.0%