Benchmarking Foundation Administrative Expenses: Update on ...
Benchmarking Foundation Administrative Expenses: Update on ...
Benchmarking Foundation Administrative Expenses: Update on ...

You also want an ePaper? Increase the reach of your titles
YUMPU automatically turns print PDFs into web optimized ePapers that Google loves.
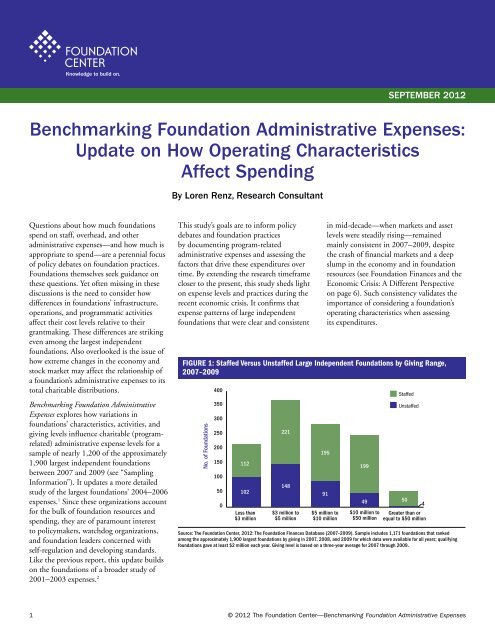
KEY FINDINGSOperating Characteristicsand Expense Patterns,2007 to 2009Independent foundati<strong>on</strong>s’characteristics str<strong>on</strong>gly influence theircharitable administrative expenses.Even am<strong>on</strong>g the largest foundati<strong>on</strong>s,differences in giving levels, assets,operati<strong>on</strong>al styles, geographic reach, andprograms vary dramatically and producevery different expense patterns. While somefoundati<strong>on</strong>s in this study reported expensesin the milli<strong>on</strong>s in 2007–2009, <strong>on</strong>e out ofeight of these large grantmakers reportedno expenses as part of their qualifyingdistributi<strong>on</strong>s in that period. One out ofthree had no paid staff (Figure 1). Thesefoundati<strong>on</strong>s were likely functi<strong>on</strong>ing withvolunteer labor and/or operating costs wereabsorbed by the d<strong>on</strong>or or the d<strong>on</strong>or’sfamily business.Employment of staff is the single mostimportant factor affecting expenselevels, followed by staff size.Paying staff significantly raisesadministrative costs, and expense levelsrise c<strong>on</strong>sistently with the number of staff(Figure 2). Staff size, which varies greatlyeven am<strong>on</strong>g foundati<strong>on</strong>s with similar givinglevels, depends <strong>on</strong> a foundati<strong>on</strong>’s missi<strong>on</strong>,roles, and scope of activities. In general, thefoundati<strong>on</strong>s that tend to give the most havethe largest staffs. But smaller foundati<strong>on</strong>swith complex programs often have aboveaveragestaff size relative to their giving.<str<strong>on</strong>g>Foundati<strong>on</strong></str<strong>on</strong>g>s that employed staffhad median expense ratios of nearly8 percent, <strong>on</strong> average, comparedwith less than 1 percent for thosewithout staff.Just 35 percent of staffed foundati<strong>on</strong>shad a ratio below 5 percent, while93 percent of unstaffed foundati<strong>on</strong>s werein this range (Figure 3). At the other endof the spectrum, close to 3 percent of largeindependent staffed foundati<strong>on</strong>s (21) hadratios greater than 30 percent. 3Internati<strong>on</strong>al grantmaking, directcharitable activities, and grants-toindividualsprograms are str<strong>on</strong>glyassociated with higher expense ratios.<str<strong>on</strong>g>Foundati<strong>on</strong></str<strong>on</strong>g>s that engaged regularly inthese practices between 2007 and 2009had median expense-to-qualifyingdistributi<strong>on</strong> ratios that were almost or atleast twice as high as those that did not.These activities may have higher fixedcosts, require more employees, or incurgreater regulatory burdens. Besides thesestaff- and resource-intensive activities,other practices that substantially boosted afoundati<strong>on</strong>’s administrative expense levelswere operating as a health-c<strong>on</strong>versi<strong>on</strong>foundati<strong>on</strong> (see below), making programrelatedinvestments, and/or maintaininga web site (a proxy for a broadercommunicati<strong>on</strong>s effort).<str<strong>on</strong>g>Foundati<strong>on</strong></str<strong>on</strong>g>s with high charitableadministrative expense ratios oftenmix grantmaking and direct charitableactivities (DCAs).While making grants is the primaryfuncti<strong>on</strong> of most foundati<strong>on</strong>s, <strong>on</strong>e outof five of the large staffed independentfoundati<strong>on</strong>s studied regularly engagedin DCAs (Figure 4). These ranged fromc<strong>on</strong>ducting health policy research toproviding technical assistance to n<strong>on</strong>profitsto operating c<strong>on</strong>ference centers or museums.In fact, although they make grants, someindependent foundati<strong>on</strong>s seem to functi<strong>on</strong>much like operating foundati<strong>on</strong>s andhave am<strong>on</strong>g the highest expense ratios. 4As foundati<strong>on</strong>s increasingly take <strong>on</strong> n<strong>on</strong>grantmakingcharitable activities, 5 it iscritical that studies of finances account forthese program costs.Figure 2: Charitable <str<strong>on</strong>g>Administrative</str<strong>on</strong>g> <str<strong>on</strong>g>Expenses</str<strong>on</strong>g> as a Share of Qualifying Distributi<strong>on</strong>s,2007, 2008, and 2009: Staff Size (Staffed Independent <str<strong>on</strong>g>Foundati<strong>on</strong></str<strong>on</strong>g>s)Year2007200820093%3%3%6%6%7%11%10%10%10%7 11%2007–0910%6%3%13%14%> 50 staff15–50 staff7–14 staff4–6 staff2–3 staff1 staff0% 5% 10% 15% 20%13%13%Median PercentageSource: The <str<strong>on</strong>g>Foundati<strong>on</strong></str<strong>on</strong>g> Center, 2012: The <str<strong>on</strong>g>Foundati<strong>on</strong></str<strong>on</strong>g> Finances Database (2007–2009). Sample includes 1,171 foundati<strong>on</strong>s that rankedam<strong>on</strong>g the approximately 1,900 largest foundati<strong>on</strong>s by giving in 2007, 2008, and 2009 for which data were available for all years; qualifyingfoundati<strong>on</strong>s gave at least $2 milli<strong>on</strong> each year. Of the 1,171 foundati<strong>on</strong>s sampled, <strong>on</strong> average 777 reported having paid staff.15%14%15%16%17%17%Sampling Informati<strong>on</strong>This study focuses <strong>on</strong>ly <strong>on</strong> largeindependent foundati<strong>on</strong>s. The sampleincludes 1,171 foundati<strong>on</strong>s that rankedc<strong>on</strong>sistently am<strong>on</strong>g the approximately1,900 largest independent and familyfoundati<strong>on</strong>s by giving in 2007, 2008,and 2009 and for which IRS Form990-PF was available publicly for allyears. These foundati<strong>on</strong>s each gaveat least $2 milli<strong>on</strong> in each studyyear. While foundati<strong>on</strong>s in the studyrepresented just 2 percent of allindependent foundati<strong>on</strong>s in 2007,they accounted for 67 percent of allindependent foundati<strong>on</strong> giving in thatyear and 70 percent of all independentfoundati<strong>on</strong> assets. Aggregate financialdata for these 1,171 foundati<strong>on</strong>s,including assets, giving, qualifyingdistributi<strong>on</strong>s, charitable expenses,and program-related compensati<strong>on</strong>,are available at foundati<strong>on</strong>center.org/gainknowledge/research/benchmarking/2 © 2012 The <str<strong>on</strong>g>Foundati<strong>on</strong></str<strong>on</strong>g> Center—<str<strong>on</strong>g>Benchmarking</str<strong>on</strong>g> <str<strong>on</strong>g>Foundati<strong>on</strong></str<strong>on</strong>g> <str<strong>on</strong>g>Administrative</str<strong>on</strong>g> <str<strong>on</strong>g>Expenses</str<strong>on</strong>g>
Figure 5: Charitable <str<strong>on</strong>g>Administrative</str<strong>on</strong>g> <str<strong>on</strong>g>Expenses</str<strong>on</strong>g> as a Share of Qualifying Distributi<strong>on</strong>s,2007–2009: Health C<strong>on</strong>versi<strong>on</strong> <str<strong>on</strong>g>Foundati<strong>on</strong></str<strong>on</strong>g>s (Staffed Independent <str<strong>on</strong>g>Foundati<strong>on</strong></str<strong>on</strong>g>s)Giving RangeLess than$5 milli<strong>on</strong>$5 milli<strong>on</strong>or moreAllHealth C<strong>on</strong>versi<strong>on</strong>N<strong>on</strong>-Health C<strong>on</strong>versi<strong>on</strong>n=14 18.9%n=319 8.1%n=16 16.6%n=428 7.2%n=30 17.8%n=747 7.7%0% 5% 10% 15% 20%Median PercentageSource: The <str<strong>on</strong>g>Foundati<strong>on</strong></str<strong>on</strong>g> Center, 2012: The <str<strong>on</strong>g>Foundati<strong>on</strong></str<strong>on</strong>g> Finances Database (2007–2009). Sample includes 1,171 foundati<strong>on</strong>s that rankedam<strong>on</strong>g the approximately 1,900 largest foundati<strong>on</strong>s by giving in 2007, 2008, and 2009 for which data were available for all years; qualifyingfoundati<strong>on</strong>s gave at least $2 milli<strong>on</strong> each year. Of the 1,171 foundati<strong>on</strong>s sampled, <strong>on</strong> average 777 reported having paid staff.Family <str<strong>on</strong>g>Foundati<strong>on</strong></str<strong>on</strong>g>s’ Lifespan Decisi<strong>on</strong>s and Spending LevelsIn general, knowledge is scarce about the lifespan intenti<strong>on</strong>s of independentfoundati<strong>on</strong>s. However, based <strong>on</strong> resp<strong>on</strong>ses to a 2008 <str<strong>on</strong>g>Foundati<strong>on</strong></str<strong>on</strong>g> Center survey offamily foundati<strong>on</strong>s, 175 staffed foundati<strong>on</strong>s in this study were coded as limited-life(24), perpetual (95), or undecided (56). 1 For the limited life foundati<strong>on</strong>s, the decisi<strong>on</strong>to spend down was associated with lower median expense levels than those of allfamily foundati<strong>on</strong>s in the study. The few limited-life foundati<strong>on</strong>s had a4 percent median expense ratio, compared with an 8 percent ratio for foundati<strong>on</strong>sthat planned to exist in perpetuity or were undecided. The lower ratios of somespend-down foundati<strong>on</strong>s correlate with their n<strong>on</strong>-endowed (pass-through) status. Buteven the largest endowed foundati<strong>on</strong>s had very low ratios. Since these foundati<strong>on</strong>shave formally opted to spend out their assets, they presumably had greater flexibilitythan perpetual foundati<strong>on</strong>s after the stock market crash to maintain or increasegiving. They were also less likely to add costly infrastructure.1The subset of 175 family foundati<strong>on</strong>s for which lifespan intenti<strong>on</strong>s were known represented 40 percentof the 441 family foundati<strong>on</strong>s in this study. Of the 24 limited-life foundati<strong>on</strong>s in the sample, 15 had2007–2009 giving of $10 milli<strong>on</strong> or greater, <strong>on</strong> average. For informati<strong>on</strong> about the survey findings, downloadPerpetuity or Limited Lifespan: How Do Family <str<strong>on</strong>g>Foundati<strong>on</strong></str<strong>on</strong>g>s Decide? (foundati<strong>on</strong>center.org/gainknowledge)figure 6: Charitable <str<strong>on</strong>g>Administrative</str<strong>on</strong>g> <str<strong>on</strong>g>Expenses</str<strong>on</strong>g> as a Share of Qualifying Distributi<strong>on</strong>s,2007–2009: Family versus N<strong>on</strong>-Family (Staffed Independent <str<strong>on</strong>g>Foundati<strong>on</strong></str<strong>on</strong>g>s)Giving Range$50 milli<strong>on</strong>or more$10 milli<strong>on</strong> to$50 milli<strong>on</strong>$5 milli<strong>on</strong> to$10 milli<strong>on</strong>$3 milli<strong>on</strong> to$5 milli<strong>on</strong>Less than$3 milli<strong>on</strong>n=23n=27n=118n=81n=111n=84n=124n=97n=65n=47Family4.2%N<strong>on</strong>-FamilyAll n=4416.1%n=33610.2%0% 2% 4% 6% 8% 10% 12%Median PercentageSource: The <str<strong>on</strong>g>Foundati<strong>on</strong></str<strong>on</strong>g> Center, 2012: The <str<strong>on</strong>g>Foundati<strong>on</strong></str<strong>on</strong>g> Finances Database (2007–2009). Sample includes 1,171 foundati<strong>on</strong>s that rankedam<strong>on</strong>g the approximately 1,900 largest foundati<strong>on</strong>s by giving in 2007, 2008, and 2009 for which data were available for all years; qualifyingfoundati<strong>on</strong>s gave at least $2 milli<strong>on</strong> each year. Of the 1,171 foundati<strong>on</strong>s sampled, <strong>on</strong> average 777 reported having paid staff.5.4%6.3%7.1%7.0%10.2%10.1%9.9%11.3%11.1%Between 2007 and 2009, there wasrelatively little year-to-year change inthe factors that drive expense ratios.Although the three-year average evens outsome marked increases in expense levelsin 2008 or 2009, the underlying patternsremain c<strong>on</strong>sistent. The characteristics thatinfluence expenses were the same in eachindividual year and their impact <strong>on</strong> expenselevels was also very similar.historical trends andstudy implicati<strong>on</strong>sChanges in the ec<strong>on</strong>omy affect assetand giving levels of foundati<strong>on</strong>s andthus the relati<strong>on</strong>ship of their expensesto qualifying distributi<strong>on</strong>s, but spendingpatterns tend to even out over time.Independent foundati<strong>on</strong>s are very sensitiveto stock market trends since their mandatedpayout levels are based <strong>on</strong> their net assets.After growing robustly through 2007, 8foundati<strong>on</strong> endowments fell victim tothe 2008 financial meltdown (Figure 7).Since giving and payout are driven by assetvaluati<strong>on</strong> in the preceding year (or overa few years), a majority of foundati<strong>on</strong>sreduced their 2009 giving after holdingsteady or increasing giving in 2008.<str<strong>on</strong>g>Administrative</str<strong>on</strong>g> expenses increased by doubledigits in this period, perhaps reflecting adelayed adjustment to five years of solidgrowth in foundati<strong>on</strong> portfolios. 9 Whenexpense levels increase faster than giving, theexpense porti<strong>on</strong> of qualifying distributi<strong>on</strong>sincreases. Between 2007 and 2009, theyearly median expense ratio for staffedfoundati<strong>on</strong>s rose slightly. But averaged overthree years, the median ratio for this period,was the same as for 2004–2006 (nearly8 percent).The factors that drive expense levelsof independent foundati<strong>on</strong>s were thesame in 2007 to 2009 as they werein earlier periods.For foundati<strong>on</strong>s of comparable size, eachof the operating characteristics that had ameasurable effect <strong>on</strong> expense levels in 2001to 2003 and 2004 to 2006 had a c<strong>on</strong>sistentinfluence <strong>on</strong> expense patterns in this period,even if the median ratios were sometimesa little higher or lower. Thus, the effect ofdifferences in large foundati<strong>on</strong>s’ operatingcharacteristics <strong>on</strong> their spending patternshas now been documented over threec<strong>on</strong>secutive but distinct ec<strong>on</strong>omic periods4 © 2012 The <str<strong>on</strong>g>Foundati<strong>on</strong></str<strong>on</strong>g> Center—<str<strong>on</strong>g>Benchmarking</str<strong>on</strong>g> <str<strong>on</strong>g>Foundati<strong>on</strong></str<strong>on</strong>g> <str<strong>on</strong>g>Administrative</str<strong>on</strong>g> <str<strong>on</strong>g>Expenses</str<strong>on</strong>g>
with strikingly similar results. These findingsc<strong>on</strong>firm the importance of a multi-yearapproach in studying foundati<strong>on</strong> finances.Only a multi-year analysis, repeated overregular intervals and in varying ec<strong>on</strong>omicenvir<strong>on</strong>ments, evens out annual fluctuati<strong>on</strong>sin foundati<strong>on</strong> resources and expendituresthereby providing a more accurate andmeaningful interpretati<strong>on</strong> of foundati<strong>on</strong>spending practices.<str<strong>on</strong>g>Foundati<strong>on</strong></str<strong>on</strong>g> oversight and regulati<strong>on</strong>would benefit from deeperunderstanding of the diversity offoundati<strong>on</strong>s’ missi<strong>on</strong>s and activities.<str<strong>on</strong>g>Foundati<strong>on</strong></str<strong>on</strong>g>s’ programmatic and strategicchoices affect expenses. Assessing data overtime reveals the typical expense patternsand the extent of outliers. One-size-fits-alllimitati<strong>on</strong>s <strong>on</strong> charitable administrativeexpense levels or target ratios of expensesto-qualifyingdistributi<strong>on</strong>s would likely haveunintended c<strong>on</strong>sequences for foundati<strong>on</strong>sand the people they serve.comp<strong>on</strong>ents of largeindependent foundati<strong>on</strong>s’charitable administrativeexpensesCompensati<strong>on</strong> is by far the biggestcomp<strong>on</strong>ent of expenses.Compensati<strong>on</strong> accounted for 46 percentof all charitable administrative expensedollars of the largest independentfoundati<strong>on</strong>s between 2007 and 2009(Figure 8). In additi<strong>on</strong> to employee salariesand remunerati<strong>on</strong> of officers and boardmembers, “charitable” compensati<strong>on</strong>includes pensi<strong>on</strong> plans and other benefits.However, it excludes investment-relatedsalaries and expenses.After compensati<strong>on</strong>, the other mainexpense categories by share ofdollars are “other expenses” and “otherprofessi<strong>on</strong>al fees.”Between 2007 and 2009, nearly19 percent of large independentfoundati<strong>on</strong>s’ expenditures went to eachof the categories “other expenses” and“other professi<strong>on</strong>al fees.” In general, otherprofessi<strong>on</strong>al fees refers to c<strong>on</strong>sulting servicesassociated with grants administrati<strong>on</strong>,accounting, evaluati<strong>on</strong>, etc., while otherexpenses is a residual category for expensesthat do not fit into <strong>on</strong>e of the major lineitems <strong>on</strong> Form 990-PF. But because thesecategories are vaguely defined and are oftenused as catchalls, it is not clear whetherfoundati<strong>on</strong>s are using the same line items <strong>on</strong>Form 990-PF to report the same expenses(see below).The year-to-year distributi<strong>on</strong> of majorexpense items for large independentfoundati<strong>on</strong>s is mainly c<strong>on</strong>sistent butpatterns have shifted over time.Between 2007 and 2009, compensati<strong>on</strong>’sshare of expenses stayed about even, whileshares of “other expenses” and “otherprofessi<strong>on</strong>al fees” increased slightly. Whenthese major items are compared over time,however, a few changes stand out. Notably,between 2004–2006 and 2007–2009,the share of expenses for “other professi<strong>on</strong>alfees” increased from 14 percent to19 percent, while the share for“compensati<strong>on</strong>” decreased from 50 percentto 46 percent. It appears that somefoundati<strong>on</strong>s, especially the largest <strong>on</strong>es, areincreasingly using c<strong>on</strong>sultants to managetheir programs. 10Percent ChangeFigure 7: Change in Aggregate Finances for the LargestIndependent <str<strong>on</strong>g>Foundati<strong>on</strong></str<strong>on</strong>g>s, 2007, 2008, and 200925%20%15%10%5%0% -23.8%-5%-10%-15%-20%-25%2007–082008–092007–096.3%Total Assets-19.0%7.6%-6.0% 1.1% 17.6%Total GivingCharitable<str<strong>on</strong>g>Administrative</str<strong>on</strong>g><str<strong>on</strong>g>Expenses</str<strong>on</strong>g> 1CharitableCompensati<strong>on</strong> 1Source: The <str<strong>on</strong>g>Foundati<strong>on</strong></str<strong>on</strong>g> Center, 2012: The <str<strong>on</strong>g>Foundati<strong>on</strong></str<strong>on</strong>g> Finances Database (2007–2009). Sample includes1,171 foundati<strong>on</strong>s that ranked am<strong>on</strong>g the approximately 1,900 largest foundati<strong>on</strong>s by giving in 2007,2008, and 2009 for which data were available for all years; qualifying foundati<strong>on</strong>s gave at least $2 milli<strong>on</strong>each year. The data are not adjusted for inflati<strong>on</strong>.1Charitable administrative expenses and compensati<strong>on</strong> are costs related to the foundati<strong>on</strong>’s charitablemissi<strong>on</strong> <strong>on</strong>ly; they exclude investment-related expenses.5.0%23.5%15.8%4.5%21.1%Figure 8: Comp<strong>on</strong>ents of Charitable <str<strong>on</strong>g>Administrative</str<strong>on</strong>g> <str<strong>on</strong>g>Expenses</str<strong>on</strong>g>for the Largest Independent <str<strong>on</strong>g>Foundati<strong>on</strong></str<strong>on</strong>g>s, 2007–2009Compensati<strong>on</strong>46%Other <str<strong>on</strong>g>Expenses</str<strong>on</strong>g>19%Taxes1%Accounting Fees1% Interest1%<str<strong>on</strong>g>Foundati<strong>on</strong></str<strong>on</strong>g>s with Charitable <str<strong>on</strong>g>Administrative</str<strong>on</strong>g> <str<strong>on</strong>g>Expenses</str<strong>on</strong>g>Printing and Publicati<strong>on</strong>sLegal Fees 1%2%Travel, C<strong>on</strong>ferences, and Meetings5%Occupancy6%Other Professi<strong>on</strong>al Fees19%Source: The <str<strong>on</strong>g>Foundati<strong>on</strong></str<strong>on</strong>g> Center, 2012; The <str<strong>on</strong>g>Foundati<strong>on</strong></str<strong>on</strong>g> Finances Database (2007–2009). Includes 1,029of the 1,171 foundati<strong>on</strong>s sampled that reported charitable administrative expenses. These are costsrelated to a foundati<strong>on</strong>’s charitable missi<strong>on</strong> and exclude investment-related expenses. The data are based<strong>on</strong> a three-year average for 2007 through 2009. One hundred and forty-two large foundati<strong>on</strong>s did nothave any charitable administrative expenses.5 © 2012 The <str<strong>on</strong>g>Foundati<strong>on</strong></str<strong>on</strong>g> Center—<str<strong>on</strong>g>Benchmarking</str<strong>on</strong>g> <str<strong>on</strong>g>Foundati<strong>on</strong></str<strong>on</strong>g> <str<strong>on</strong>g>Administrative</str<strong>on</strong>g> <str<strong>on</strong>g>Expenses</str<strong>on</strong>g>77.0%
Changes in Form 990-PF are neededto improve reporting of foundati<strong>on</strong>administrative expenses and promotegreater transparency.IRS Form 990-PF—this study’s maindata source—has not kept up with thechanging activities and costs incurredby private foundati<strong>on</strong>s in areas suchas communicati<strong>on</strong>s, technology, andevaluati<strong>on</strong>. Nor does it adequately capturefoundati<strong>on</strong>s’ growing involvement in directcharitable activities. 11 Am<strong>on</strong>g the expensecategories in the form, “other professi<strong>on</strong>alfees” and “other expenses” are especially inneed of revisi<strong>on</strong>. As noted above, these lineitems have become catchalls that obscurea significant and increasing amount ofoperating expenditures.<str<strong>on</strong>g>Foundati<strong>on</strong></str<strong>on</strong>g> Finances and the Ec<strong>on</strong>omic Crisis: A Different PerspectiveFigure 7 maps aggregate changes in levels of giving, assets,and program-related expenses between 2007 and 2009 for the1,171 large independent foundati<strong>on</strong>s in this study but does notcapture the extreme differences in how individual foundati<strong>on</strong>sfared. Figure A provides this view for the 1,171 foundati<strong>on</strong>s inthe study by showing the distributi<strong>on</strong> of all foundati<strong>on</strong>s by rangeof increase or decrease. For example, even though overall givingby these foundati<strong>on</strong>s stayed about even in this period, nearlythree out of five sampled foundati<strong>on</strong>s reduced their giving. Andeven though the overall charitable administrative expenses ofthe 1,028 foundati<strong>on</strong>s that reported expenses increased byalmost 24 percent, nearly <strong>on</strong>e in three of those foundati<strong>on</strong>s infact reduced their spending. 1 Finally, am<strong>on</strong>g the 759 foundati<strong>on</strong>sthat reported charitable (program-related) compensati<strong>on</strong>, nearly<strong>on</strong>e in three reduced their spending for this purpose. 21These findings <strong>on</strong> changes in the expense levels of the largest independentfoundati<strong>on</strong>s align broadly with the results of a 2009 <str<strong>on</strong>g>Foundati<strong>on</strong></str<strong>on</strong>g> Center survey offoundati<strong>on</strong> practices, although this study’s sample is far larger than the surveysample. Of the 429 independent foundati<strong>on</strong> survey resp<strong>on</strong>dents, 62 percent hadreduced their operating expenses since the beginning of the ec<strong>on</strong>omic crisis.Am<strong>on</strong>g the ways that they had reduced expenses, the most comm<strong>on</strong> were toreduce staff travel and/or limit attendance at c<strong>on</strong>ferences, freeze or reduce staffsalaries, and reduce staff training opportunities. The complete results of thesurvey are included in <str<strong>on</strong>g>Foundati<strong>on</strong></str<strong>on</strong>g>s’ Year-end Outlook for Giving and the Sector(published in November 2009), available at foundati<strong>on</strong>center.org/focus/ec<strong>on</strong>omy.2Another 412 large independent foundati<strong>on</strong>s in the 2007–2009 study paid out nocompensati<strong>on</strong> in any year.Figure A: Changes in Finances of the Largest Independent <str<strong>on</strong>g>Foundati<strong>on</strong></str<strong>on</strong>g>s by Range of Change, 2007–2009AssetsTotal Giving834 134 66 8232 23404 126 165 144 113 219-20% or greater-20% to -10%-10% to 0%0% to 10%10% to 20%20% or greaterCharitable <str<strong>on</strong>g>Administrative</str<strong>on</strong>g> <str<strong>on</strong>g>Expenses</str<strong>on</strong>g>187 73 114 211 137 306Program Related Compensati<strong>on</strong>88 38 82 198 129 2240 200 400 600 800 1,000 1,200Source: The <str<strong>on</strong>g>Foundati<strong>on</strong></str<strong>on</strong>g> Center, 2012: The <str<strong>on</strong>g>Foundati<strong>on</strong></str<strong>on</strong>g> Finances Database (2007–2009). Sample includes 1,171 foundati<strong>on</strong>s that ranked am<strong>on</strong>g the approximately 1,900 largest foundati<strong>on</strong>s by giving in 2007,2008, and 2009 for which data were available for all years; qualifying foundati<strong>on</strong>s gave at least $2 milli<strong>on</strong> each year. Giving level is based <strong>on</strong> a three-year average for 2007 through 2009.6 © 2012 The <str<strong>on</strong>g>Foundati<strong>on</strong></str<strong>on</strong>g> Center—<str<strong>on</strong>g>Benchmarking</str<strong>on</strong>g> <str<strong>on</strong>g>Foundati<strong>on</strong></str<strong>on</strong>g> <str<strong>on</strong>g>Administrative</str<strong>on</strong>g> <str<strong>on</strong>g>Expenses</str<strong>on</strong>g>
endnotes1Loren Renz, <str<strong>on</strong>g>Benchmarking</str<strong>on</strong>g> <str<strong>on</strong>g>Foundati<strong>on</strong></str<strong>on</strong>g> <str<strong>on</strong>g>Administrative</str<strong>on</strong>g><str<strong>on</strong>g>Expenses</str<strong>on</strong>g>: How Operating Characteristics AffectSpending (New York, N.Y.: The <str<strong>on</strong>g>Foundati<strong>on</strong></str<strong>on</strong>g> Center,2011). This study examined 2004–2006 spendingpatterns for 1,026 foundati<strong>on</strong>s that c<strong>on</strong>sistentlyranked am<strong>on</strong>g the approximately 1,500 largestindependent and family foundati<strong>on</strong>s by giving amountand for which Form 990-PF was publicly available forall years.2Elizabeth T. Boris, Loren Renz, et al., What Drives<str<strong>on</strong>g>Foundati<strong>on</strong></str<strong>on</strong>g> <str<strong>on</strong>g>Expenses</str<strong>on</strong>g> and Compensati<strong>on</strong>? Resultsof a Three-Year Study (Washingt<strong>on</strong>, D.C. The UrbanInstitute, the <str<strong>on</strong>g>Foundati<strong>on</strong></str<strong>on</strong>g> Center, and PhilanthropicResearch, Inc., 2006). This study examined2001–2003 spending and compensati<strong>on</strong> patternsfor the largest 10,000 independent, corporate, andcommunity foundati<strong>on</strong>s, ranked by amount of grantspaid in 2001.3Between 2004 and 2006, 35 percent of the largestaffed independent foundati<strong>on</strong>s studied had expenseto-qualifyingdistributi<strong>on</strong> ratios of less than 5 percent,<strong>on</strong> average, while 88 percent of foundati<strong>on</strong>s with nopaid staff were in this range. At the high end,2.2 percent of staffed foundati<strong>on</strong>s had expense ratiosover 30 percent (compared with 2.7 percent for2007–2009).4Between 2007 and 2009, three of the fourfoundati<strong>on</strong>s with expense-to-qualifying distributi<strong>on</strong>ratios c<strong>on</strong>sistently above 50 percent and eight of the14 foundati<strong>on</strong>s with ratios c<strong>on</strong>sistently above30 percent engaged in direct charitable activities.5The proporti<strong>on</strong> of large staffed independentfoundati<strong>on</strong>s that engaged in direct charitable activities<strong>on</strong> a regular basis increased from 18 percent in the2004–2006 study to 20 percent in the 2007–2009study. By year, the number of foundati<strong>on</strong>s that madeDCAs increased from 138 (2007) to 155 (2008) to160 (2009).6Between 2007 and 2009, health c<strong>on</strong>versi<strong>on</strong>foundati<strong>on</strong>s represented four of the 14 large staffedindependent foundati<strong>on</strong>s with expense-to-qualifyingdistributi<strong>on</strong> ratios above 30 percent each year.7Nearly two out of five health c<strong>on</strong>versi<strong>on</strong> foundati<strong>on</strong>sstudied engaged in direct charitable activities,compared with about <strong>on</strong>e out of five n<strong>on</strong>-c<strong>on</strong>versi<strong>on</strong>foundati<strong>on</strong>s.8Between 2006 and 2007, asset values of a matchedset of 1,151 independent foundati<strong>on</strong>s included inthis study increased 15 percent. Between 2004 and2006, total assets of the 1,026 large independentfoundati<strong>on</strong>s in the 2004–2006 study of expensesincreased 15 percent.9While the directi<strong>on</strong> of assets and giving tends to trackthe ec<strong>on</strong>omy, changes in administrative expensepatterns generally follow a l<strong>on</strong>ger time horiz<strong>on</strong>. Plans toexpand instituti<strong>on</strong>al infrastructure—especially staff sizeand program commitments—cannot be easily reversedas assets fluctuate from year to year. This may help toexplain why expenses of studied foundati<strong>on</strong>s increasedby 24 percent between 2007 and 2009, while theirasset values fell by 19 percent and their giving levelsbarely increased. As Figure 7 shows, most of theincrease in expenses occurred between 2007 and2008, whereas the crash in the stock market came inlate 2008.10From 2007–2009, foundati<strong>on</strong>s with at least$500 milli<strong>on</strong> in assets allocated 22 percent of theirexpenses for other professi<strong>on</strong>al fees, <strong>on</strong> average,up from 16 percent from 2004–2006. C<strong>on</strong>versely,they allocated 45 percent of 2007–2009 expensesfor compensati<strong>on</strong>, down from 49 percent in2004–2006. “Other professi<strong>on</strong>al fees” was thefastest growing expense category of the largestendowed foundati<strong>on</strong>s.11For a summary of recommended changes toForm 990-PF, see page 6 of <str<strong>on</strong>g>Benchmarking</str<strong>on</strong>g> <str<strong>on</strong>g>Foundati<strong>on</strong></str<strong>on</strong>g><str<strong>on</strong>g>Administrative</str<strong>on</strong>g> <str<strong>on</strong>g>Expenses</str<strong>on</strong>g> (published in 2011) atfoundati<strong>on</strong>center.org/gainknowledge.Source for all data: The <str<strong>on</strong>g>Foundati<strong>on</strong></str<strong>on</strong>g> Center79 Fifth Avenue u New York, NY 10003foundati<strong>on</strong>center.org u (212) 620-4230For more informati<strong>on</strong>, c<strong>on</strong>tact Reina Mukai at the <str<strong>on</strong>g>Foundati<strong>on</strong></str<strong>on</strong>g> Center, at (212) 807-2485,or via e-mail at rkm@foundati<strong>on</strong>center.org.7 © 2012 The <str<strong>on</strong>g>Foundati<strong>on</strong></str<strong>on</strong>g> Center—<str<strong>on</strong>g>Benchmarking</str<strong>on</strong>g> <str<strong>on</strong>g>Foundati<strong>on</strong></str<strong>on</strong>g> <str<strong>on</strong>g>Administrative</str<strong>on</strong>g> <str<strong>on</strong>g>Expenses</str<strong>on</strong>g>