The Ocular Hypertension Treatment Study - Vision Research ...
The Ocular Hypertension Treatment Study - Vision Research ...
The Ocular Hypertension Treatment Study - Vision Research ...

Create successful ePaper yourself
Turn your PDF publications into a flip-book with our unique Google optimized e-Paper software.
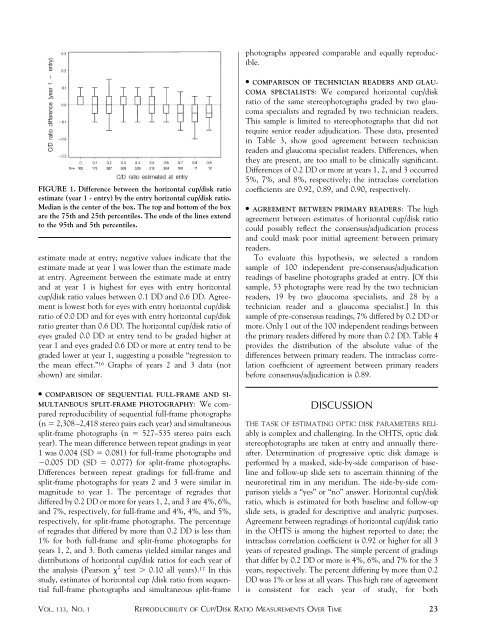
photographs appeared comparable and equally reproducible.FIGURE 1. Difference between the horizontal cup/disk ratioestimate (year 1 - entry) by the entry horizontal cup/disk ratio.Median is the center of the box. <strong>The</strong> top and bottom of the boxare the 75th and 25th percentiles. <strong>The</strong> ends of the lines extendto the 95th and 5th percentiles.estimate made at entry; negative values indicate that theestimate made at year 1 was lower than the estimate madeat entry. Agreement between the estimate made at entryand at year 1 is highest for eyes with entry horizontalcup/disk ratio values between 0.1 DD and 0.6 DD. Agreementis lowest both for eyes with entry horizontal cup/diskratio of 0.0 DD and for eyes with entry horizontal cup/diskratio greater than 0.6 DD. <strong>The</strong> horizontal cup/disk ratio ofeyes graded 0.0 DD at entry tend to be graded higher atyear 1 and eyes graded 0.6 DD or more at entry tend to begraded lower at year 1, suggesting a possible “regression tothe mean effect.” 16 Graphs of years 2 and 3 data (notshown) are similar.● COMPARISON OF SEQUENTIAL FULL-FRAME AND SI-MULTANEOUS SPLIT-FRAME PHOTOGRAPHY: We comparedreproducibility of sequential full-frame photographs(n 2,308–2,418 stereo pairs each year) and simultaneoussplit-frame photographs (n 527–535 stereo pairs eachyear). <strong>The</strong> mean difference between repeat gradings in year1 was 0.004 (SD 0.081) for full-frame photographs and0.005 DD (SD 0.077) for split-frame photographs.Differences between repeat gradings for full-frame andsplit-frame photographs for years 2 and 3 were similar inmagnitude to year 1. <strong>The</strong> percentage of regrades thatdiffered by 0.2 DD or more for years 1, 2, and 3 are 4%, 6%,and 7%, respectively, for full-frame and 4%, 4%, and 5%,respectively, for split-frame photographs. <strong>The</strong> percentageof regrades that differed by more than 0.2 DD is less than1% for both full-frame and split-frame photographs foryears 1, 2, and 3. Both cameras yielded similar ranges anddistributions of horizontal cup/disk ratios for each year ofthe analysis (Pearson 2 test 0.10 all years). 17 In thisstudy, estimates of horizontal cup /disk ratio from sequentialfull-frame photographs and simultaneous split-frame● COMPARISON OF TECHNICIAN READERS AND GLAU-COMA SPECIALISTS: We compared horizontal cup/diskratio of the same stereophotographs graded by two glaucomaspecialists and regraded by two technician readers.This sample is limited to stereophotographs that did notrequire senior reader adjudication. <strong>The</strong>se data, presentedin Table 3, show good agreement between technicianreaders and glaucoma specialist readers. Differences, whenthey are present, are too small to be clinically significant.Differences of 0.2 DD or more at years 1, 2, and 3 occurred5%, 7%, and 8%, respectively; the intraclass correlationcoefficients are 0.92, 0.89, and 0.90, respectively.● AGREEMENT BETWEEN PRIMARY READERS: <strong>The</strong> highagreement between estimates of horizontal cup/disk ratiocould possibly reflect the consensus/adjudication processand could mask poor initial agreement between primaryreaders.To evaluate this hypothesis, we selected a randomsample of 100 independent pre-consensus/adjudicationreadings of baseline photographs graded at entry. [Of thissample, 53 photographs were read by the two technicianreaders, 19 by two glaucoma specialists, and 28 by atechnician reader and a glaucoma specialist.] In thissample of pre-consensus readings, 7% differed by 0.2 DD ormore. Only 1 out of the 100 independent readings betweenthe primary readers differed by more than 0.2 DD. Table 4provides the distribution of the absolute value of thedifferences between primary readers. <strong>The</strong> intraclass correlationcoefficient of agreement between primary readersbefore consensus/adjudication is 0.89.DISCUSSIONTHE TASK OF ESTIMATING OPTIC DISK PARAMETERS RELIablyis complex and challenging. In the OHTS, optic diskstereophotographs are taken at entry and annually thereafter.Determination of progressive optic disk damage isperformed by a masked, side-by-side comparison of baselineand follow-up slide sets to ascertain thinning of theneuroretinal rim in any meridian. <strong>The</strong> side-by-side comparisonyields a “yes” or “no” answer. Horizontal cup/diskratio, which is estimated for both baseline and follow-upslide sets, is graded for descriptive and analytic purposes.Agreement between regradings of horizontal cup/disk ratioin the OHTS is among the highest reported to date; theintraclass correlation coefficient is 0.92 or higher for all 3years of repeated gradings. <strong>The</strong> simple percent of gradingsthat differ by 0.2 DD or more is 4%, 6%, and 7% for the 3years, respectively. <strong>The</strong> percent differing by more than 0.2DD was 1% or less at all years. This high rate of agreementis consistent for each year of study, for bothVOL. 133, NO. 1 REPRODUCIBILITY OF CUP/DISK RATIO MEASUREMENTS OVER TIME23