Key Advances and Remaining Knowledge Gaps in Remote Sensing ...
Key Advances and Remaining Knowledge Gaps in Remote Sensing ...
Key Advances and Remaining Knowledge Gaps in Remote Sensing ...

You also want an ePaper? Increase the reach of your titles
YUMPU automatically turns print PDFs into web optimized ePapers that Google loves.
<strong>Key</strong> <strong>Advances</strong> <strong>and</strong> <strong>Rema<strong>in</strong><strong>in</strong>g</strong><strong>Knowledge</strong> <strong>Gaps</strong> <strong>in</strong> <strong>Remote</strong> Sens<strong>in</strong>gfor Precision AgricultureD. J. MullaProfessor <strong>and</strong> Larson Chair forSoil <strong>and</strong> Water ResourcesDirector Precision Agriculture CenterDept. Soil, Water <strong>and</strong> ClimateUniversity of M<strong>in</strong>nesota
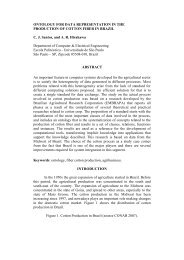
Precision Agriculture• A managementpractice applied atthe right time <strong>and</strong>the right place <strong>in</strong>the right amount• Field sub-regionmanagement– Nutrients– Dra<strong>in</strong>age orIrrigation– Pests <strong>and</strong> Weeds– Tillage <strong>and</strong> Seed<strong>in</strong>g
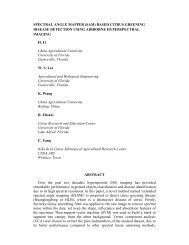
Precision ManagementOptimal ResourceManagementImplementationWISDOMDecisionProcessKNOWLEDGEMap BasedorReal TimeApproachAnalysis <strong>and</strong>DiagnosticsDataCollectionDATAInformationManagementINFORMATION
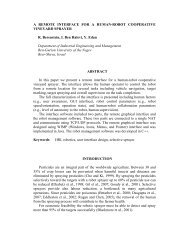
The Electromagnetic Spectrum
<strong>Remote</strong> Sens<strong>in</strong>g• Bare soil reflectance– Soil organic carbon <strong>and</strong> water content– Iron oxides or carbonates• Crop reflectance– Leaf area <strong>in</strong>dex– Crop growth stage– Crop color <strong>and</strong> leaf N status– Weeds <strong>and</strong> disease• Thermal emission of energy– Surface temperature <strong>and</strong> crop water stress
<strong>Remote</strong> Sens<strong>in</strong>g Applications• Mapp<strong>in</strong>g crop variability– Crop growth, biomass, <strong>and</strong> yield– Crop pphenology <strong>and</strong> evapotranspirationp– Crop stresses due to nutrients, disease,weeds, <strong>and</strong> <strong>in</strong>sects• Mapp<strong>in</strong>g soil variability• Targeted sampl<strong>in</strong>g• Management zone del<strong>in</strong>eation• Ability to monitor changes over time
<strong>Remote</strong> Sens<strong>in</strong>g Sugar Beetsg g(Seelan et al., 2003)
History of <strong>Remote</strong> Sens<strong>in</strong>g
Satellite <strong>Remote</strong> Sens<strong>in</strong>gSatelliteSpectral B<strong>and</strong>sReturnSuitability(Year)(Spatial Resolution)Frequencyfor PA(d)L<strong>and</strong>sat 1 (1972) G, R, two IR (56x79 m) 18 LAVHRR (1978) R, NIR, two TIR (1090 m) 1 LL<strong>and</strong>sat 5 TM (1984) B, G, R, two NIR, MIR, TIR (30 m) 16 MSPOT 1 (1986) G, R, NIR (20 m) 2-6 MIRS 1A (1988) BGRNIR(72 B, G, R, m) 22 MERS-1 (1991) Ku b<strong>and</strong> altimeter, IR (20 m) 35 LJERS-1 (1992) L b<strong>and</strong> radar (18 m) 44 L
Satellite <strong>Remote</strong> Sens<strong>in</strong>gSatelliteSpectral B<strong>and</strong>sReturnSuitability(Year) (Spatial Resolution) Frequencyfor PAIKONOS (1999) Panchromatic, B, G, R, NIR (1-4 m) 3 H(d)Terra EOS ASTERG, R, NIR & 6 MIR, 5 TIR b<strong>and</strong>s (15-90 m) 16 M(2000)EO-1Hyperion (2000) 400-2500 nm, 10 nm b<strong>and</strong>width (30 m) 16 HQuickBird (2001) Panchromatic, B, G, R, NIR (0.61-2.4 m) 1-4 HEOS MODIS (2002) 36 b<strong>and</strong>s <strong>in</strong> VIS-IR (250-1000 m) 1-2 LRapidEye (2008) B, G, R, Red edge, NIR (6.5 m) 5.5 HGeoEye-1 (2008) Panchromatic, B, G, R, NIR1, NIR2 (1.6 m) 2-8 HWorldView-2 (2009) PBGYRRededge P, B, G, Y, R, Red edge, NIR (0.5 m) 11 1.1 H
Increas<strong>in</strong>g Spatial Resolution ofImagery
Pixel Size
Increased Homogeneity of Pixels
Limitations to Satellite<strong>Remote</strong> Sens<strong>in</strong>g• Coarse spatial resolution <strong>and</strong> <strong>in</strong>frequentrepeat coverage for older satellite platforms• Difficulty obta<strong>in</strong><strong>in</strong>g images when needed• Interference from clouds• Changes <strong>in</strong> irradiance on multiple passes• Slow turn-around time due to imageprocess<strong>in</strong>g for calibration, corrections, <strong>and</strong>geo-rectification• Cost ranges from $23 - $45/km 2
Aerial <strong>Remote</strong>Sens<strong>in</strong>g• Airplanes• UnmannedAerial Vehicles
Proximal <strong>Remote</strong> Sens<strong>in</strong>g• Sensors can be mounted on tractors,spreaders, sprayers or irrigation booms– GreenSeeker– Crop Circle– WeedSeeker– Infrared thermometers• Allows real time site specificmanagement of fertilizer, pesticides orirrigation
Data Interpretation• Classification (Bauer, 2000)– Supervised, unsupervised, multi-temporal temporal data sets,decision tree classifiers, neural network classification,guided cluster<strong>in</strong>g, fuzzy sets, contextual classifiers,<strong>and</strong> use of auxiliary <strong>in</strong>formation• Pattern Detection (Civco, 2002)– Image differenc<strong>in</strong>g, cross correlation, chemometricanalysis, pr<strong>in</strong>cipal component analysis, neuralnetworks, object oriented classification (Walker, 2003),fuzzy set theory (Viscarra Rossel, 2006)• Assess accuracy (Congalton, 1991; Foody, 2002)Vi l t A i S li t t i– Visual assessment, Area comparisons, Sampl<strong>in</strong>g strategies,Kappa statistic, Confusion matrix
Traditional Classification
Fuzzy Classification
Spectral Decomposition <strong>and</strong>Chemometrics• Spectral Mix<strong>in</strong>g <strong>in</strong>g Analysis (Huete, 1991)• Pr<strong>in</strong>cipal Component Analysis• Partial Least Squares Regression (L<strong>in</strong>dgren,1994)• Stepwise Multiple l L<strong>in</strong>ear Regression• Multiple Regression Analysis• Multivariate i t Adaptive Regression Spl<strong>in</strong>es
Spectral Mix<strong>in</strong>g Analysiswhere ρ is reflectance, m are end-members, k are b<strong>and</strong>s, <strong>and</strong> i,j are pixels
Pr<strong>in</strong>cipal Component Analysis
Artificial Neural NetworksOutput Layerweight<strong>in</strong>g factorsa summation functiona transfer functionInputLayerNeuron(hidden)Miao, Y., D. J. Mulla <strong>and</strong>P. C. Robert. Prec. Agric.7(2):117-136, 2006scal<strong>in</strong>g <strong>and</strong> limit<strong>in</strong>g processesan output tfunctionan error functiona back-propagated value/learn<strong>in</strong>g function
Pixel Accuracy AssessmentNon-Spatial Accuracy TestBorder Pixel Accuracy Important
Confusion MatrixOmission errors <strong>in</strong>volve underestimation of a classOmission errors <strong>in</strong>volve underestimation of a classCommission errors <strong>in</strong>volve overestimation of a class
Accuracy AssessmentStatisticsKappa Statisticfor ClassificationAccuracy
Confusion MatrixDCNIRB Leaf NUser's CommissionHigh Moderate Low None Total Accuracy ErrorHigh 19 2 1 0 22 0.86 0.14Moderate 2 3 0 2 7 0.43 0.57Low 2 1 2 4 9 0.22 0.78None 0 1 9 32 42 076 0.76 024 0.24Total 23 7 12 38 80Producer's Accuracy 0.83 0.43 0.17 0.84 0.70Omission Error 0.17 0.57 0.83 0.16Nigon, Rosen, Mulla et al., 2012
Estimate Biophysical orBiochemical VariablesCourtesy of Drs. V.C. Patily<strong>and</strong> K.A. Al-Gaadi,K<strong>in</strong>g Saud University
Spatial Pattern
Spatial Pattern is Complicated whenHyperspectral Data are <strong>in</strong>volved!
Integration of Imagery <strong>in</strong> GIS
Statistical <strong>Advances</strong>• Traditional statistics– Mean <strong>and</strong> dispersion– Histograms• Spatial <strong>and</strong> non-traditional statistics– Spatial filter<strong>in</strong>g (low <strong>and</strong> high pass kernalfilters, Kalman filters, wavelets, etc)– Homogeneity, Contrast, Dissimilarity– Geostatistical analysis
Us<strong>in</strong>g Geostatistics toCorrect Errors <strong>in</strong> RS Images• Used when pixels are miss<strong>in</strong>g– Cloud cover or satellite malfunctionRossi et al., Rem. Sens. Environ. 49:32-40, 1994Zhu et al., Rem. Sens. Environ.124:49-60, 2012
Spatial Model<strong>in</strong>g & InterpolationCokrig<strong>in</strong>g Krig<strong>in</strong>gMulla D J Geostatistics remote sens<strong>in</strong>g <strong>and</strong> precision farm<strong>in</strong>g 1997 pp 100 119Mulla, D. J. Geostatistics, remote sens<strong>in</strong>g <strong>and</strong> precision farm<strong>in</strong>g. 1997. pp 100-119.In: A. Ste<strong>in</strong> <strong>and</strong> J. Bouma (eds.), Precision Agriculture: Spatial <strong>and</strong> Temporal Variabilityof Environmental Quality. Ciba Foundation Symposium 210. Wiley, Chichester.
400Kriged Phosphorus (ppm)300(m)DIS STANCE2001000 0 100 200 300 400 500 600DISTANCE (m)
400Cokriged Phosphorus (ppm)300(m)DISTANCE2001000 0 100 200 300 400 500 600DISTANCE (m)
Targeted Soil Sampl<strong>in</strong>g StrategyBased on Bare Soil NIR Image1501005000 100 200 300 400 500 600 700 800
Applications of <strong>Remote</strong> Sens<strong>in</strong>g<strong>in</strong> Precision Ag• Crop growth stages, LAI, biomass, <strong>and</strong>yield• Crop chlorophyll <strong>and</strong> nitrogen stress• Crop ET <strong>and</strong> water stress• Weed, <strong>in</strong>sect <strong>and</strong> disease <strong>in</strong>festations• Soil sal<strong>in</strong>ity, organic matter, moisture, etc• Del<strong>in</strong>eat<strong>in</strong>g management zones• Precision conservation
Crop SensorsYear Innovation Citation1992 SPAD meter (650, 940 nm) used to detect NSchepers et al., 1992dfii deficiency <strong>in</strong> corn1995 Nitrogen Sufficiency Indices Blackmer <strong>and</strong> Schepers,19951996 Optical sensor (671, 780 nm) used for on-the-goStone et al. (1996)detection of variability <strong>in</strong> plant nitrogen stress2002 Yara N sensor (450-900 nm) L<strong>in</strong>k et al. (2002), TopConIndustries2002 GreenSeeker (650, 770 nm) Raun et al. (2002), NTechIndustries2004 Crop Circle (590, 880 nm or 670, 730, 780 nm) Holl<strong>and</strong> et al (2004), Holl<strong>and</strong>Scientific2002 CASI hyperspectral sensor based <strong>in</strong>dexHaboudane et al. (2002;measurements of chlorophyll2004)
Spectral Signatures
Visible Absorption Spectrum
The Red-NIR Reflectance Space
Satellite RS-based N Managementof Rice <strong>in</strong> Northeast Ch<strong>in</strong>a2010-6-3 2010-6-25 25 2010-7-14 14 2010-7-30生 Dfii Deficient生 NormalExcessiveVillage levelField levelCourtesy ofDr. Y. Miao,Beij<strong>in</strong>g Agric. Univ.
Crop Sensor-based N Management Strategy (Ch<strong>in</strong>a)(Li et al., 2009. Soil Science Society of America Journal 73:1566-1574)1)N Rate (kg ha -1500400300200100Soil_basedSensor_basedFPN Rate02006 2007Yeard (kg ha -1 )Gra<strong>in</strong> Yiel700060005000400030002000100002006 2007YearW<strong>in</strong>ter Wheat Yield
Spectral Indices• Canopy reflectance is affected by water,chlorophyll, h ll canopy density <strong>and</strong> age, soil, etc• Leaf water potential <strong>and</strong> leaf temperature– 1981 Crop Water Stress Index (Jackson)• Leaf Area Index– 1974 NDVI (Rouse, 670 & 800 nm)• Soil Adjusted Vegetative Index (670 & 800 nm)– 1994 MSAVI (Qi)• Chlorophyll Absorption Ratio Index– 2000 MCARI (Daughtry, 550, 670 & 700 nm)
Crop Water StressHigh water Treatments (low temperatures)Blue <strong>and</strong> green spotsThermal Crop WaterStress Indices.– Crop: Cotton– Location: Arizona– Sensor: Thermalscanners (helicopter)Source: http://www.uswcl.ars.ag.govLow water Treatments (high temperatures)Yellow <strong>and</strong> orange spots.
RGBThermalCourtesy Drs. V. Alchanatis &Y. Cohen, Volcani Center, ARO<strong>and</strong> Pivot Irrigation & Pump<strong>in</strong>g
Types of Reflectance Spectra• Panchromatic reflectance– An average over all wavelengths• Broad b<strong>and</strong> or multispectral reflectance– Reflectance at a few specific discretewavelengths– B, G, R NIR portions of spectrum• Hyperspectral reflectance– Reflectance at specific narrow b<strong>and</strong>discrete wavelengths across a largecont<strong>in</strong>uous spectral range
Multi-spectral broad-b<strong>and</strong> vegetation<strong>in</strong>dices available for use <strong>in</strong> PrecisionAgricultureIndex Def<strong>in</strong>ition ReferenceGDVI NIR-G Tucker, 1979NDVI (NIR-R)/(NIR+R) Rouse et al., 1973GNDVI (NIR-G)/(NIR+G) Gitelson et al., 1996SAVI 1.5 * [(NIR-R)/(NIR+R+0.5)] Huete, 1988GSAVI 1.5 * [(NIR-G)/(NIR+G+0.5)] Sripada et al., 2005OSAVI (NIR-R)/(NIR+R+0.16) Rondeaux et al., 1996
Hyperspectral Data CubeNigon, Rosen, Mulla et al., 2012
Best Reflectance Wavelengths?Thenkabail et al. (2000)• The greatest <strong>in</strong>formation about plant characteristics withmultiple narrow b<strong>and</strong>s <strong>in</strong>cludes the longer redwavelengths (650-700 nm), shorter green wavelengths(500-550550 nm), red-edge edge (720 nm), <strong>and</strong> NIR (900-940940 nm<strong>and</strong> 982 nm) spectral b<strong>and</strong>s– The <strong>in</strong>formation <strong>in</strong> these b<strong>and</strong>s is only available <strong>in</strong> narrow<strong>in</strong>crements of 10-20 nm, <strong>and</strong> is easily obscured <strong>in</strong> broadmultispectral b<strong>and</strong>s that are available with older satellites• The best comb<strong>in</strong>ation of two narrow b<strong>and</strong>s <strong>in</strong> NDVI-like<strong>in</strong>dices is centered <strong>in</strong> the red (682 nm) <strong>and</strong> NIR (920 nm)wavelengths, but varies depend<strong>in</strong>g on the type of crop, aswell as the plant characteristic of <strong>in</strong>terest
Hyperspectral narrow-b<strong>and</strong>vegetation <strong>in</strong>dices available for use<strong>in</strong> precision agricultureIndex Def<strong>in</strong>ition ReferenceSR1 NIR/Red = R 801 /R 670 Daughtry et al., 2000SR7 R 860 /(R 550 * R 708 ) Datt, 1998NDVI (R 800 -R 680 )/(R 800 +R 680 ) Lichtenthaler et al.,1996Green NDVI (R 801 -R 550 )/(R 800 +R 550 ) Daughtry et al., 2000(GNDVI)NDI1 (R 780 -R 710 )/(R 780 -R 680 ) Datt, 1999NDI2 (R 850 -R 710 )/(R 850 -R 680 ) Datt, 1999
Hyperspectral narrow-b<strong>and</strong>vegetation <strong>in</strong>dices available for use<strong>in</strong> precision agricultureIndex Def<strong>in</strong>ition ReferenceMCARI [(R 700 -R 670 )-0.2(R 700 -R 550 )](R 700 /R 670 ) Daughtry et al., 2000TCARI 3*[(R 700 -R 670 )-0.2*(R 700 -R 550 )(R 700 /R 670 )] Haboudane et al., 2002OSAVI (1+0.16)(R 800 -R 670 )/(R 800 +R 670 +0.16) Rondeaux et al., 1996MSAVI 0.5[2R 800 +1-SQRT((2R 800 +1) 2 -8(R 800 -R 670 ))] Qi et al., 1994MCARI21.5[2.5( R800 R670)1.3(R800 R550)]Haboudane et al., 2004(2R8001)2 (6R800 5R670) 0.5
Derivative Spectra• Hyperspectral reflectance data are collected <strong>in</strong>nearly cont<strong>in</strong>uous narrow b<strong>and</strong>s across a widerange of wavelengths• The derivative of hyperspectral reflectance datacan be very useful at <strong>in</strong>dicat<strong>in</strong>g portions of thespectrum where the slope of the reflectancecurve changes rapidly• Derivative spectra reduce <strong>in</strong>terference from soil
Derivative SpectraNigon, Rosen, Mulla et al., 2012
Lambda-Lambda Plots• Lambda-lambda plots <strong>in</strong>volve calculat<strong>in</strong>g, forexample, the r 2 coefficient for leaf N content at allhyperspectral reflectance b<strong>and</strong>s• A graph of the r 2 coefficient for all possiblecomb<strong>in</strong>ations of b<strong>and</strong> 1 on the x-axis <strong>and</strong> b<strong>and</strong> 2 onthe y-axis results <strong>in</strong> a lambda-lambda plot• The lambda-lambda plot is useful for identify<strong>in</strong>gwhich comb<strong>in</strong>ations of two b<strong>and</strong>s conta<strong>in</strong> redundant<strong>in</strong>formation about N stress• Spectral b<strong>and</strong>s or narrow b<strong>and</strong> <strong>in</strong>dices should beselected with low r 2 coefficients to elim<strong>in</strong>ateredundancy <strong>and</strong> maximize <strong>in</strong>formation about cropcharacteristics (such as N stress).
LambdalambdaplotNigon,Rosen,Mulla et al.,2012
Temporal Analysis of Data
In-Season N Management(From J. Schepers, 2005)
Properties of N deficient Plants• Green reflectance<strong>in</strong>creases• Red reflectance<strong>in</strong>creases & NIRreflectancedecreases• Differences <strong>in</strong>reflectance greatestbetween 550 – 600nm, followed byred-edge (680 –730 nm)
Hyperspectral Imag<strong>in</strong>g forN Sufficiency <strong>in</strong> MaizeCM = 56.74 + 6.48 * R 713 + 2.02 * R 953 + 8.42 * R 666 - 9.87 * R 695- 0.75 * R 972 - 19.57 * R 554 + 16.68 * R 499 - 1.66 * R 934Miao et al., Precision Agriculture 10:45-62, 2009
Promis<strong>in</strong>g Indices for Crop N StressNormalized Difference Index 2:
Results/discussionLeaf NN stress <strong>in</strong> potatoNDI2Nigon, Rosen, Mulla et al., 2012
Leaf N (CV 14%) NDVI (CV 5%)Nigon,Rosen,Mulla,2012DCNI (CV 15%) NDVI1 (CV 26%)
LiDAR• Light Detection <strong>and</strong> Rang<strong>in</strong>gscans earth’s surface us<strong>in</strong>ga laser with visible radiation• Provides a high resolutionDigital Elevation Model(DEM) which can beprocessed <strong>in</strong> GIS with terra<strong>in</strong>analysis– Slope, curvature, flowaccumulation, etc.– Stream power, topographicwetness, etc.
Side InletPrecision Conservation<strong>in</strong> Critical Source AreasGalzki, J., A. S. Birr <strong>and</strong> D. J. Mulla. 2011.J. Soil Water Conserv. 66:423-430.430.Gully• Two criteria:• Accumulationof surface flow• Hydrologicconnection tosurface waters• GIS basedLiDAR dataused toidentify CSAs
Example: Us<strong>in</strong>g Specific Catchment Area to Identify Critical Source AreasBeauford Watershed (Blue Earth County)
Conclusions• Precision agriculture dates back to the middleof the 1980’s• <strong>Remote</strong> sens<strong>in</strong>g applications <strong>in</strong> precisionagriculture began with sensors for soilorganic matter, <strong>and</strong> have quickly diversified to<strong>in</strong>clude satellite, aerial, unmanned aerialvehicles, tractors, spreaders, sprayers <strong>and</strong>irrigation booms• Spatial resolution of aerial <strong>and</strong> satelliteremote sens<strong>in</strong>g imagery has improved from100’s ofmtosubmeter sub-meter accuracy
Conclusions• Wavelengths <strong>in</strong> use range from the ultravioletto microwave portions of the spectrum– Red edge reflectance is <strong>in</strong>creas<strong>in</strong>gly available– LiDAR, fluorescence <strong>and</strong> thermal spectroscopyhave advancedd• Spectral b<strong>and</strong>width has decreased with theadvent of hyperspectral remote sens<strong>in</strong>g• A variety of useful spectral <strong>in</strong>dices now existfor various precision agriculture applications– The best spectral <strong>in</strong>dices for N stress are robustover crop species, variety <strong>and</strong> growth stage (withhigh r 2 <strong>and</strong> CV)
Conclusions• Return frequency of satellite remote sens<strong>in</strong>gimagery has improved dramatically– Timel<strong>in</strong>ess, cloud <strong>in</strong>terference <strong>and</strong> cost of imageryare still issues• More research on remote sens<strong>in</strong>g withunmanned aerial vehicles is needed toimprove the timel<strong>in</strong>ess of data collection• Errors <strong>in</strong> geo-rectification <strong>and</strong> geometriccorrection from aerial platforms are becom<strong>in</strong>gmore important relative to image pixel size
<strong>Rema<strong>in</strong><strong>in</strong>g</strong> <strong>Knowledge</strong> <strong>Gaps</strong>• More emphasis is needed on chemometricmethods of analysis to assess cropbiophysical <strong>and</strong> biochemical characteristics• Spectral <strong>in</strong>dices that t simultaneously l allow forassessment of multiple crop stresses (e.g;water, nitrogen <strong>and</strong> disease) are lack<strong>in</strong>g• Higher spatial resolution of aerial remotesens<strong>in</strong>g is needed for early detection ofdisease
<strong>Rema<strong>in</strong><strong>in</strong>g</strong> <strong>Knowledge</strong> <strong>Gaps</strong>• Sensors are needed for direct estimation ofnutrient t deficiencies i i without t the use ofreference strips• There are many algorithms <strong>and</strong> spectral<strong>in</strong>dices for management of crop N stress– The utility of these seems to vary by year, croptype, variety <strong>and</strong> growth stage– Simple, generalizable solutions are needed• <strong>Remote</strong> sens<strong>in</strong>g needs to be better <strong>in</strong>tegratedwith automated, onl<strong>in</strong>e soil <strong>and</strong> cropmanagement decision support systems
<strong>Rema<strong>in</strong><strong>in</strong>g</strong> <strong>Knowledge</strong> <strong>Gaps</strong>• At present there is considerable <strong>in</strong>terest <strong>in</strong>collect<strong>in</strong>g remote sens<strong>in</strong>g data at multipletimes <strong>in</strong> order to conduct near real time soil,crop <strong>and</strong> pest management• We have progressed from farm<strong>in</strong>g by soil, tofarm<strong>in</strong>g by grid cell to farm<strong>in</strong>g bymanagement zone <strong>and</strong> now the challenge isto manage <strong>in</strong>dividual plants <strong>in</strong> real-time
Questions?Acknowledgement: Some images were obta<strong>in</strong>ed from“Fundamentals of Satellite <strong>Remote</strong> Sens<strong>in</strong>g”by Chuvieco <strong>and</strong> Huete (2010)