Introduction to Statistics, Lecture 11 - Regression Analysis (Chapter ...
Introduction to Statistics, Lecture 11 - Regression Analysis (Chapter ...
Introduction to Statistics, Lecture 11 - Regression Analysis (Chapter ...

Create successful ePaper yourself
Turn your PDF publications into a flip-book with our unique Google optimized e-Paper software.
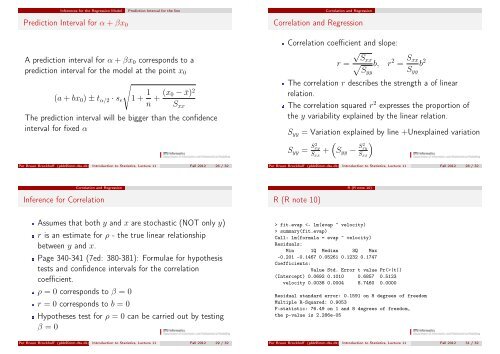
Inferences for the <strong>Regression</strong> ModelPrediction Interval for α + βx 0Prediction Interval for the lineCorrelation and <strong>Regression</strong>Correlation and <strong>Regression</strong>Correlation coefficient and slope:A prediction interval for α + βx 0 corresponds <strong>to</strong> aprediction interval for the model at the point x 0(a + bx 0 ) ± t α/2 · s e√1 + 1 n + (x 0 − ¯x) 2S xxThe prediction interval will be bigger than the confidenceinterval for fixed αPer Bruun Brockhoff (pbb@imm.dtu.dk) <strong>Introduction</strong> <strong>to</strong> <strong>Statistics</strong>, <strong>Lecture</strong> <strong>11</strong> Fall 2012 26 / 32r =√Sxx√Syyb,r 2 = S xxS yyb 2The correlation r describes the strength a of linearrelation.The correlation squared r 2 expresses the proportion ofthe y variability explained by the linear relation.S yy = Variation explained by line +Unexplained variation( )S yy = S2 xyS xx+ S yy − S2 xyS xxPer Bruun Brockhoff (pbb@imm.dtu.dk) <strong>Introduction</strong> <strong>to</strong> <strong>Statistics</strong>, <strong>Lecture</strong> <strong>11</strong> Fall 2012 28 / 32Correlation and <strong>Regression</strong>Inference for CorrelationR (R note 10)R (R note 10)Assumes that both y and x are s<strong>to</strong>chastic (NOT only y)r is an estimate for ρ - the true linear relationshipbetween y and x.Page 340-341 (7ed: 380-381): Formulae for hypothesistests and confidence intervals for the correlationcoefficient.ρ = 0 corresponds <strong>to</strong> β = 0r = 0 corresponds <strong>to</strong> b = 0Hypotheses test for ρ = 0 can be carried out by testingβ = 0> fit.evap summary(fit.evap)Call: lm(formula = evap ~ velocity)Residuals:Min 1Q Median 3Q Max-0.201 -0.1467 0.05261 0.1232 0.1747Coefficients:Value Std. Error t value Pr(>|t|)(Intercept) 0.0692 0.1010 0.6857 0.5123velocity 0.0038 0.0004 8.7460 0.0000Residual standard error: 0.1591 on 8 degrees of freedomMultiple R-Squared: 0.9053F-statistic: 76.49 on 1 and 8 degrees of freedom,the p-value is 2.286e-05Per Bruun Brockhoff (pbb@imm.dtu.dk) <strong>Introduction</strong> <strong>to</strong> <strong>Statistics</strong>, <strong>Lecture</strong> <strong>11</strong> Fall 2012 29 / 32Per Bruun Brockhoff (pbb@imm.dtu.dk) <strong>Introduction</strong> <strong>to</strong> <strong>Statistics</strong>, <strong>Lecture</strong> <strong>11</strong> Fall 2012 31 / 32